
Following the Smart Money
Previously, I looked at using the Smart Money / Dumb Money Spread as a signal for trading both long and short. Annual returns on that trading signal were 2.24% using no leverage.
We had a request come in to take a look at using the Smart Money model as a trading signal. The request was much bigger than the simple strategy below, but I wanted to use the request as a way to work through a couple blog posts on Smart Money and building signals / strategies from the model.
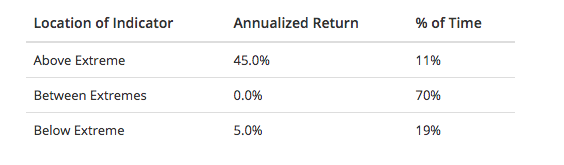
First off, as always, I like to take a look at the annualized threshold returns for the signal before building any strategies. The threshold returns for the Smart Money model shows a very positive skew when readings are above 0.70.
[caption id="attachment_911" align="aligncenter" width="564"] Figure 1: Threshold returns for the Smart Money Model[/caption]
For this strategy, I'm going to use the same approach I've taken previously. This will be a long-only strategy. Trading rules are defined below.
Trading Rules
- Trading dates are Sept 16 1996 to Oct 21 2016 (entire history of the model)
- Long only
- No Margin. Account size is $250K.
- 1,000 shares of SPY ETF
- Commission of $10 per trade
- $0.01 per share slippage
- Go long when:
- Smart Money closes above 0.70 (Excessive Optimism)
- Close when:
- Smart Money closes below 0.30 (Excessive Pessimism)
- All orders are entered at the open of the next day’s trading session after a signal is given.
This strategy doesn't provide a large number of trades, but it does provide some very good returns. Some basic trade statistics are provided below.
[caption id="attachment_913" align="aligncenter" width="392"]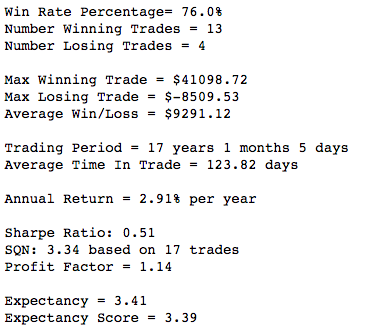 Figure 2: Trade statistics for the Smart Money Model[/caption]
[caption id="attachment_915" align="aligncenter" width="281"]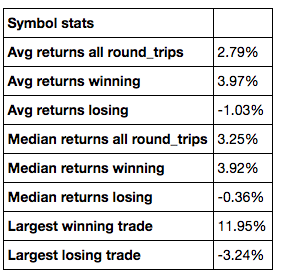 Figure 3: Win/Loss statistics for the Smart Money Model[/caption]
This simple strategy delivers some pretty good results with some volatility (see cumulative return volatility compared to benchmark chart below). Overall, following the smart money delivers excellent results (2.91% annualized without leverage). Performance charts for this strategy are provided below with in-sample and out-of-sample data (out-of-sample is all dates after Jan 1 2015). Note: Out-of-sample returns are ~4% compared to the 2.91% returns found in-sample.
[caption id="attachment_917" align="aligncenter" width="600"]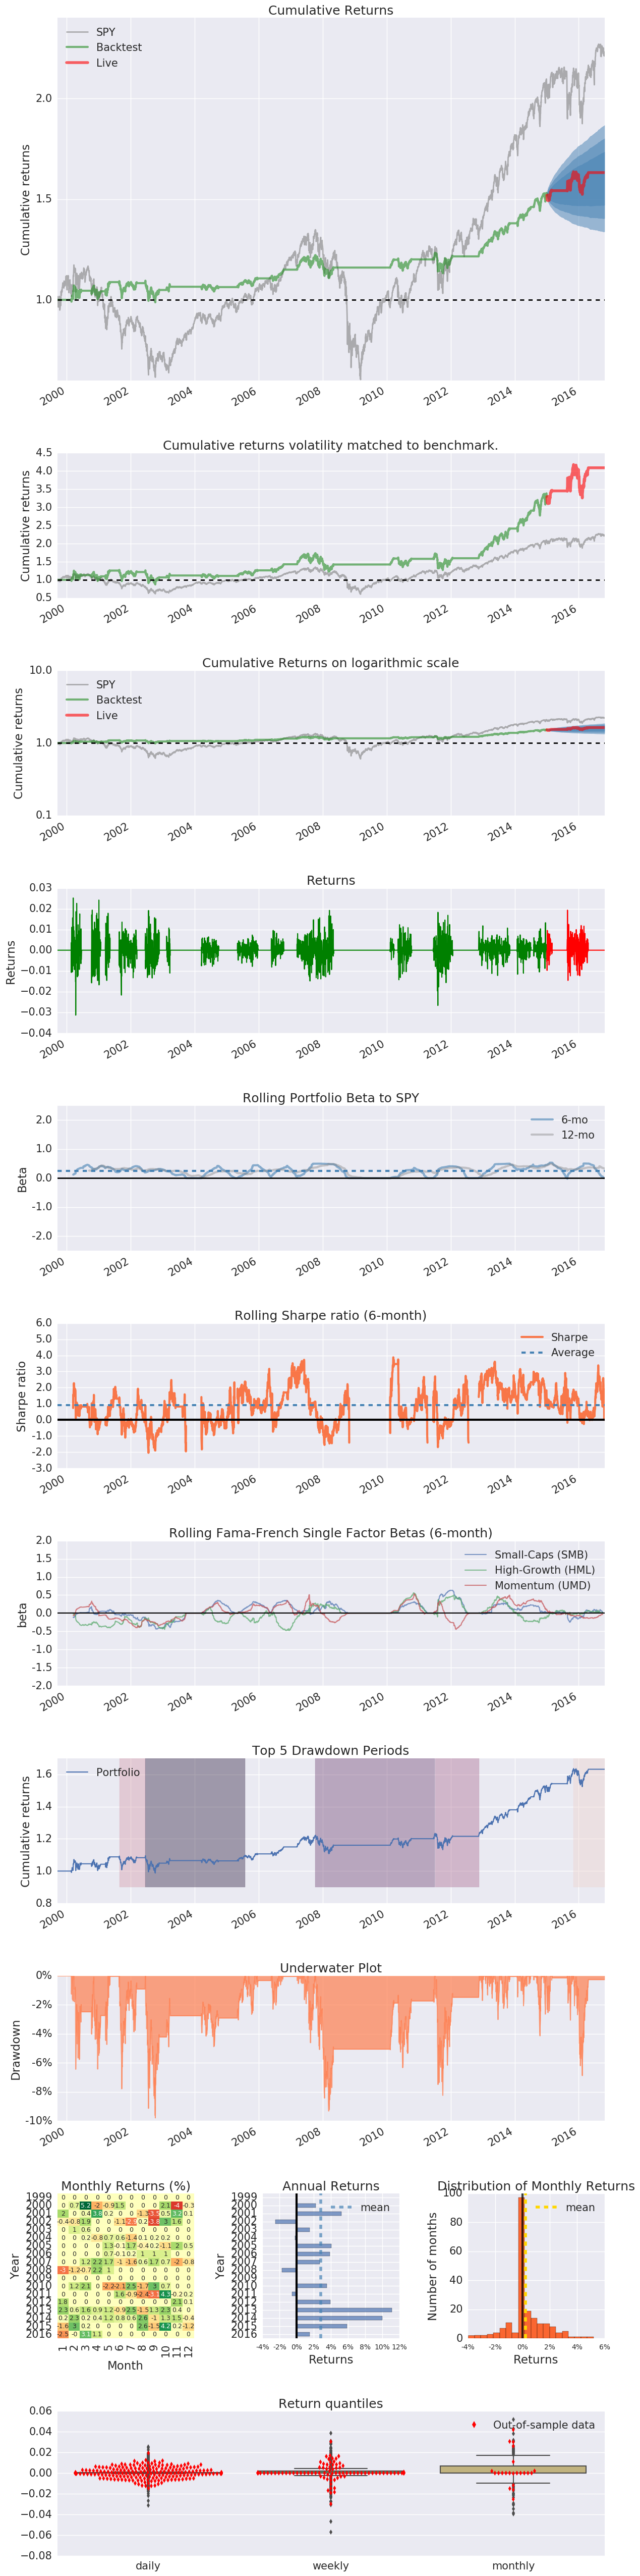 Figure 4: Performance Charts for the Smart Money Model[/caption]
Check back next week for another look at using the Smart Money model as a signal.