Following the Smart Money (Part 3)
This is part 3 of a multi-part series that takes a look at using the Smart Money model as a signal for investing in the S&P500 (using the SPY ETF). The previous posts can be found here and here.
In this post, rather than use the Smart Money model as an indicator to go 'all in' or 'all out', we'll use it as an indicator to determine the weighting of our investment in SPY.
The strategy's rules are:
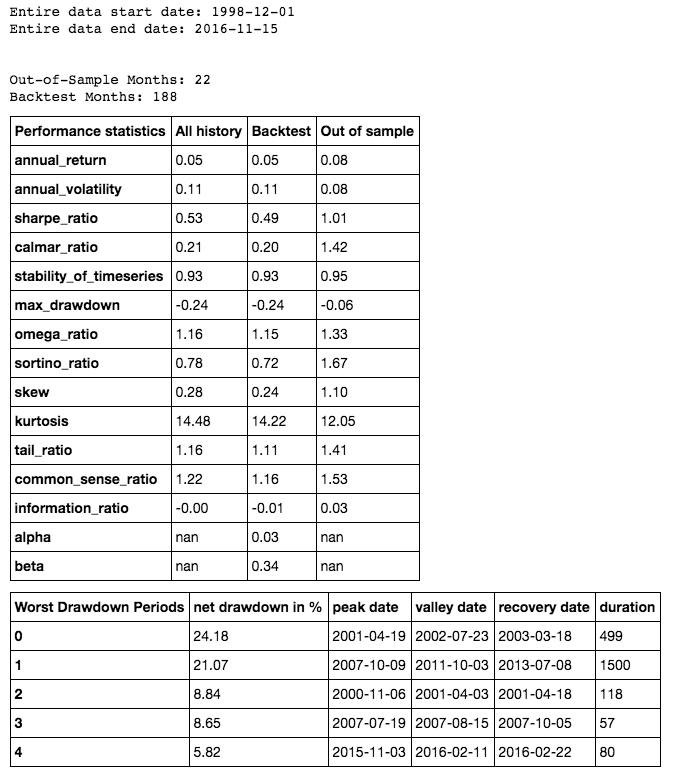
- Trading dates are Dec 1 1998 to Nov 14 2016
- Long only
- No Margin. Account size is $250K.
- Trading SPY ETF
- Calculate the amount of shares to purchase based on available capital and then weight those shares based on the Smart Money model value
- Commission of $10 per trade
- $0.01 per share slippage
- Trading Rules:
- Smart Money closes above or equal to 0.70. Use 100% of capital to invest.
- If Smart Money closes below 0.70 and above or equal to 0.5, change weighting to 75% of capital
- If Smart Money closes below 0.50 and above 0.3, change weighting to 50% of capital.
- If Smart Money closes below or equal to 0.30, change weighting to 25% of capital.
- This strategy enters the market for the first time when the first reading of Smart Money closes above 0.7.
- On the last day of trading during the backtest, sell all shares.
- All orders are entered at the open of the next day’s trading session after a signal is given.
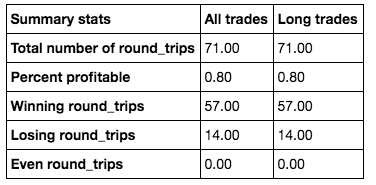
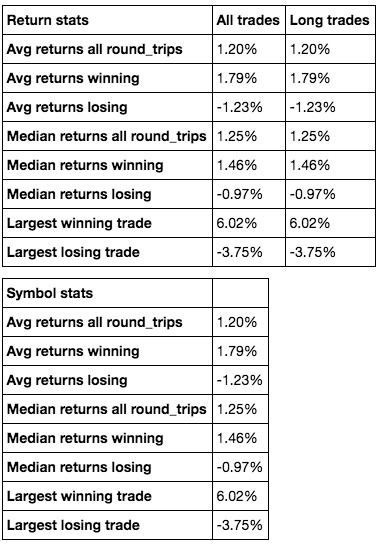
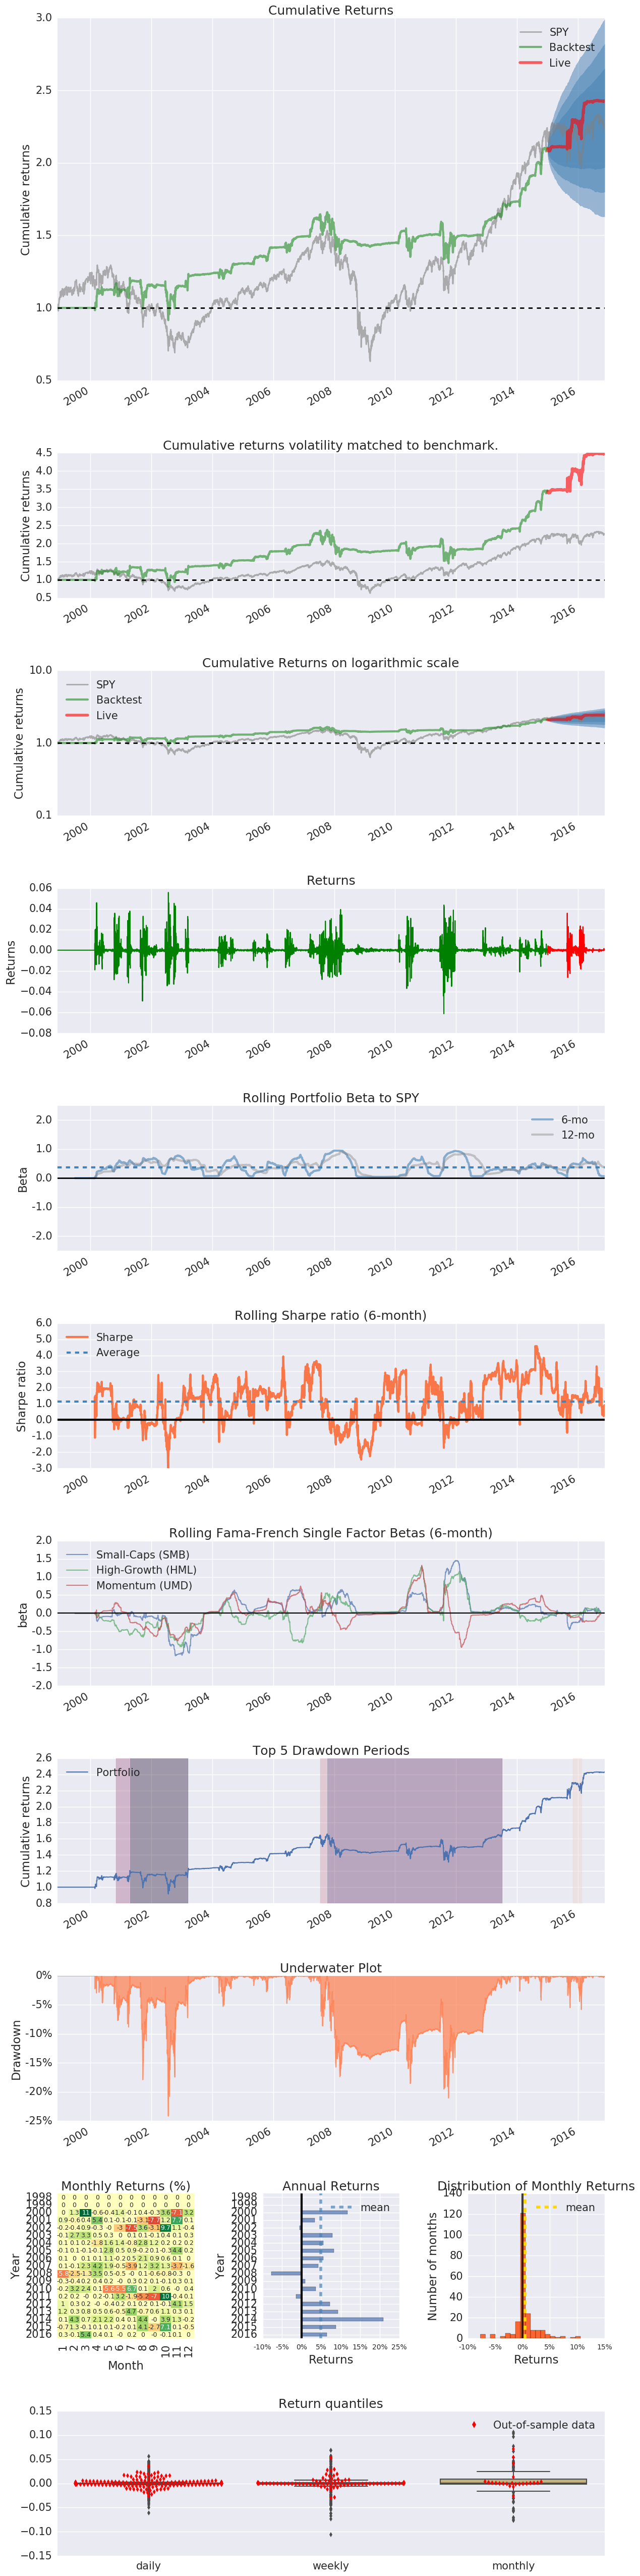
Trading statistics are provided below using 188 months of in-sample data and 22 months of out-of-sample data. For this backtest and strategy, we see an annual return of 5.06% per year with a maximum drawdown of 24.18%. Additionally, following the smart money in this way keeps us away from some of the large volatile periods since 1998. Out of sample results seem to show better returns than in-sample backtest results.
Note: In the Performance Statistics table below, the first two row values are shown as decimals rather than percentages (0.05 = 5%).