
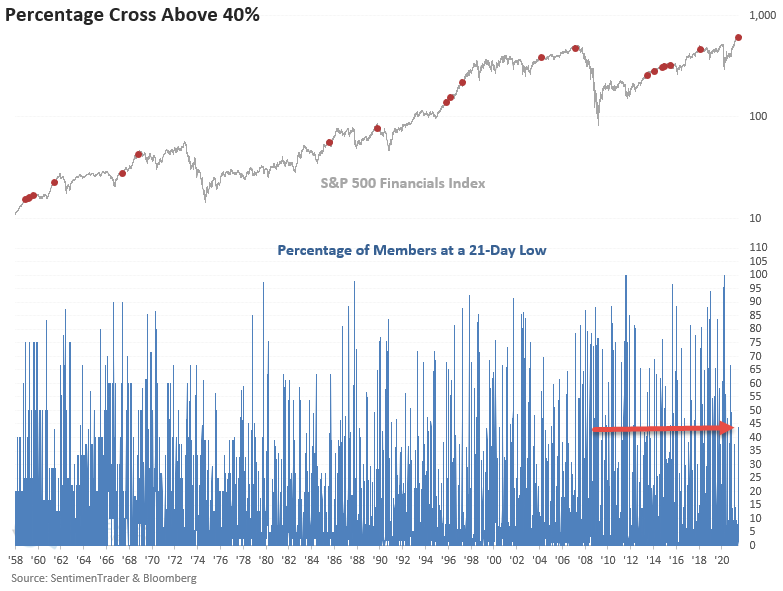
Financials - Spike in 21-Day Lows

The percentage of S&P 500 financial sector members registering a new 21-Day Low spiked to 43.75% on Monday. If we look at the historical chart below, the spike doesn't stand out compared to history. However, the surge in new lows occurred within six days of a new all-time high for the sector and when the S&P 500 closed at a new all-time high.
Financials are vital to the overall health of the stock market as most components play an essential role in the extension of credit in the economy.
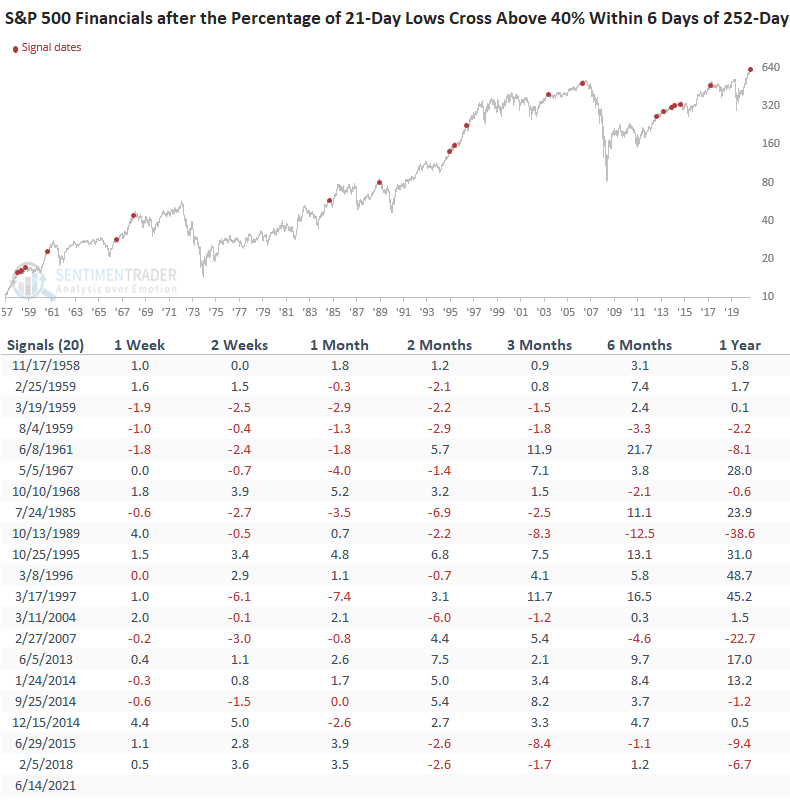
Let's assess forward returns for financials and the broad market when the percentage of financial sector members registering a new low spike above 40% within six days of a 252-day high for financials and when the S&P 500 is at a 252-day high.
HISTORICAL CHART
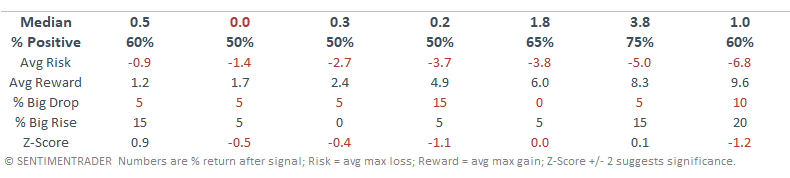
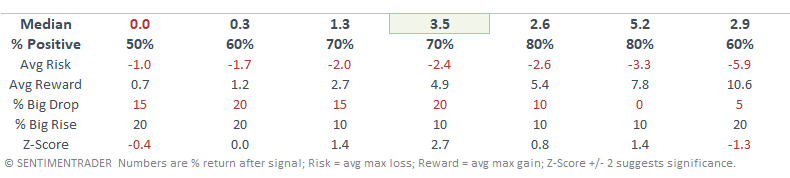
HOW THE SIGNALS PERFORMED
The results look mixed to slightly weak for financials.
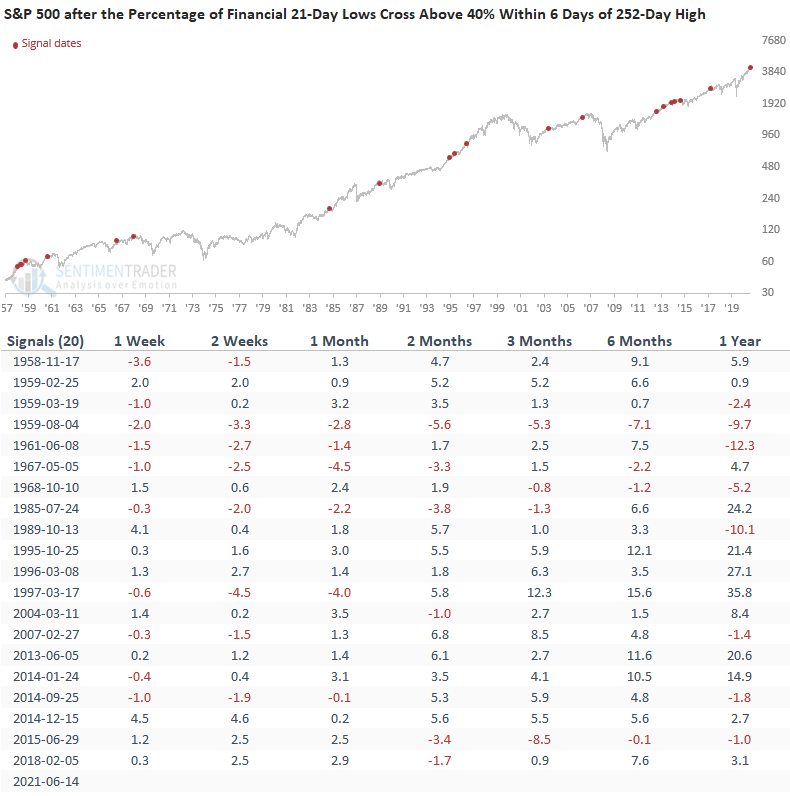
HOW THE SIGNALS PERFORMED - S&P 500
While the 1-week results were weak, the spike in new lows appears to have little to no impact on the broad market as the S&P 500 performed well across several other timeframes.
Let's now assess the results when financial sector lows spike and the S&P 500 simultaneously closes at a 252-day high.
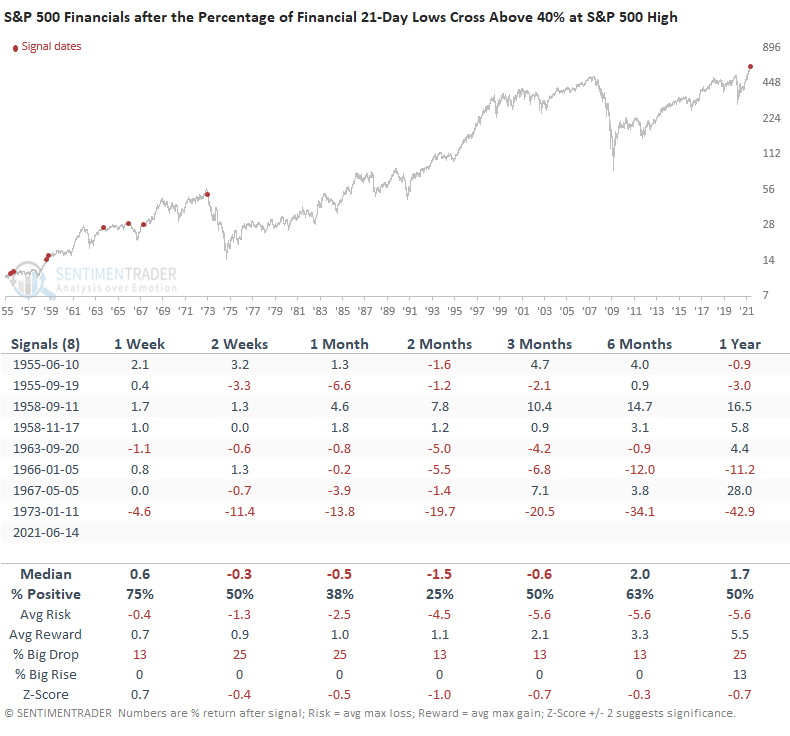
HOW THE SIGNALS PERFORMED - FINANCIALS
While the sample size is small, performance looks weak across most timeframes. The signal on 6/14/21 is the first instance since 1973.
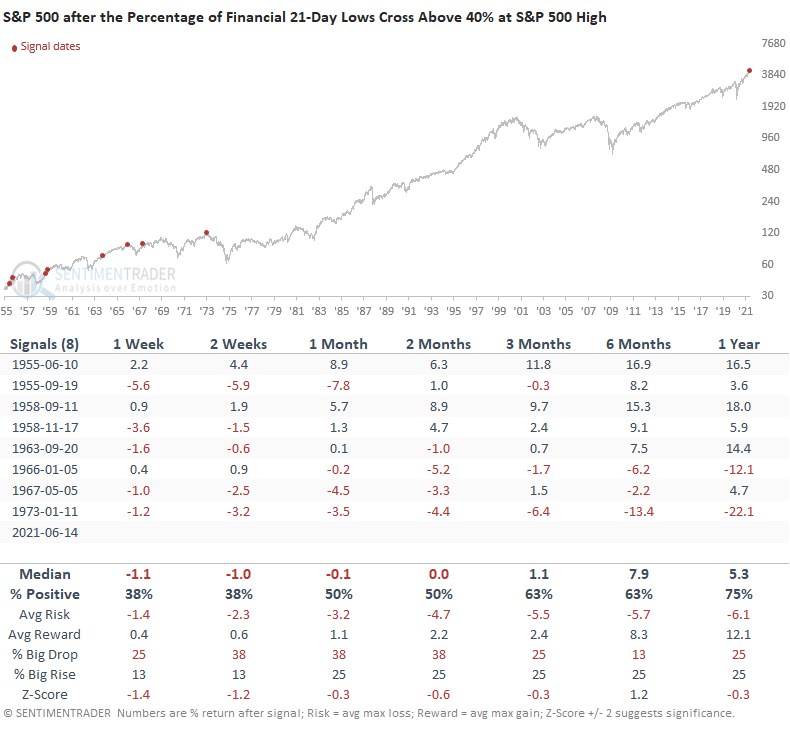
HOW THE SIGNALS PERFORMED - S&P 500
The S&P 500 results look weak across most timeframes.
Today's study highlights a new market development that would suggest somewhat of a conflicting message from the note that I posted last week titled "Stocks Up Bonds Down". Whenever the market throws a curveball, we need to sharpen our pencils and go to work.