Data &
Technology
Research
Reports
Report Solutions
Reports Library
Actionable
Strategies
Free
Resources
Simple Backtest Calculator
Simple Seasonality Calculator
The Kelly Criterion Calculator
Sentiment Geo Map
Public Research Reports
Free Webinar
Pricing
Company
About
Meet Our Team
In the News
Testimonials
Client Success Stories
Contact
Log inLoginSign up
< BACK TO ALL REPORTS

Financial conditions have made a strong recovery

Jason Goepfert
2020-04-17
The Bloomberg Financial Conditions index showed that things were as good as they can get in February, then plunged in March. In recent weeks, it shows that conditions have eased considerably, raising the possibility that the worst is over.

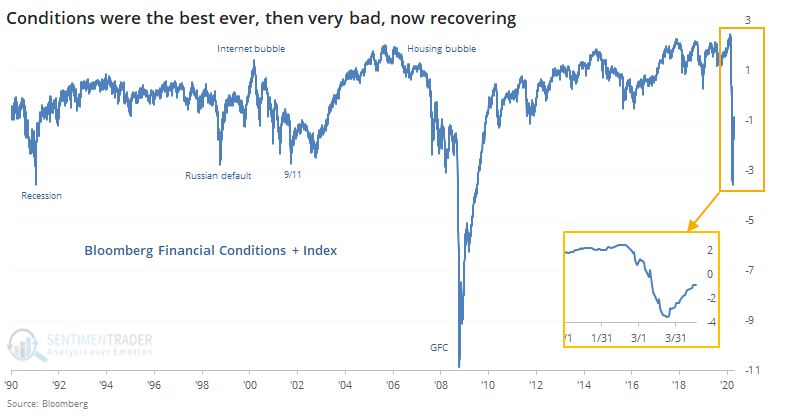
In mid-February, financial conditions were as good as it gets. The best in 30 years, at least.

March changed that in a hurry. Conditions when from the best-ever to one of the worst-ever in a matter of weeks. The Bloomberg Financial Conditions + index (BFC+) went from +2 to -2 in only three weeks, a record drop.

Per Bloomberg:

The Bloomberg Financial Conditions index tracks the overall level of financial stress in the U.S. money, bond, and equity markets to help assess the availability and cost of credit. A positive value indicates accommodative financial conditions, while a negative value indicates tighter financial conditions relative to pre-crisis norms. Bloomberg also calculates a Financial Conditions + index which includes all the elements of the BFCI index as well as indicators of asset-price bubbles, which also have an effect on financial conditions. These include tech-share prices, the housing market, and deviations from equilibrium yield levels.” 

The rally off the March low has eased those conditions, however, and the index has reversed much of the decline.

Below, we can see what happened the other times when the BFC+ recovered two points from a six-month low.

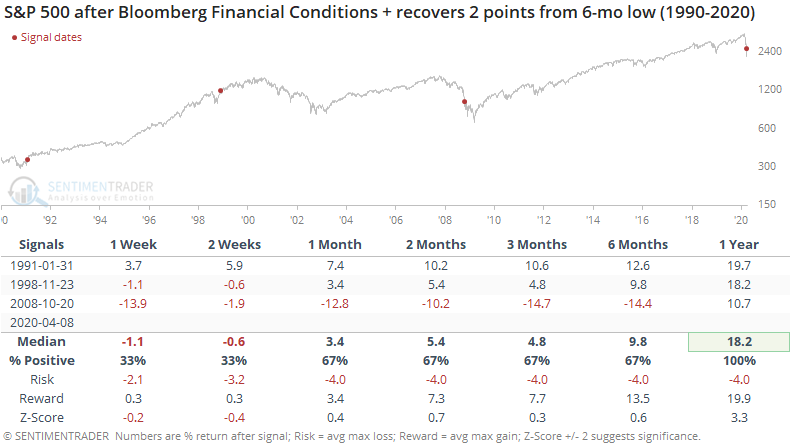
The first two were excellent signals that the recovery was in force and sustainable, with excellent gains and very little risk in the months ahead. Like so many other indicators have shown, the first post-panic moves in October-November 2008 were a head-fake and it preceded some painful months for those who bought into the initial recovery.

About the best determinant of which path the market was taking is price itself.

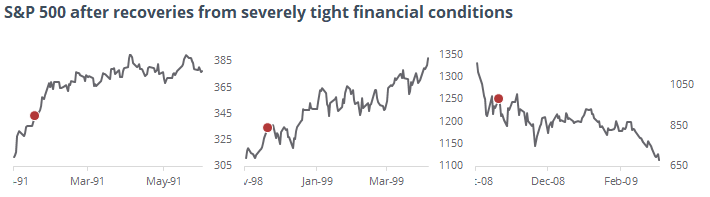
The first didn't see too much of a pullback, while the latter soon led to a lower low. Like with saw after other price and breadth surges, if March was truly an important turning point in the recovery, then we shouldn't see too much of this initial rally given back in the weeks ahead.

Sorry, you don't have access to this report

Upgrade your subscription plan to get access
Go to Dasboard
DATA &
TECHnologies
IndicatorEdge
‍
BackTestEdge
‍
Other Tools
‍
DataEdge API
RESEARCH
reports
Research Solution
‍
Reports Library
‍
actionable
Strategies
Trading Strategies
‍
Smart Stock Scanner
‍
FREE
RESOUrCES
Simple Backtest
Calculator
Simple Seasonality
Calculator
The Kelly Criterion
Calculator
Sentiment Geo Map
‍
Public Research Reports
‍
Free Webinar
COMPANY
‍
About
‍
Meet our Team
‍
In the News
‍
Testimonials
‍
Client Success Stories
Pricing
Bundle pricing
‍
Announcements
‍
FAQ
© 2024 Sundial Capital Research Inc. All rights reserved.
Setsail Marketing
TermsPrivacyAffiliate Program
Risk Disclosure: Futures and forex trading contains substantial risk and is not for every investor. An investor could potentially lose all or more than the initial investment. Risk capital is money that can be lost without jeopardizing ones’ financial security or life style. Only risk capital should be used for trading and only those with sufficient risk capital should consider trading. Past performance is not necessarily indicative of future results.

Hypothetical Performance Disclosure: Hypothetical performance results have many inherent limitations, some of which are described below. No representation is being made that any account will or is likely to achieve profits or losses similar to those shown; in fact, there are frequently sharp differences between hypothetical performance results and the actual results subsequently achieved by any particular trading program. One of the limitations of hypothetical performance results is that they are generally prepared with the benefit of hindsight. In addition, hypothetical trading does not involve financial risk, and no hypothetical trading record can completely account for the impact of financial risk of actual trading. for example, the ability to withstand losses or to adhere to a particular trading program in spite of trading losses are material points which can also adversely affect actual trading results. There are numerous other factors related to the markets in general or to the implementation of any specific trading program which cannot be fully accounted for in the preparation of hypothetical performance results and all which can adversely affect trading results.

Testimonial Disclosure: Testimonials appearing on this website may not be representative of other clients or customers and is not a guarantee of future performance or success.