
Financial and copper versus the Copper/Gold Ratio

Key points
- The Copper/Gold Ratio has been nearer to the low end of its historical range
- Historically, this has signaled potential opportunities in the financial sector and copper itself
- XLF is attempting to break out to a new all-time high, and copper is trying to establish and maintain a price uptrend
The Financials sector is attempting to break out
The Financial Select Sector SPDR Fund ETF (ticker XLF) tracks the S&P 500 Financials sector index. The chart below reveals that XLF has recently tried to break out to a new all-time high. But the jury is still out on whether this attempt will follow through to the upside or break back down.
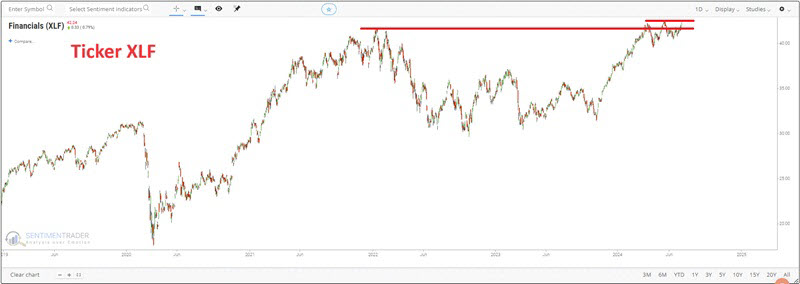
In March 2024, XLF broke about its previous January 2022 peak and then reversed back below it. In May, XLF repeated this process - registering a slightly higher new high. Since a low in June, it has embarked on another "summit assault." Will it ultimately break through and run higher? We cannot predict. But this situation is worth watching closely. A clean breakout to a new all-time high for any security often "clears the way" for much higher new highs. Conversely, an unsuccessful breakout is usually followed by a painful period of decline and/or extended price consolidation.
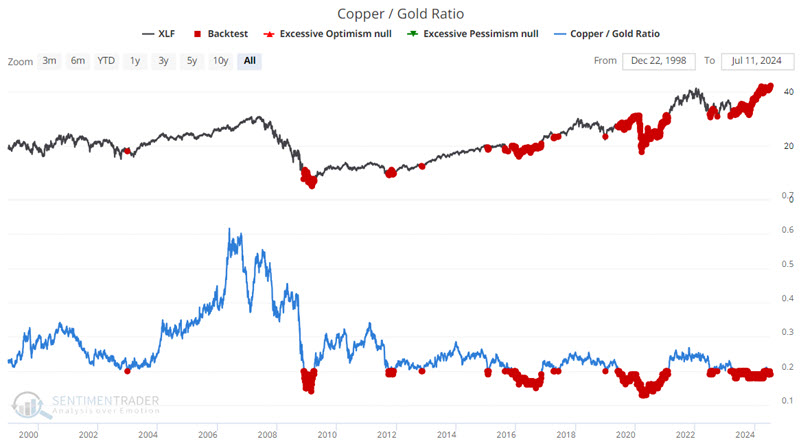
One indicator that creates some optimism for the bullish case is the Copper/Gold Ratio. The chart below highlights XLF and all days when the Copper/Gold Ratio was below 0.20. The ratio has been below 0.20 continuously since 2024-04-23.
The table below summarizes the performance for ticker XLF following all dates highlighted in the chart above.
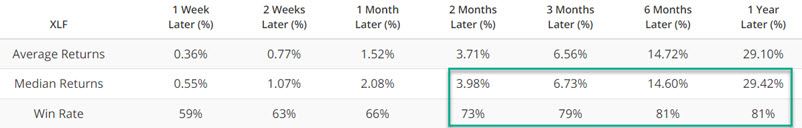
Six and twelve-month Win Rates are solid at 81%, and Median Returns are exceptional at 14.60% and 29.42%, respectively.
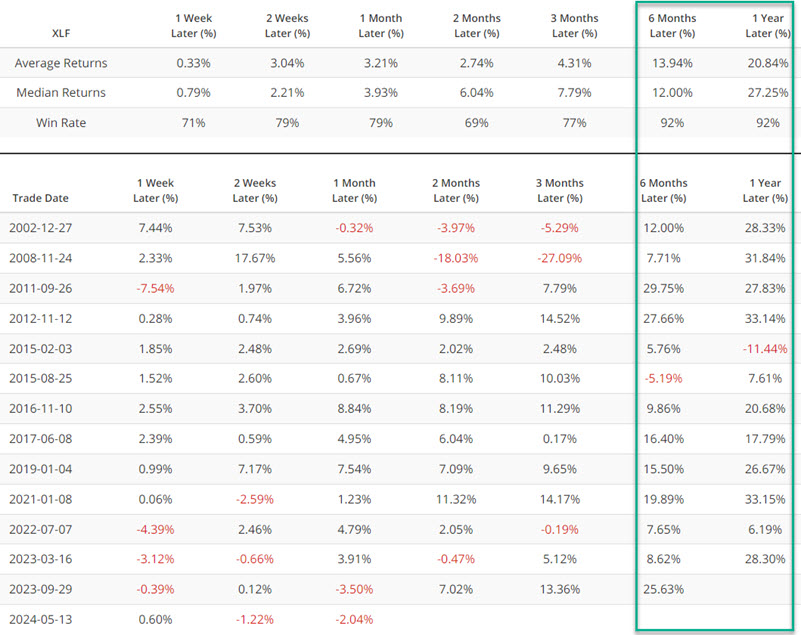
Now, let's take a different approach. Instead of considering all days when the Copper/Gold Ratio was below 0.20, we will consider only those days when the ratio crossed back above 0.20 for the first time in six months. Those dates are highlighted in the chart below. The most recent signal occurred on 2024-05-13.
The table summarizes XLF's performance following these dates and displays signal-by-signal performance for XLF. We note that the six-and twelve-month Win Rates climb to 92%.
The ratio also remains favorable for copper itself
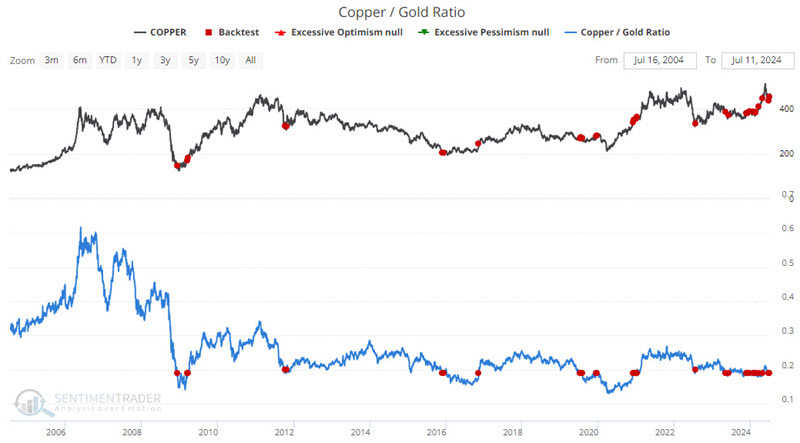
The other market that the Copper/Gold Ratio gives the benefit of the doubt to is copper itself. In the chart below, we see that - like XLF - copper futures recently enjoyed a robust rally and a breakout to a new high but then fell back and are trying to re-establish an uptrend.
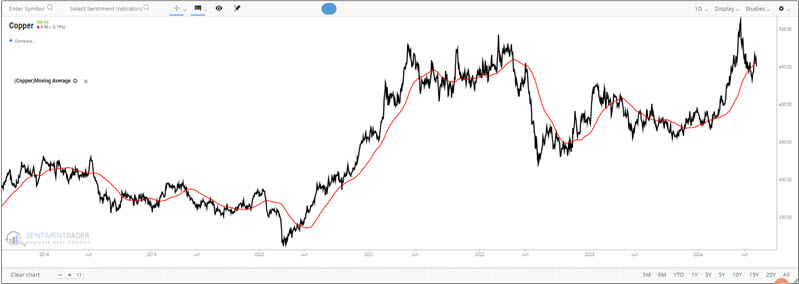
Once again, we cannot predict which way copper will run from here. But we can note the current state of the Copper/Gold Ratio and how copper futures have reacted in the past.
The chart below highlights all days when the Copper/Gold Ratio crossed above 0.19. The most recent signal occurred on 2024-07-03.

The table below summarizes the performance for copper futures following all dates highlighted in the chart above.
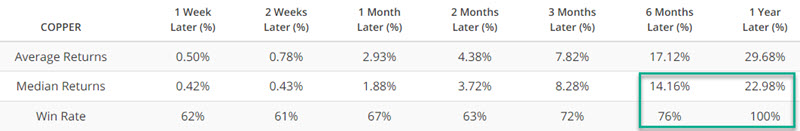
The twelve-month Win Rate of 100% does not guarantee that copper futures will be higher by July 2025 than they are today. But it does lend the weight of the evidence to the favorable side of the ledger and argues for continuing to give the bullish case the benefit of the doubt as long as price action does not fall apart.
What the research tells us…
It is important to remember that individual indicators rarely make sound "automatic trading systems." The red dots in the indicator charts above should not be thought of as "buy signals" per se but as important (and at least up until now) and valuable "weight of the evidence." As long as price action does not fall apart, the Copper/Gold Ratio suggests that traders give the bullish case for the financial sector and copper the benefit of the doubt.