Fewest stocks are outperforming the S&P 500 since 1999
Key points:
- Over the past month, fewer than 32% of S&P 500 stocks have outperformed the index
- That's one of the lowest amounts since 1928, with the most recent precedent being in 1999
- Since 1928, very low levels of outperforming stocks were not consistent warnings of a market decline
As markets get calmer, few stocks outperform the index
As a reflection of a calmer market, historical volatility in the most benchmarked index in the world has plunged over the past month. Part of the reason the index hasn't moved as much daily is because stocks are moving on their own accord. Some are falling, while others are rising, canceling each other in index points.
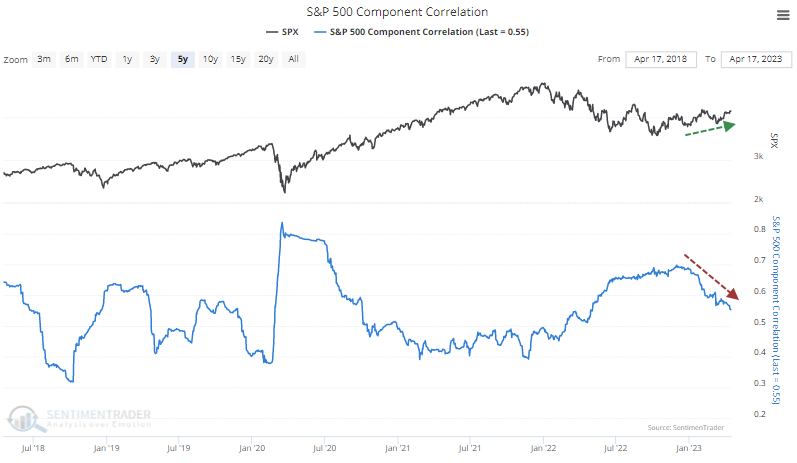
After rising last summer and fall, the correlation among stocks in the S&P 500 has steadily fallen lately and is at the lowest level in almost a year.

Even though stocks are moving on their own, few have been able to outpace gains in the index. As Bloomberg notes:
The rally in the S&P 500 has been driven by only a handful of stocks, putting the index at risk of fresh lows if bond yields rise, according to Morgan Stanley's Michael Wilson - one of the most bearish voices on Wall Street.
The percentage of stocks outperforming the S&P 500 on a three-month rolling basis is the lowest on record, Wilson said. That "is the market's way of warning us we are far from out of the woods with this bear market..."
That's an odd way to express market breadth, but whatever. Bears gotta be bears.
Over the past 20 days, the percentage of S&P 500 stocks outperforming the index on an average session has fallen to less than 32%. That's the lowest since 1999-00.
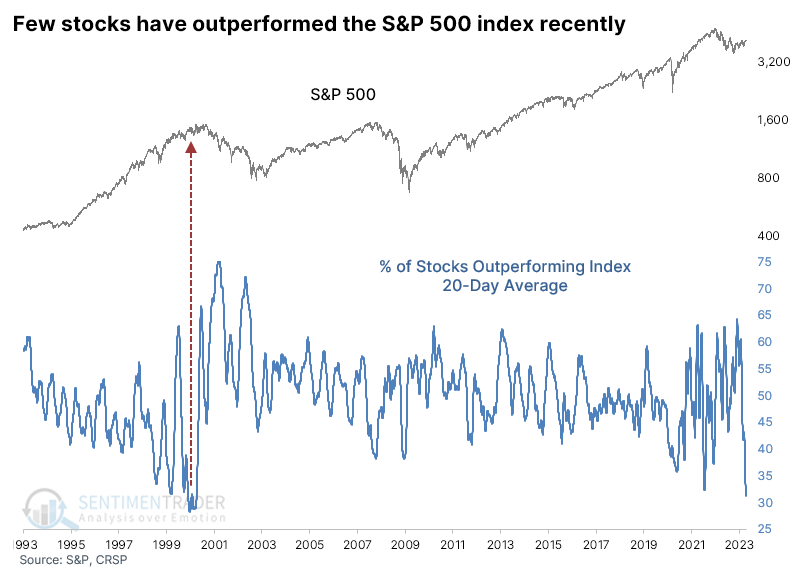
Any mention of the year 2000 as a precedent automatically raises the hairs on the backs of the necks of any investors active at that time. Zooming out over a long history, the current collapse in outperforming stocks rivals some of the most egregious extremes since 1928.
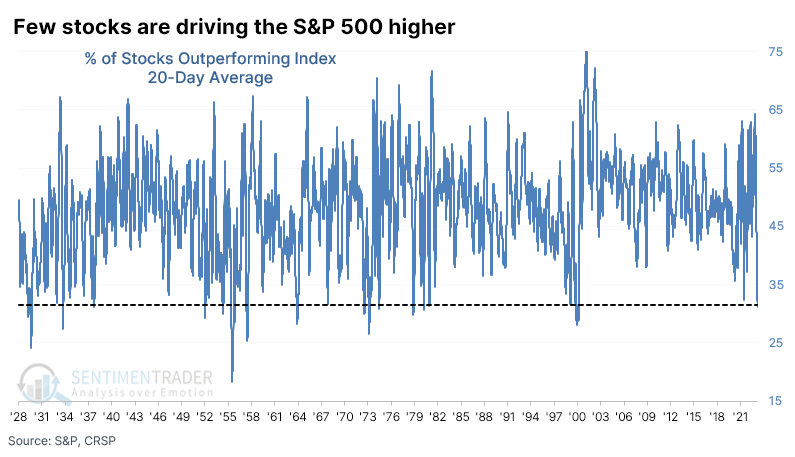
Few stocks outperforming the index wasn't a consistent warning for the average stock
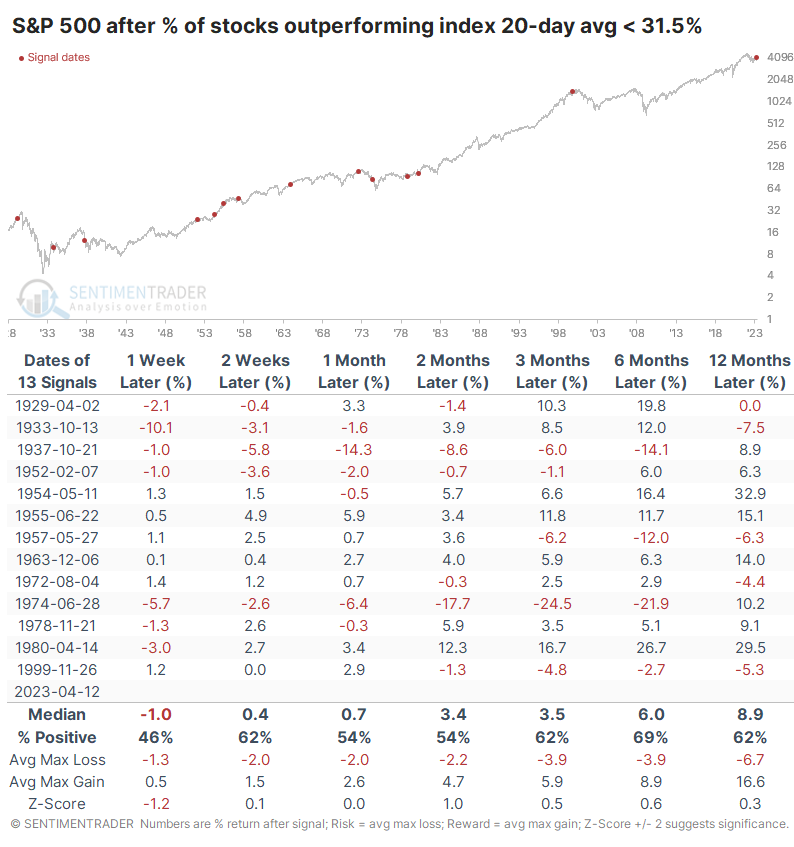
The table below shows every time the 20-day average of outperforming stocks dropped to this low a level for the first time in at least a year. And there were some pretty terrible precedents, most notably in 1999. Even though the S&P's returns up to a year later weren't all that bad after that signal, they got a whole lot worse in the months after that.
Even so, there were no double-digit losses over the next year. Stocks were definitely volatile after some of the signals, and several suffered large drawdowns at various points in the next year, but the S&P still showed a median gain of nearly 9%, higher than random.
The S&P 500 is a capitalization-weighted index, so a handful of large stocks can have an outsized impact on its returns. We have a reconstructed equal-weight version of the S&P 500 dating back to October 1957.
The table below shows the returns in that equal-weight index after signals since that date. Returns generally outpaced the cap-weighted version of the index, sometimes significantly so.

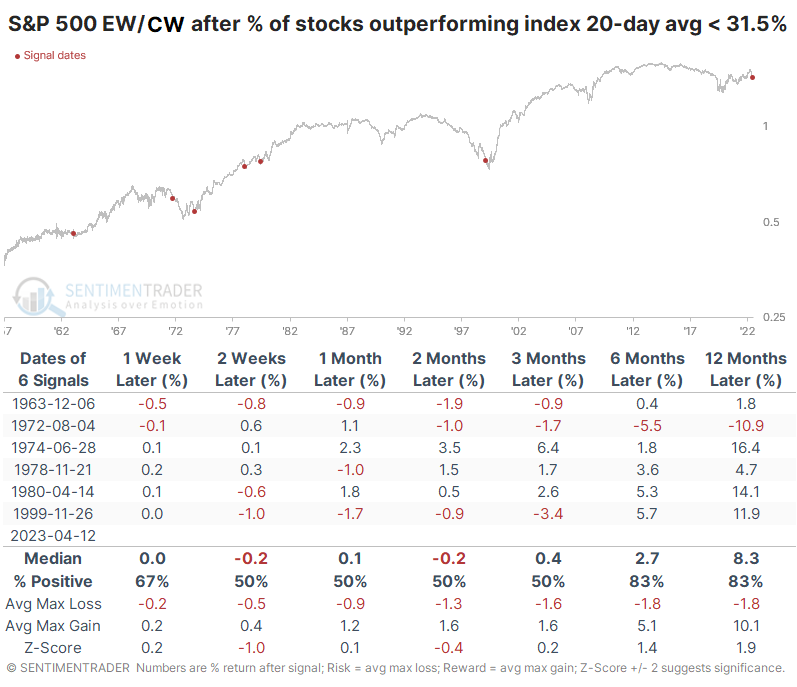
We can see that dynamic more clearly by looking at returns in the ratio between the two versions of the index. The table below shows returns in the ratio of the equal-weighted versus capitalization-weighted S&P 500 indexes after few stocks outperformed the index.
Over the next 6-12 months, the equal-weighted version did better than the cap-weighted version after five of the six signals. Several times, the signals occurred around significant turning points in the ratio.
What the research tells us...
There's always an excuse to be cautious on markets, especially after a historically bruising year like 2022. Some of them are even empirically valid when looking at past behavior. When we look at metrics like market breadth, the percentage of stocks outperforming an index is a rather odd way of doing it, but it can give interesting signals, as Dean often points out. However, the recent lack of outperformance among most stocks in the index does not seem to be a consistent warning sign. While it proved prescient (eventually) in 1999, most other signals were nothing burgers.

