
Fewest gold miners in uptrends since April

The relief rally this week, while historically broad, certainly didn't bring along all comers. Gold stocks have been looked at as a potential safe haven this year, even though their record on that score is mixed at best. Even so, investors saw no need for them this week.
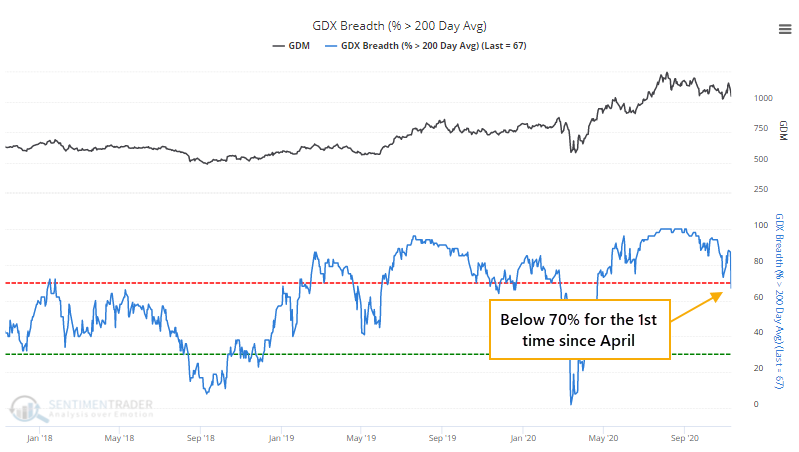
As a result of the selling pressure, fewer than 70% of gold miners have managed to hold above their 200-day moving averages, the fewest since April. It's on track to drop even further on Wednesday.
This ends a long streak with more than 70% of miners being in long-term uptrends. Going back to 1986, there have only been a few times when more than 70% of mining stocks held above their 200-day averages for more than 6 months. The most recent one was the 4th-longest ever.
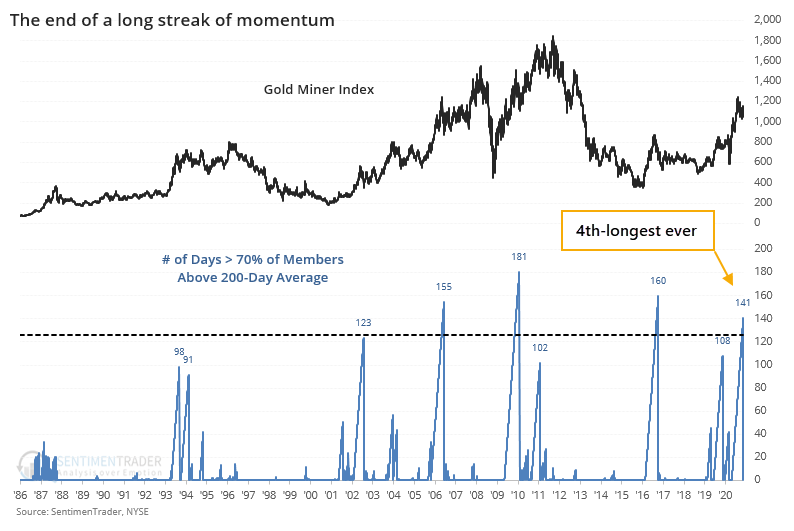
NOTE: The NYSE Arca Gold Miners Index only goes back to 1993, so we appended a proxy index prior to that which equally-weights the top 10 members of the index with the longest price histories.
In most markets, when we see an end to a protracted streak of momentum, there is often some shorter-term weakness, but longer-term strength. Momentum does not die easily, but commodity-related markets are different beasts.
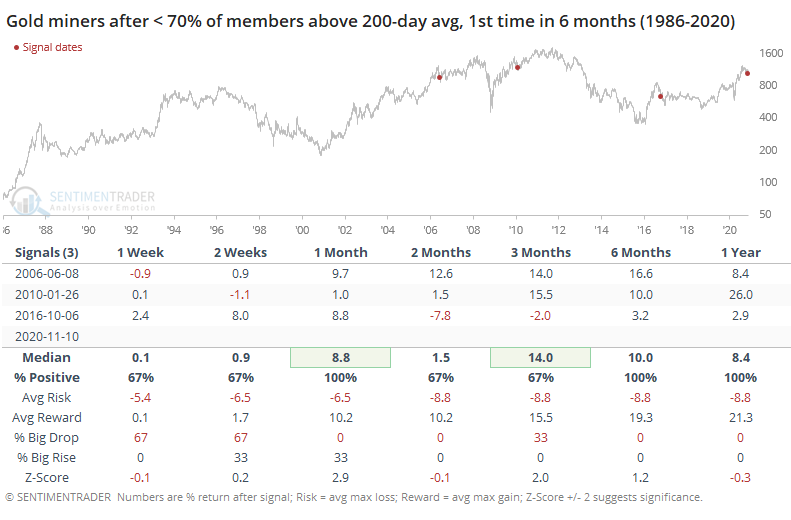
In this case, gold miners weren't so different. Each of the signals suffered some weakness at some point in the first couple of months, but long-term returns were very good.
To generate a larger sample size, let's relax the parameters and look at forward returns after a streak of 3 months or more.
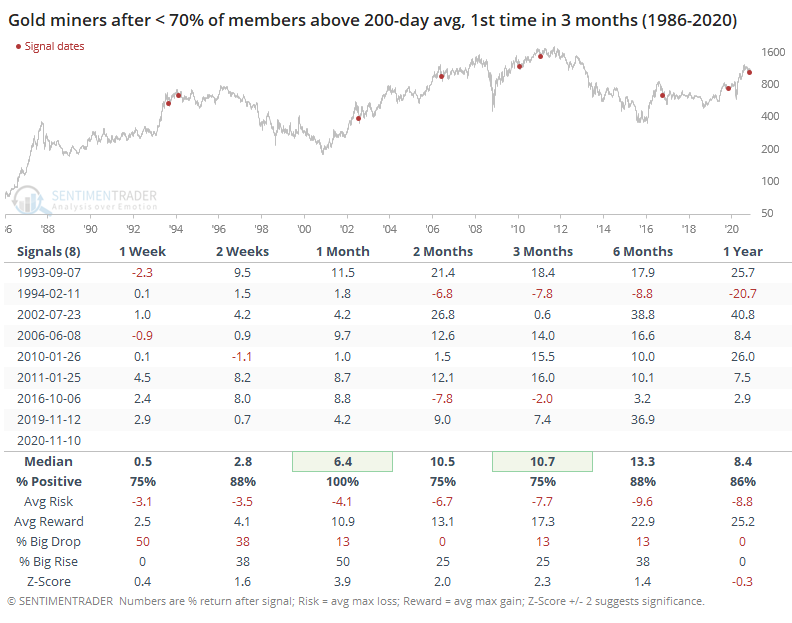
Again, the returns were very good. Gold miners resumed their rally over the next month all 8 times this signal triggered, and mostly held onto those gains in the months ahead. There was only a single true failure, in 1994, though the one in 2011 did eventually roll over into a wicked bear market.
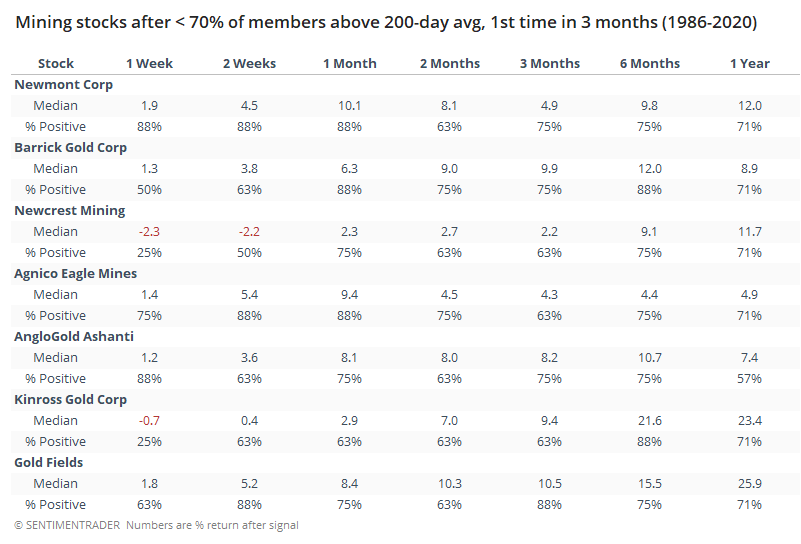
Among the miners themselves, returns were fairly consistent, but a couple struggled more in the shorter-term.
Gold miners are closely tied to the price of gold itself, so let's look at what gold prices did after miners ended these streaks of momentum. This is like watching the tail instead of the dog, so it may be more of a curiosity than anything.
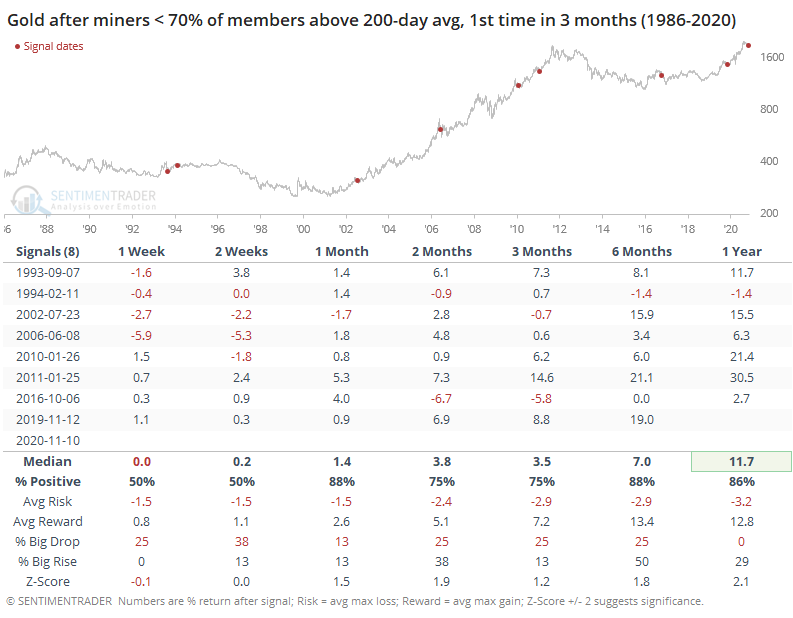
For what it's worth, gold tended to hold up well after miners had enjoyed a multi-month streak of momentum.
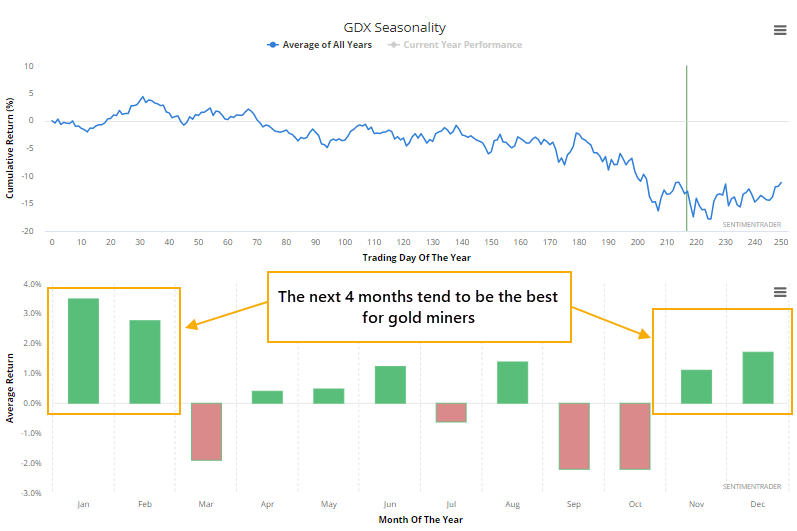
It's probably better than this waning momentum has triggered now versus earlier in the spring. Gold mining stocks are in the midst of what has traditionally been their most favorable months.
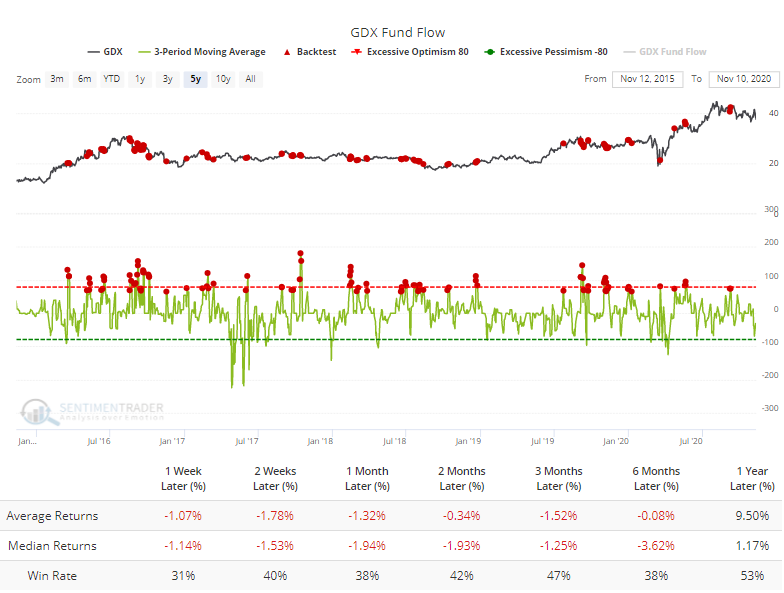
Fund investors haven't been waiting around to find out. Over the past 3 days, traders have pulled an average of more than $65 million per day from GDX, an amount that led to mostly positive returns over the past 5 years per the Backtest Engine.
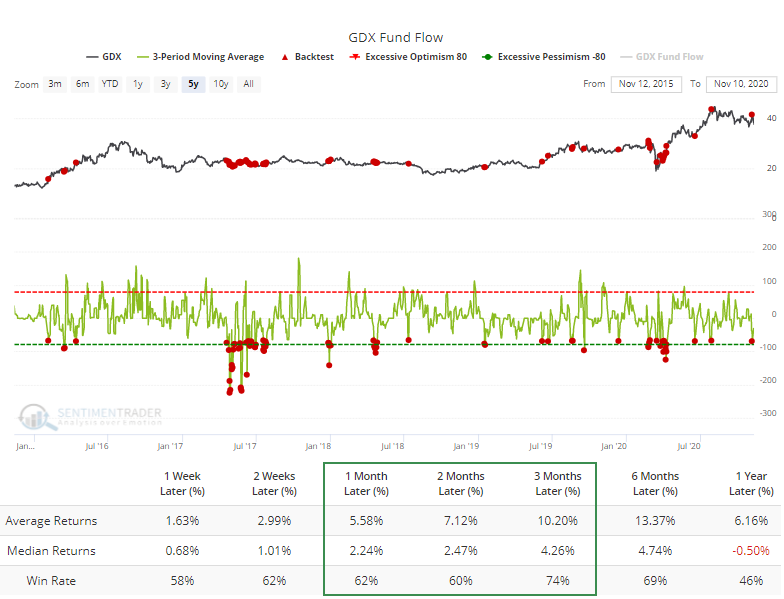
Contrast that to days when the 3-day average showed more than a $65 million inflow - much worse forward returns.
Folks have also been showing their displeasure with the group on Twitter. The 10-day average Social Sentiment is still above 1.5. This is computed like a put/call ratio, so the higher the indicator, the more negative tweets there are relative to positive ones.
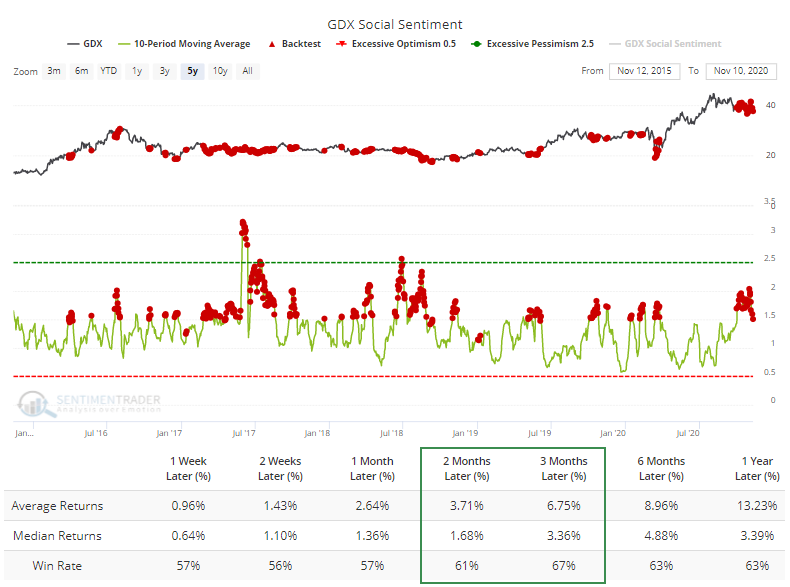
When 10-day Social Sentiment was below 1.0, the 3-month median return in GDX was a lowly -2.3%, so it has been better to be positive on these stocks when Twitter folks were not.
Gold miners are a volatile sector, with a boom-bust tendency. They've been enjoying the "boom" part for months, similar to the mid-90s and mid-00s. It's always scary when a volatile group sees a major pullback because there is always that fear that we're on the cusp of the next "bust." With this group, though, it should be a good sign that the most recent dip comes on the heels of a historic bout of momentum, which has tended to continue instead of reverse.