Data &
Technology
Research
Reports
Report Solutions
Reports Library
Actionable
Strategies
Free
Resources
Simple Backtest Calculator
Simple Seasonality Calculator
The Kelly Criterion Calculator
Sentiment Geo Map
Public Research Reports
Free Webinar
Pricing
Company
About
Meet Our Team
In the News
Testimonials
Client Success Stories
Contact
Log inLoginSign up
< BACK TO ALL REPORTS

Farrell Sentiment indicator suggests a good year

Jason Goepfert
2020-05-29
An indicator that looks at sentiment in the AAII survey over a long time frame shows continued pessimism. The Farrell Sentiment indicator looks at a 10-week average of individual investor attitudes, and it's currently at a very low level, despite the rally in stocks. It doesn't have a perfect record and is acting strangely.

One of the more curious aspects of sentiment over the past couple of months has been the persistent pessimism, or at least lack of optimism, among individual investors in the AAII survey.

The survey has a lot of weaknesses, but remains very widely followed and isn't without its uses. Most of our models are showing that sentiment, in general, is somewhere between neutral to optimistic, but this is one that is keeping a lid on them showing too much optimism.

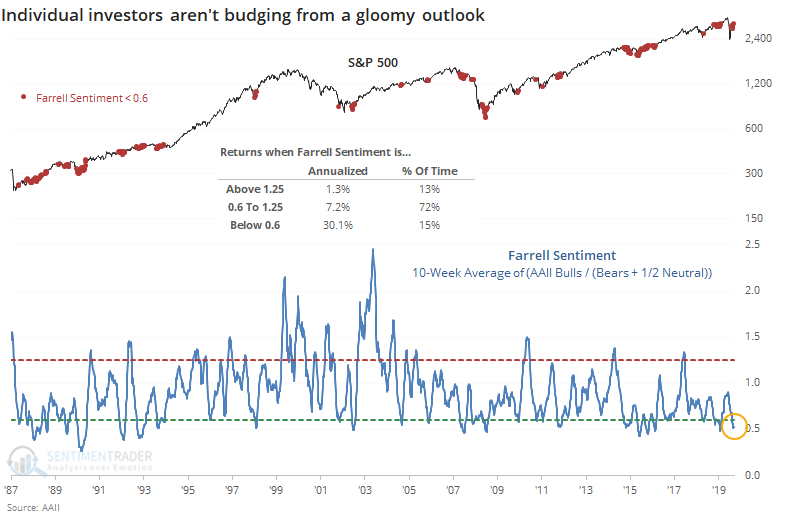
Over the past 10 weeks, the S&P 500 has rallied more than 25% (weekly Wednesday closes) yet the AAII survey shows less and less optimism. That's the conclusion using the Farrell Sentiment indicator, created by Bob Farrell, a respected market analyst from the earlier decades.

It's been nearly a decade since the last time we looked at this measure, which is making the rounds again as it's throwing off a buy signal. To create the indicator, we take a 10-week average of the percentage of AAII Bulls and divide it by AAII Bears plus half the neutral responses. It's currently below 0.6, a very low level historically.

We can see from the chart that the S&P 500's annualized return when the indicator is below 0.6 is an impressive 30.1%, versus only 1.3% when the indicator is above 1.25.

If we use a signal-based approach, when the indicator first turns up from a streak below 0.6, it has led to mostly positive returns.

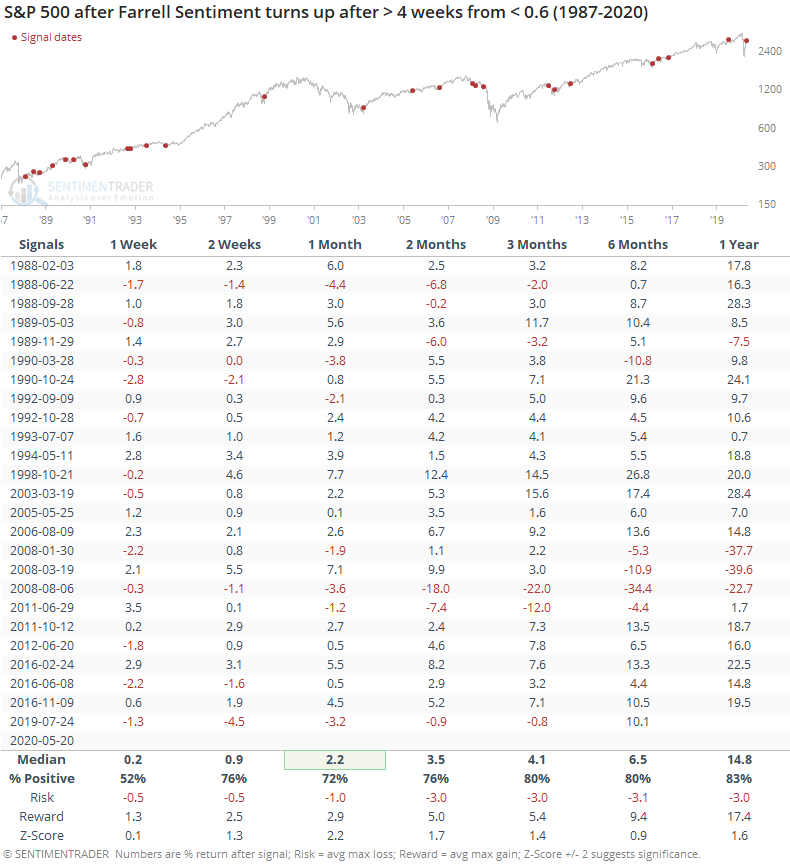
There were some definite failures in there, most notably in 2008 when it suggested several false starts. Other than that, large losses were rare.

It's also rare to see this kind of behavior during a substantial rally. There haven't been too many times when the indicator declined during a 10% or greater rally.

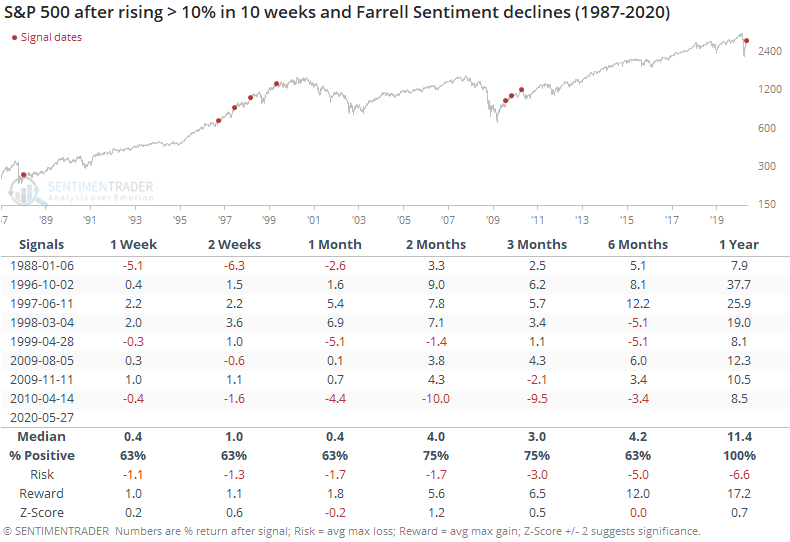
This happened in early 2010, and stocks peaked shortly after. Other than that, losses were rare, and nonexistent over the next year.

Placing a lot of weight on this particular data is shaky. It's not acting as it has historically, which raises the worry that something underlying the survey has changed. It's way too early to discount it entirely, however, and future returns after relatively similar behavior were consistently positive. We'd rate it as a minor long-term positive and not much more than that.

Sorry, you don't have access to this report

Upgrade your subscription plan to get access
Go to Dasboard
DATA &
TECHnologies
IndicatorEdge
‍
BackTestEdge
‍
Other Tools
‍
DataEdge API
RESEARCH
reports
Research Solution
‍
Reports Library
‍
actionable
Strategies
Trading Strategies
‍
Smart Stock Scanner
‍
FREE
RESOUrCES
Simple Backtest
Calculator
Simple Seasonality
Calculator
The Kelly Criterion
Calculator
Sentiment Geo Map
‍
Public Research Reports
‍
Free Webinar
COMPANY
‍
About
‍
Meet our Team
‍
In the News
‍
Testimonials
‍
Client Success Stories
Pricing
Bundle pricing
‍
Announcements
‍
FAQ
© 2024 Sundial Capital Research Inc. All rights reserved.
Setsail Marketing
TermsPrivacyAffiliate Program
Risk Disclosure: Futures and forex trading contains substantial risk and is not for every investor. An investor could potentially lose all or more than the initial investment. Risk capital is money that can be lost without jeopardizing ones’ financial security or life style. Only risk capital should be used for trading and only those with sufficient risk capital should consider trading. Past performance is not necessarily indicative of future results.

Hypothetical Performance Disclosure: Hypothetical performance results have many inherent limitations, some of which are described below. No representation is being made that any account will or is likely to achieve profits or losses similar to those shown; in fact, there are frequently sharp differences between hypothetical performance results and the actual results subsequently achieved by any particular trading program. One of the limitations of hypothetical performance results is that they are generally prepared with the benefit of hindsight. In addition, hypothetical trading does not involve financial risk, and no hypothetical trading record can completely account for the impact of financial risk of actual trading. for example, the ability to withstand losses or to adhere to a particular trading program in spite of trading losses are material points which can also adversely affect actual trading results. There are numerous other factors related to the markets in general or to the implementation of any specific trading program which cannot be fully accounted for in the preparation of hypothetical performance results and all which can adversely affect trading results.

Testimonial Disclosure: Testimonials appearing on this website may not be representative of other clients or customers and is not a guarantee of future performance or success.