Falling Fear/Greed
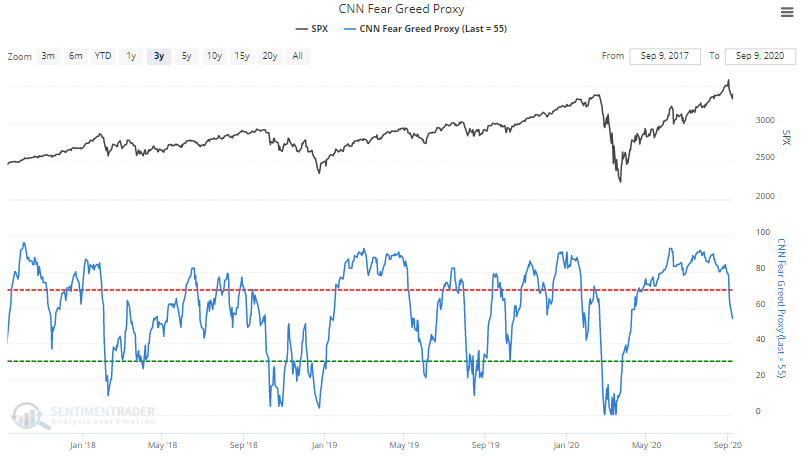
The stock market's recent pullback caused certain sentiment indicators to drop back from extreme levels. For example, the CNN Fear/Greed indicator is almost at 50 after staying elevated for an extremely long time:
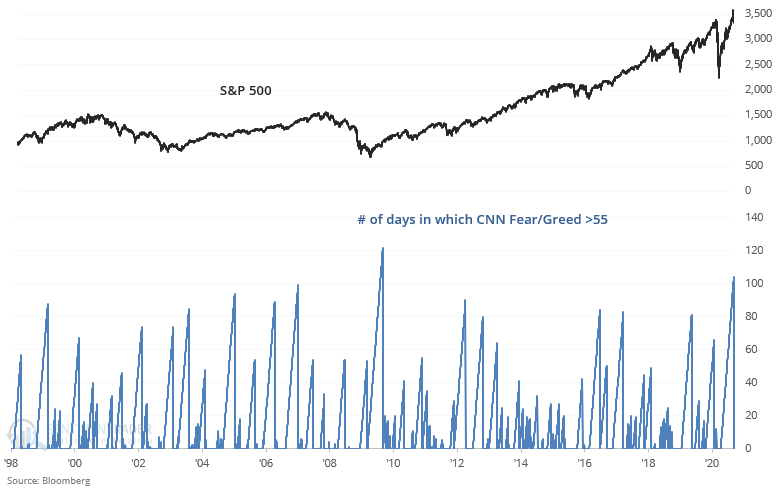
From 1998 to present, there was only 1 other period in which our CNN Fear/Greed proxy was this elevated, for this long: 2009.
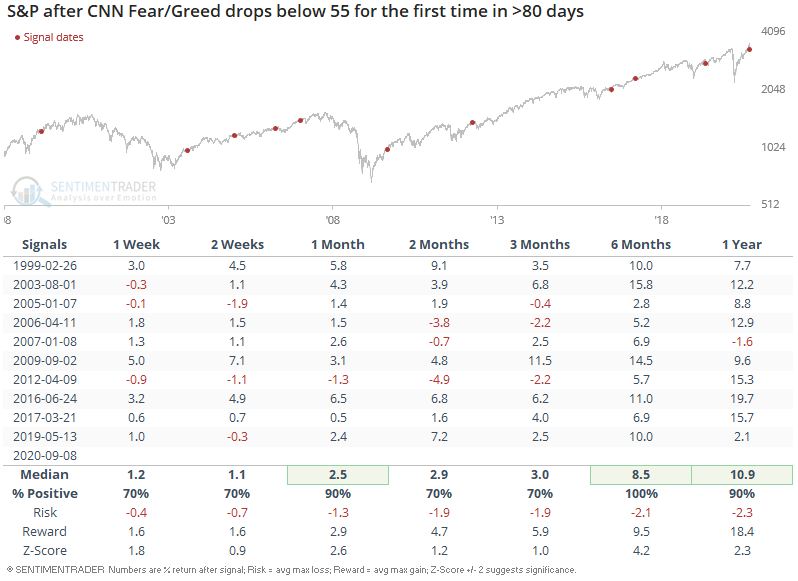
Historically, weakening sentiment after extreme strength could cause the pullback to continue, but longer term this led to more gains over the next 6 months:
Meanwhile, the USD Index has rallied slightly as the stock market pulls back. USD Optix's 50 dma is at 26, the lowest level in almost a decade:
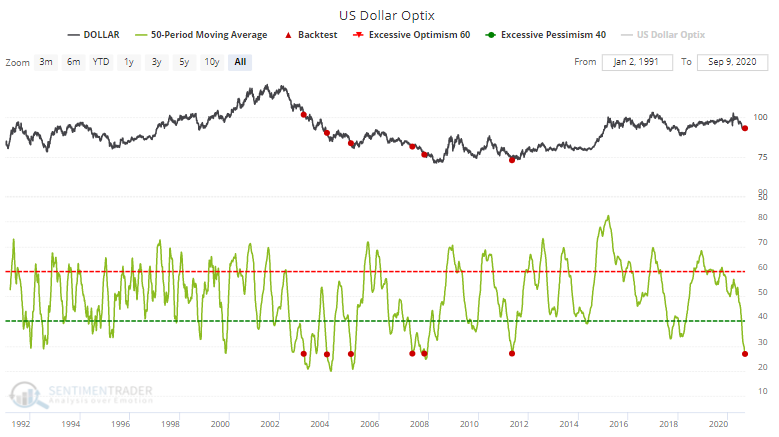
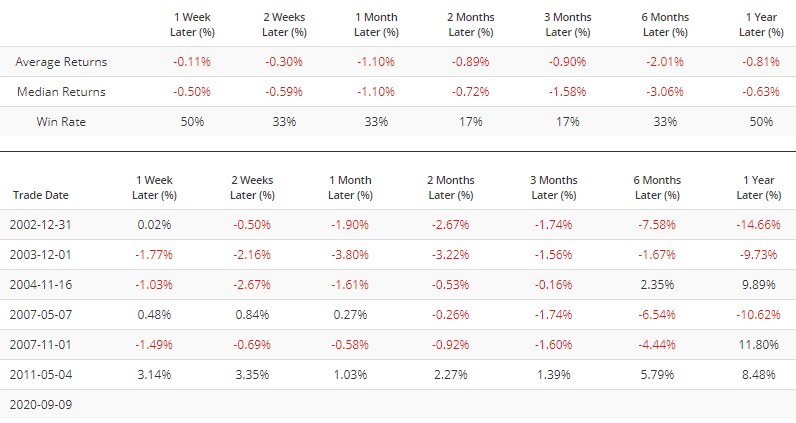
This marked the USD bottom only once, in 2011. Before that, such low sentiment did not portend a USD bounce. But given that the S&P and USD are inversely correlated right now, an S&P pullback will lead to a further USD bounce:
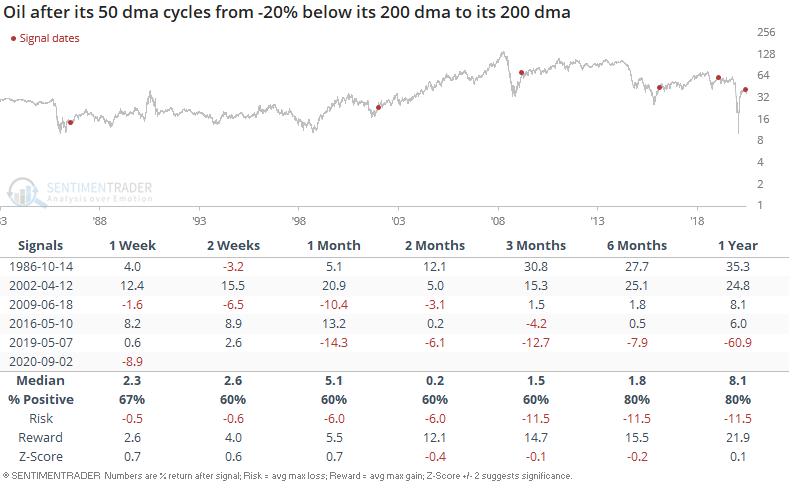
Oil recently formed a golden cross (50 dma > 200 dma) after its worst plunge in history:
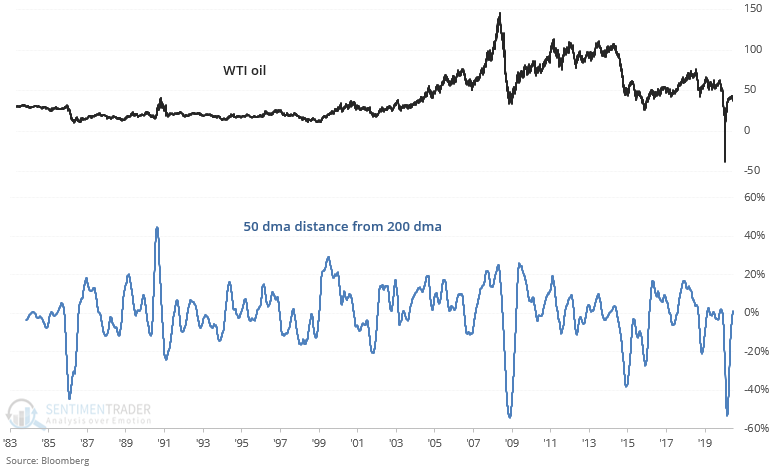
This was not consistently bullish nor bearish for oil going forward: