
Failing At The 200-Day After Mirror Image V-Shaped Rebound

Failed
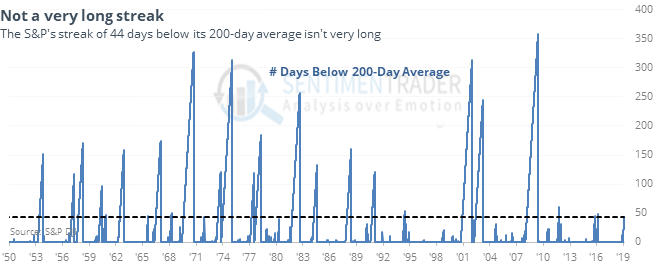
After two months below its 200-day average, the S&P approached it this week but then took a step back on Thursday, closing more than 1% below.
Other times it approached its 200-day after at least a month below, and then showed signs of failure, it tended to close above its average soon, but even so its returns over the next 2-3 months were weak. On average, it only took 7 more days before the S&P finally closed above its 200-day average, but there was extreme variability among the dates.
Nasdaq, too
The Nasdaq didn’t get quite as close to its own 200-day average, but it, too, shows signs of failure. Like the S&P, other failures preceded weak returns over the next couple of months, but not beyond that.
Mirror image
Over the past 30 days, the S&P’s path has been close to a mirror image of the 30 days leading into the Christmas Eve low. The decline was consistent with a loss of more than 10%, while the rebound has also been consistent with more than a 10% gain. Other times this happened, it preceded some weakness over the next month and was inconsistent beyond that.
Bitte halten
The EWG fund tracking German stocks is showing an Optimism Index below 20 while the fund (barely) holds above its 50-day average. According to the Backtest Engine, that has led to a modest tendency to rebound. Perhaps more notable, there was a solid positive correlation between its returns over the next week and next six months.
This post was an abridged version of our Daily Report. For full access, sign up for a 30-day free trial now.