Products
SentimenTrader Trading Tools
‍
Backtest Engine
My Trading Toolkit
Correlation Analysis
Seasonality
Indicators & Data API
‍
Proprietary Indicators & Charts
Market Data API
Strategies & Scanner
‍
50+ Trading Strategies
Smart Stock Scanner
Research Reports
‍
Research Solutions
Reports Library
Free Resources
Simple Backtest Calculator
Simple Seasonality Calculator
The Kelly Criterion Calculator
Sentiment Geo Map
Public Research Reports
Pricing
Company
About
In the News
Testimonials
Client Success Stories
Contact
Log inLoginSign up
< BACK TO ALL REPORTS

Everything is risk-off

Dean Christians
2022-06-21
For only the 6th time in the last 23 years, the SentimenTrader risk on/off indicator declined to zero. After similar signals, the S&P 500 ETF (SPY) shows a 100% win rate.

Key points:

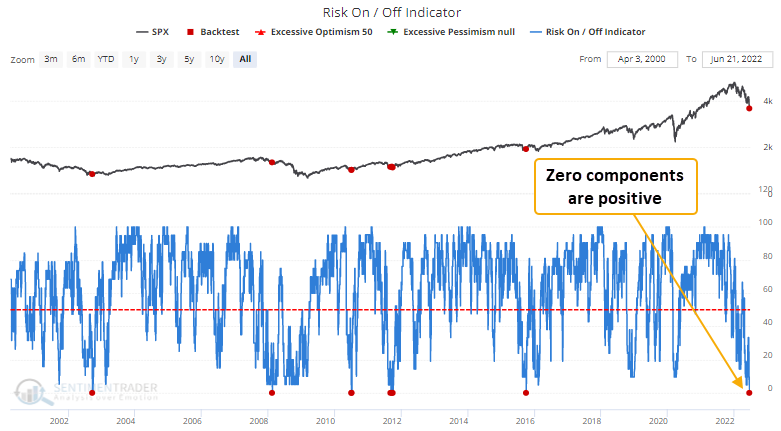
  • The SentimenTrader risk on/off indicator declined to zero on Friday
  • After other signals, the S&P 500 ETF rallied 100% of the time

Using the risk on/off indicator to identify capitulation lows

For only the 6th time in the last 23 years, the SentimenTrader risk on/off indicator declined to zero. As a reminder, the indicator utilizes a weight-of-the-evidence approach by combining 21 diverse components into a single model to assess the current market environment. 

Let's assess the outlook for the S&P 500 after similar signals. I created and saved today's study using our backtest engine. If you would like a copy, please click here. Repeat signals were screened out.

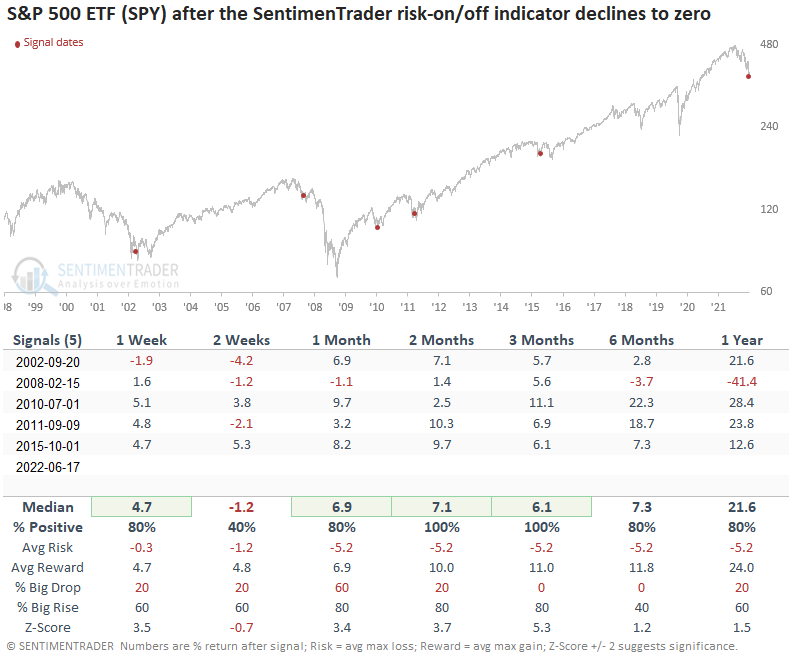
Similar signals preceded gains 100% of the time

This model generated a signal 5 times over the past 20 years. After the others, the S&P 500 ETF's future returns, win rates, and z-scores look excellent across almost all time frames. The 2-week window should be a friendly reminder that markets typically chop around and retest capitulation lows. Interestingly, the indicator did not fall to zero after several severe risk-off periods like September 2001, December 2018, and March 2020. And after the first signal in February 2008, the indicator failed to reach zero again.

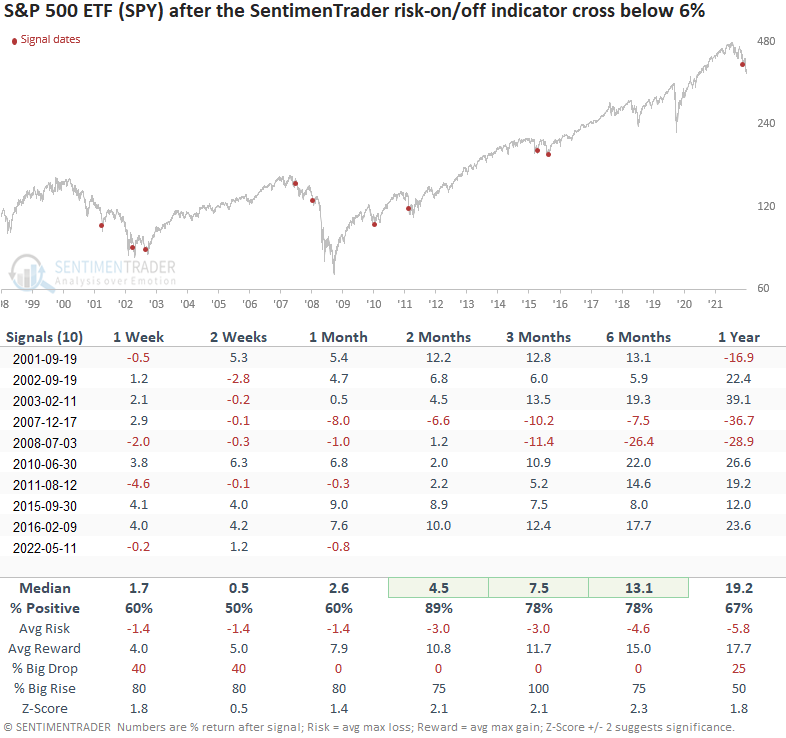
What happens if we increase the threshold level

If I increased the threshold level for the indicator to identify a cross below 6%, the study generated 10 other signals. After the others, SPY future returns, win rates, and z-scores were solid across medium-term time frames. The signal generated a positive return 2 months later in 4 out of 5 cases during the 2000-02 and 2007-08 bear markets. Once again, we should keep an open mind to choppy conditions and a potential retest of the lows based on the 2-week window

What the research tells us...

When the SentimenTrader risk on/off indicators declines to zero, history suggests a washed-out market, leading to a mean-reversion bounce. Similar setups to what we're seeing now have preceded positive gains across almost all time frames, especially the 2-month window. However, we need to be aware that the market could be choppy and potentially retest the lows based on the 2-week time frame.

The market remains exceptionally hostile as the Federal Reserve continues to tighten policy in a decelerating growth environment. One can make a strong argument that we are in uncharted territory. For example, when the Federal Reserve raised the fed funds target rate last week, the S&P 500 was down 21% from its high. That's the worst drawdown at the time of a 1st to 3rd rate increase since my data started in 1959. So, while the market is washed-out and appears ripe for a bear market bounce, we need to keep an open mind to all outcomes and manage risk appropriately.

PRODUCTS
SentimenTrader
Trading Tools
Indicators & Data API
‍
Strategies & Scanner
‍
Research Reports
FREE
RESOUrCES
Simple Backtest
Calculator
Simple Seasonality
Calculator
The Kelly Criterion
Calculator
Sentiment Geo Map
‍
Public Research Reports
‍
Pricing
Bundle pricing
‍
Announcements
‍
FAQ
COMPANY
‍
About
‍
In the News
‍
Testimonials
‍
Client Success Stories
CONTACT
‍
General Inquiries
‍
Media Inquiries
‍
Financial Professionals Inquiries
‍
© 2025 Sundial Capital Research Inc. All rights reserved.
Setsail Marketing
TermsPrivacyAffiliate Program
Risk Disclosure: Futures and forex trading contains substantial risk and is not for every investor. An investor could potentially lose all or more than the initial investment. Risk capital is money that can be lost without jeopardizing ones’ financial security or life style. Only risk capital should be used for trading and only those with sufficient risk capital should consider trading. Past performance is not necessarily indicative of future results.

Hypothetical Performance Disclosure: Hypothetical performance results have many inherent limitations, some of which are described below. No representation is being made that any account will or is likely to achieve profits or losses similar to those shown; in fact, there are frequently sharp differences between hypothetical performance results and the actual results subsequently achieved by any particular trading program. One of the limitations of hypothetical performance results is that they are generally prepared with the benefit of hindsight. In addition, hypothetical trading does not involve financial risk, and no hypothetical trading record can completely account for the impact of financial risk of actual trading. for example, the ability to withstand losses or to adhere to a particular trading program in spite of trading losses are material points which can also adversely affect actual trading results. There are numerous other factors related to the markets in general or to the implementation of any specific trading program which cannot be fully accounted for in the preparation of hypothetical performance results and all which can adversely affect trading results.

Testimonial Disclosure: Testimonials appearing on this website may not be representative of other clients or customers and is not a guarantee of future performance or success.