Data &
Technology
Research
Reports
Report Solutions
Reports Library
Actionable
Strategies
Free
Resources
Simple Backtest Calculator
Simple Seasonality Calculator
The Kelly Criterion Calculator
Sentiment Geo Map
Public Research Reports
Free Webinar
Pricing
Company
About
Meet Our Team
In the News
Testimonials
Client Success Stories
Contact
Log inLoginSign up
< BACK TO ALL REPORTS

Even as stocks tickled new highs, a historic thrust in breadth

Jason Goepfert
2022-01-06
NYSE securities have seen a breadth thrust over the past 10 days. Natural gas is facing a negative seasonal window.

Another thrust into the new year

Over the past couple of weeks, we have outlined several breadth thrusts in the broader market and some individual sectors.

Now, the relatively broad-based nature of the recent rise has also triggered a thrust in NYSE Up Issues. Over the past 2 weeks, an average day has witnessed 62% of securities advancing.

Breadth thrust in NYSE securities

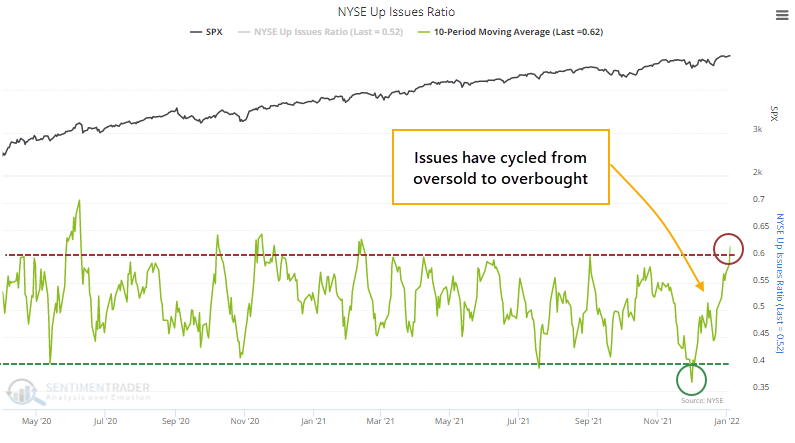
More than 63% of volume has been focused on those advancing securities, also triggering a thrust in NYSE Up Volume.

There are an infinite number of ways to measure breadth and thrusts. We don't subscribe to the idea that there are official rules for either. We test them from many different perspectives with the sole purpose of trying to discover whether investors are eager to own stocks or not and what that might suggest for how they'll behave going forward.

When both the 10-day Up Issues and Up Volume ratios cycle from below 40% to above 60% within 30 days, it suggested that investors will keep buying, especially when the S&P 500 was within correction territory of less than a 10% drawdown from a multi-year high.

Stat box

The Invesco India ETF (PIN) just ended a streak of 10 straight days of gains. That's the fund's 2nd-longest win streak since its inception, next to an 11-day win streak in early April 2011.


Not a great time for gas

Jay took an in-depth look at seasonality in natural gas, and the implications for funds like KOLD.

The chart below displays the annual seasonal trend for natural gas futures. Between the start of the year and trading day of the year (TDY) #41, this market tends to show weakness.

Natural gas weak seasonality

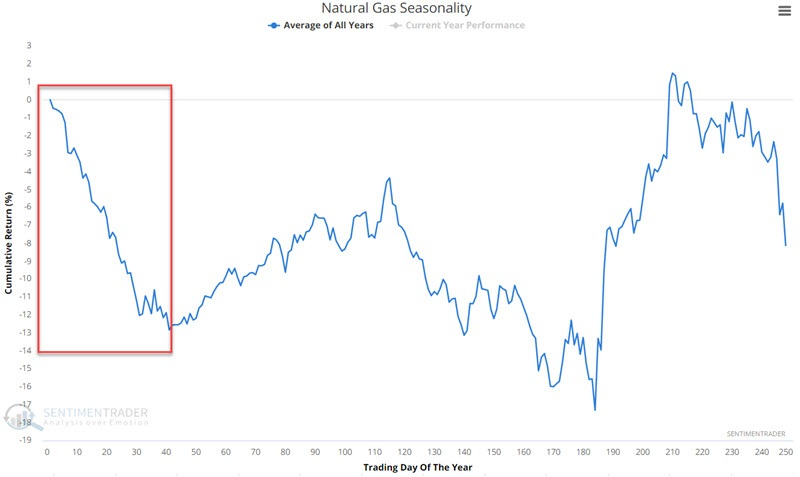
It is always important to remember that seasonality charts are not roadmaps. In other words, they tell you what has happened in the past, not what will happen the next time around. That said, holding the KOLD fund during this window has led to consistent - but still volatile - gains.

DATA &
TECHnologies
IndicatorEdge
‍
BackTestEdge
‍
Other Tools
‍
DataEdge API
RESEARCH
reports
Research Solution
‍
Reports Library
‍
actionable
Strategies
Trading Strategies
‍
Smart Stock Scanner
‍
FREE
RESOUrCES
Simple Backtest
Calculator
Simple Seasonality
Calculator
The Kelly Criterion
Calculator
Sentiment Geo Map
‍
Public Research Reports
‍
Free Webinar
COMPANY
‍
About
‍
Meet our Team
‍
In the News
‍
Testimonials
‍
Client Success Stories
Pricing
Bundle pricing
‍
Announcements
‍
FAQ
© 2024 Sundial Capital Research Inc. All rights reserved.
Setsail Marketing
TermsPrivacyAffiliate Program
Risk Disclosure: Futures and forex trading contains substantial risk and is not for every investor. An investor could potentially lose all or more than the initial investment. Risk capital is money that can be lost without jeopardizing ones’ financial security or life style. Only risk capital should be used for trading and only those with sufficient risk capital should consider trading. Past performance is not necessarily indicative of future results.

Hypothetical Performance Disclosure: Hypothetical performance results have many inherent limitations, some of which are described below. No representation is being made that any account will or is likely to achieve profits or losses similar to those shown; in fact, there are frequently sharp differences between hypothetical performance results and the actual results subsequently achieved by any particular trading program. One of the limitations of hypothetical performance results is that they are generally prepared with the benefit of hindsight. In addition, hypothetical trading does not involve financial risk, and no hypothetical trading record can completely account for the impact of financial risk of actual trading. for example, the ability to withstand losses or to adhere to a particular trading program in spite of trading losses are material points which can also adversely affect actual trading results. There are numerous other factors related to the markets in general or to the implementation of any specific trading program which cannot be fully accounted for in the preparation of hypothetical performance results and all which can adversely affect trading results.

Testimonial Disclosure: Testimonials appearing on this website may not be representative of other clients or customers and is not a guarantee of future performance or success.