Products
SentimenTrader Trading Tools
‍
Backtest Engine
My Trading Toolkit
Correlation Analysis
Seasonality
Market Prediction
Indicators & Data API
‍
Proprietary Indicators & Charts
Market Data API
Strategies & Scanner
‍
50+ Trading Strategies
Smart Stock Scanner
Smart Option Scanner
Research Reports
‍
Research Solutions
Reports Library
Free Resources
Simple Backtest Calculator
Simple Seasonality Calculator
The Kelly Criterion Calculator
Sentiment Geo Map
Public Research Reports
Education
Sentiment Indicators
Technical Indicators
Pricing
Company
About
In the News
Testimonials
Client Success Stories
Contact
Log inLoginSign up
< BACK TO ALL REPORTS

ETF Traders Are Long And Leveraged; Baltic Dry Index Is Plunging

Jason Goepfert
2020-01-08
ETF traders are piling into leveraged long funds while leaving leveraged short (inverse) funds, and the Baltic Dry Index is plunging.

Long and leveraged

We saw on Monday how some of the most leveraged traders in the markets are seemingly going all-in on the idea of a continued rally in stocks, with one of the biggest spikes in options speculation since the year 2000.

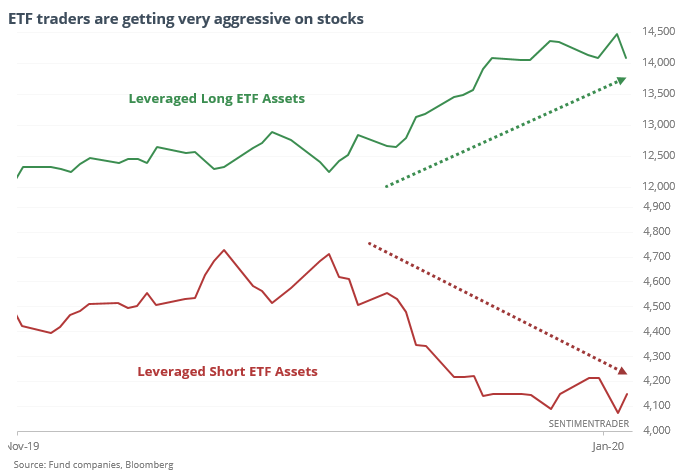
They’re not the only leveraged players pressing their bets. Assets in ETFs leveraged to a stock rally are soaring, while those protecting against a fall are leaking assets. Leveraged long funds, like SSO, QLD, and UWM (among others) are seeing a push in assets while leveraged short funds like SDS, QID, and DXD are seeing the opposite.

leveraged etf long and short assets

Because the trend since 2010 is “up and to the right,”, forward returns weren’t terrible, but over the next 1-3 months, the S&P’s median was below a random return. More worrisome is the risk/reward skew. Up to three months later, risk was equal to or higher than reward, which is no easy feat given the trend over the past 10 years.


Baltic Dry Index

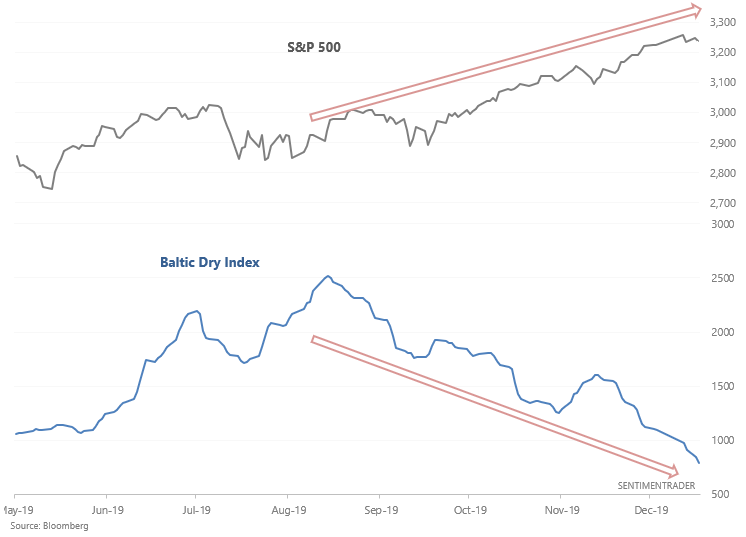
The Baltic Dry Index is one of those indices which gets no attention until its falling. When it does fall, people start to point out "SHIPPING BELLWEATHER IS SLIDING! RECESSSIONNNN!!"

But in all seriousness, here's the S&P 500 vs. the Baltic Dry Index over the past 5 months.

baltic dry index

When the Baltic Dry Index fell more than -60% over a 4 month period while the S&P rallied, it wasn't a consistently bearish factor for the stock market.

s&p 500 and baltic dry index

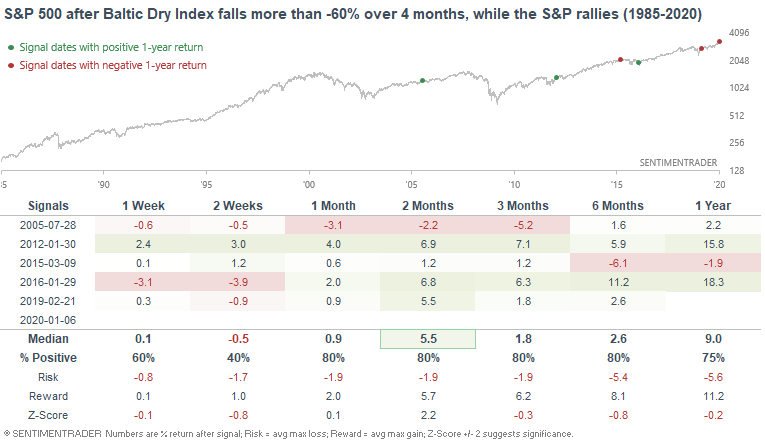
There are seasonal factors in play here, but whatever the reason, the BDI has been an inconsistent - at best - indicator for future stock returns.

This is an abridged version of our recent reports and notes. For immediate access with no obligation, sign up for a 30-day free trial now.

We also looked at:

  • The S&P 500 is rising even as its components' earnings are declining
  • A lot of stocks in the United Kingdom's FTSE 100 index are giving MACD sell signals
  • What happens after Economic Policy Uncertainty has plunged
  • Emerging markets are rising even while the copper/gold ratio is dropping
PRODUCTS
SentimenTrader
Trading Tools
Indicators & Data API
‍
Strategies & Scanner
‍
Research Reports
FREE
RESOUrCES
Simple Backtest
Calculator
Simple Seasonality
Calculator
The Kelly Criterion
Calculator
Sentiment Geo Map
‍
Public Research Reports
‍
Education
Sentiment Indicators
‍
Technical Indicators
‍
Pricing
Bundle pricing
‍
FAQ
‍
Announcements
‍
COMPANY
‍
About
‍
In the News
‍
Testimonials
‍
Client Success Stories
CONTACT
‍
General Inquiries
‍
Media Inquiries
‍
Financial Professionals Inquiries
‍
© 2026 Sundial Capital Research Inc. All rights reserved.
Setsail Marketing
TermsPrivacyAffiliate Program
Risk Disclosure: The information and tools provided are for research and analytical purposes only and are not intended as investment advice. Market analysis involves uncertainty, and outcomes may differ from expectations. Users should conduct their own due diligence and consider their individual circumstances before making any financial decisions. Past performance is not necessarily indicative of future results.

Hypothetical Performance Disclosure: Hypothetical performance results have many inherent limitations, some of which are described below. No representation is being made that any account will or is likely to achieve profits or losses similar to those shown; in fact, there are frequently sharp differences between hypothetical performance results and the actual results subsequently achieved by any particular trading program. One of the limitations of hypothetical performance results is that they are generally prepared with the benefit of hindsight. In addition, hypothetical trading does not involve financial risk, and no hypothetical trading record can completely account for the impact of financial risk of actual trading. for example, the ability to withstand losses or to adhere to a particular trading program in spite of trading losses are material points which can also adversely affect actual trading results. There are numerous other factors related to the markets in general or to the implementation of any specific trading program which cannot be fully accounted for in the preparation of hypothetical performance results and all which can adversely affect trading results.

Testimonial Disclosure: Testimonials appearing on this website may not be representative of other clients or customers and is not a guarantee of future performance or success.