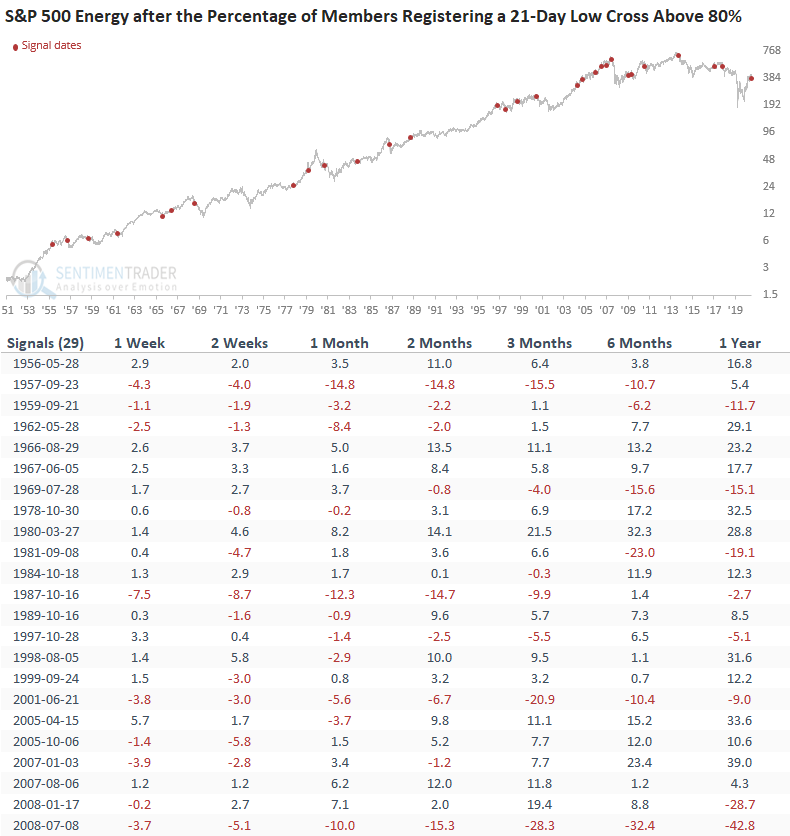
Energy - Surge in 21-Day Lows

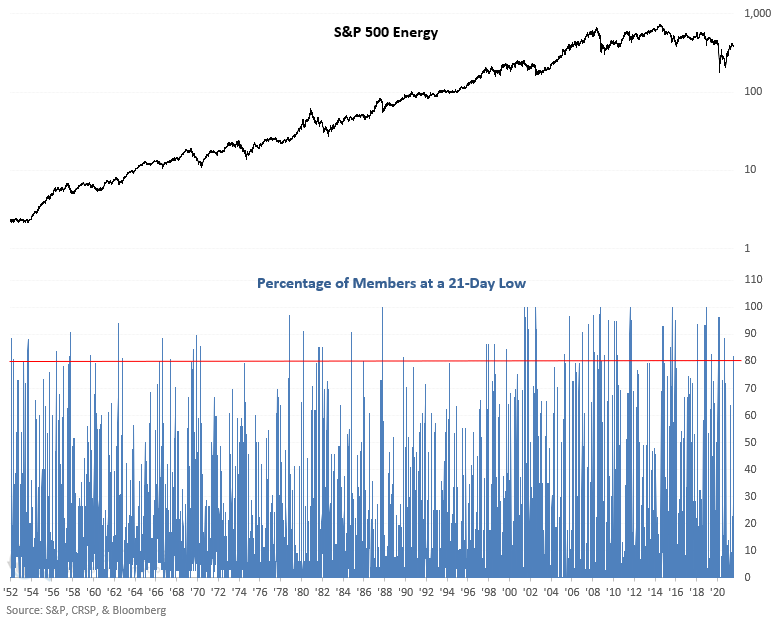
On Thursday, I shared a trading signal for the S&P 1500 Oil & Gas Exploration & Production sub-industry that suggested a cautious short-term outlook for the group. The energy sector weakened considerably on the day, and new lows expanded in a meaningful way. According to our calculation, the percentage of S&P 500 Energy sector members registering a 21-day low surged to 81.82%, a level not seen since September 2020.
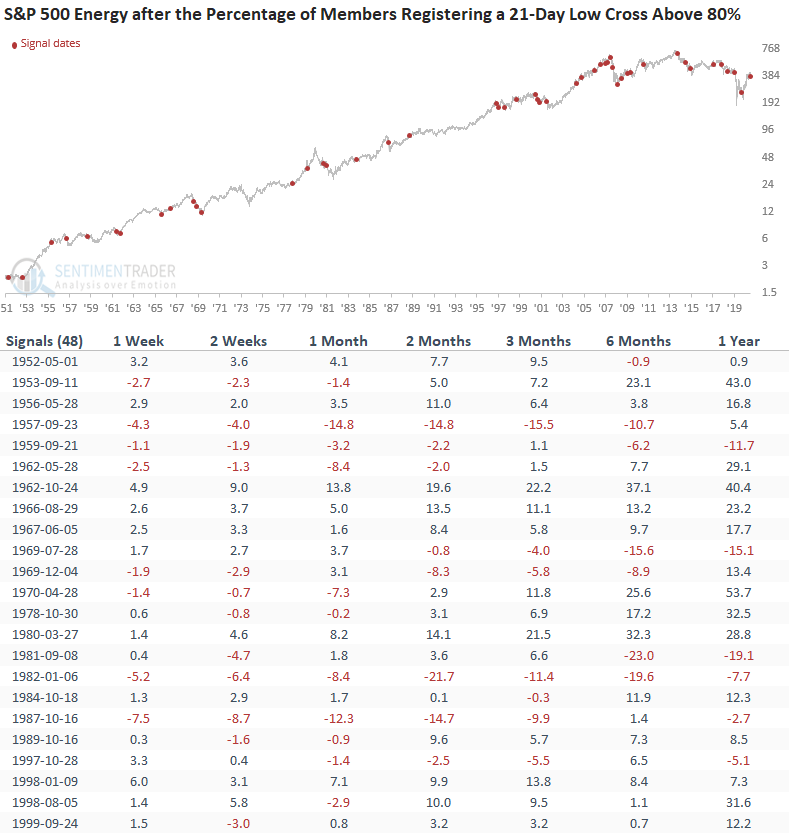
Let's assess the forward return outlook for the energy sector when the percentage of members registering a 21-day low surge above 80%.
Please click here for a copy of this scan in the backtest engine.
HISTORICAL CHART
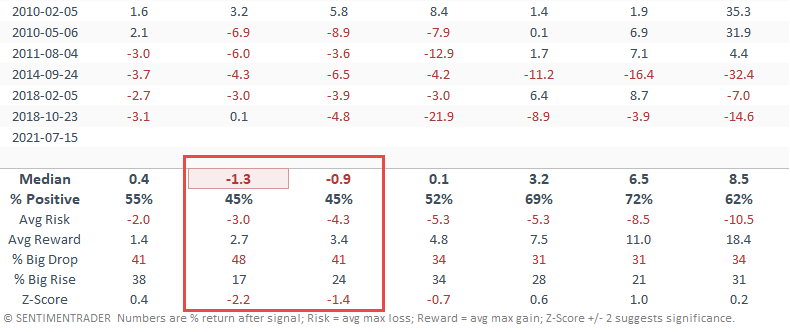
HOW THE SIGNALS PERFORMED
Results look weak in the short term, especially the 2-week timeframe, which shows a z-score with an unfavorable risk/reward outlook.
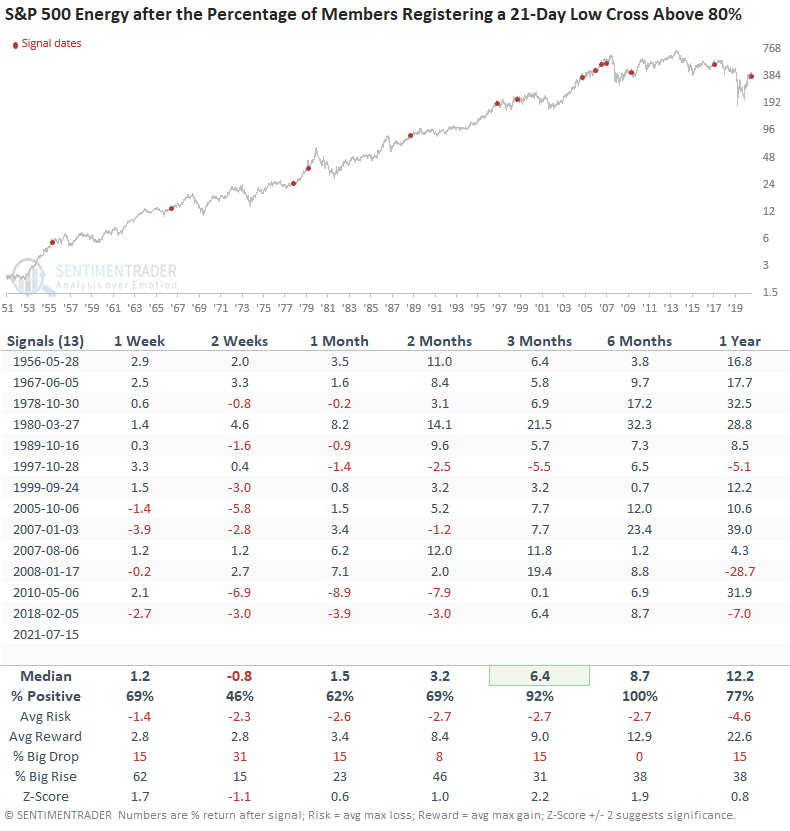
Let's add one more filter to the study. We will now isolate the first surge above 80% after the energy sector has closed at a 252-day high. The new filter will help to isolate a condition similar to the current environment.
HOW THE SIGNALS PERFORMED - THE FIRST INSTANCE AFTER A 252-DAY HIGH
Once again, we see weak short-term results with an unfavorable risk/reward profile in the 2-week timeframe.
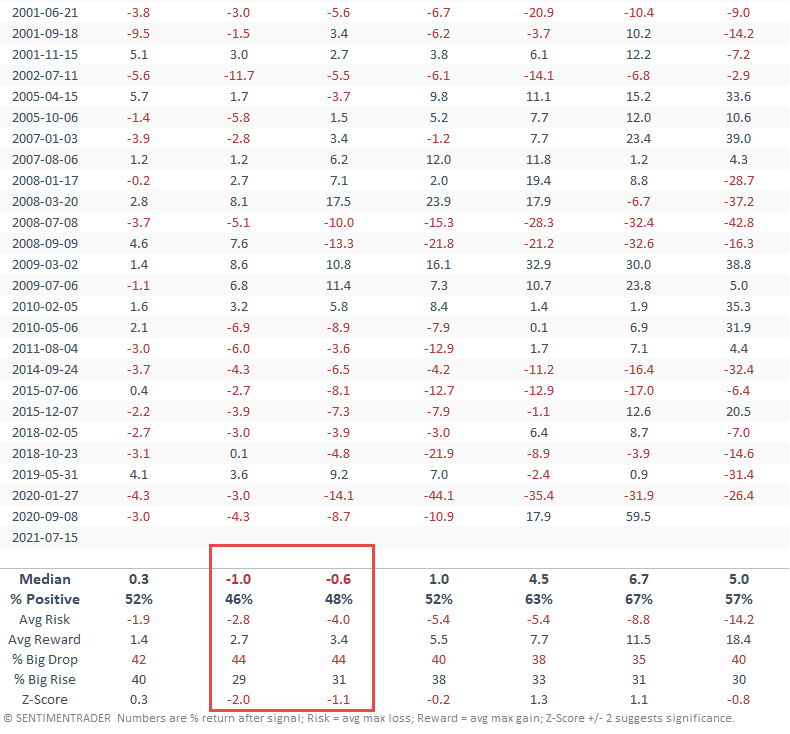
Let's adjust the filter one more time. We will now isolate when the percentage of members registering a 21-day low crosses above 80%, and the sector is 22 days or less from a 252-Day high. The new filter will once again help to isolate a condition similar to the current environment
HOW THE SIGNALS PERFORMED - INSTANCES WITHIN 22 DAYS OF 252-DAY HIGH
The 2-week timeframe is once again weak. However, it doesn't show significance. More importantly, the 3-6 month timeframes look outstanding. The 22-day filter suggests that we should be getting ready to buy the dip in the next few weeks.