Data &
Technology
Research
Reports
Report Solutions
Reports Library
Actionable
Strategies
Free
Resources
Simple Backtest Calculator
Simple Seasonality Calculator
The Kelly Criterion Calculator
Sentiment Geo Map
Public Research Reports
Free Webinar
Pricing
Company
About
Meet Our Team
In the News
Testimonials
Client Success Stories
Contact
Log inLoginSign up
< BACK TO ALL REPORTS

Energy stocks trying to turn golden

Jason Goepfert
2020-12-24
For the first time in over 2 years, the energy sector is on the cusp of a Golden Cross, with the 50-day moving average crossing above the 200-day.

Earlier this fall, we saw that the energy sector had become the most-hated of all time and firms were cutting workers and dividends, before there were finally some signs of an uptick.

Many of these stocks staged a furious rally then spent recent weeks digesting those gains. Even so, it's been enough of a change in trend that the S&P 500 Energy Sector's 50-day moving average is oh-so-close to crossing above the 200-day average. It would be the first time in more than 2 years.

Energy sector golden cross 50 200 day moving average

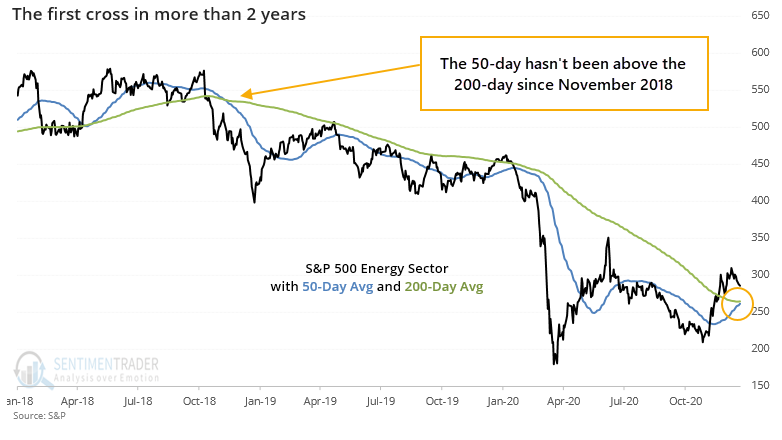
When this finally does cross, it will end the 2nd-longest streak of being in a downtrend since 1926.

When we look at long-term returns after the ends of such long streaks, there were further gains every time during the next 1-2 years, even if it was a volatile path to get there.


What else is happening

These are topics we explored in our most recent research. For immediate access with no obligation, sign up for a 30-day free trial now.

  • Full details on energy's future returns after ending other prolonged declines
  • Taking a look at lesser extremes to see how robust this pattern was
  • What happens when the small-cap Russell 2000 hits a new high before year-end
  • The index is also up for 8 weeks in row
  • Though it did carve out a questionable pattern on Wednesday
  • The options market is still going crazy
  • An ag market just enjoyed its best run in years

Stat Box

The Russell 2000 closed at a new high with a week left in the year, which it's only done twice before, in 2004 and 2013. Both saw minor gains over the next few days, then losses during the next month.

Sentiment from other perspectives

We don't necessarily agree with everything posted here - some of our work might directly contradict it - but it's often worth knowing what others are watching.

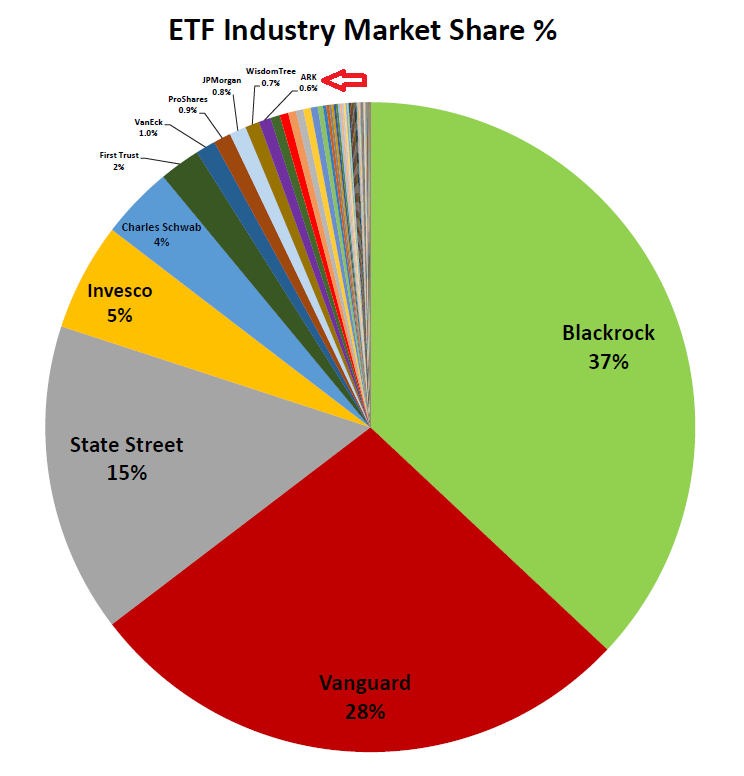
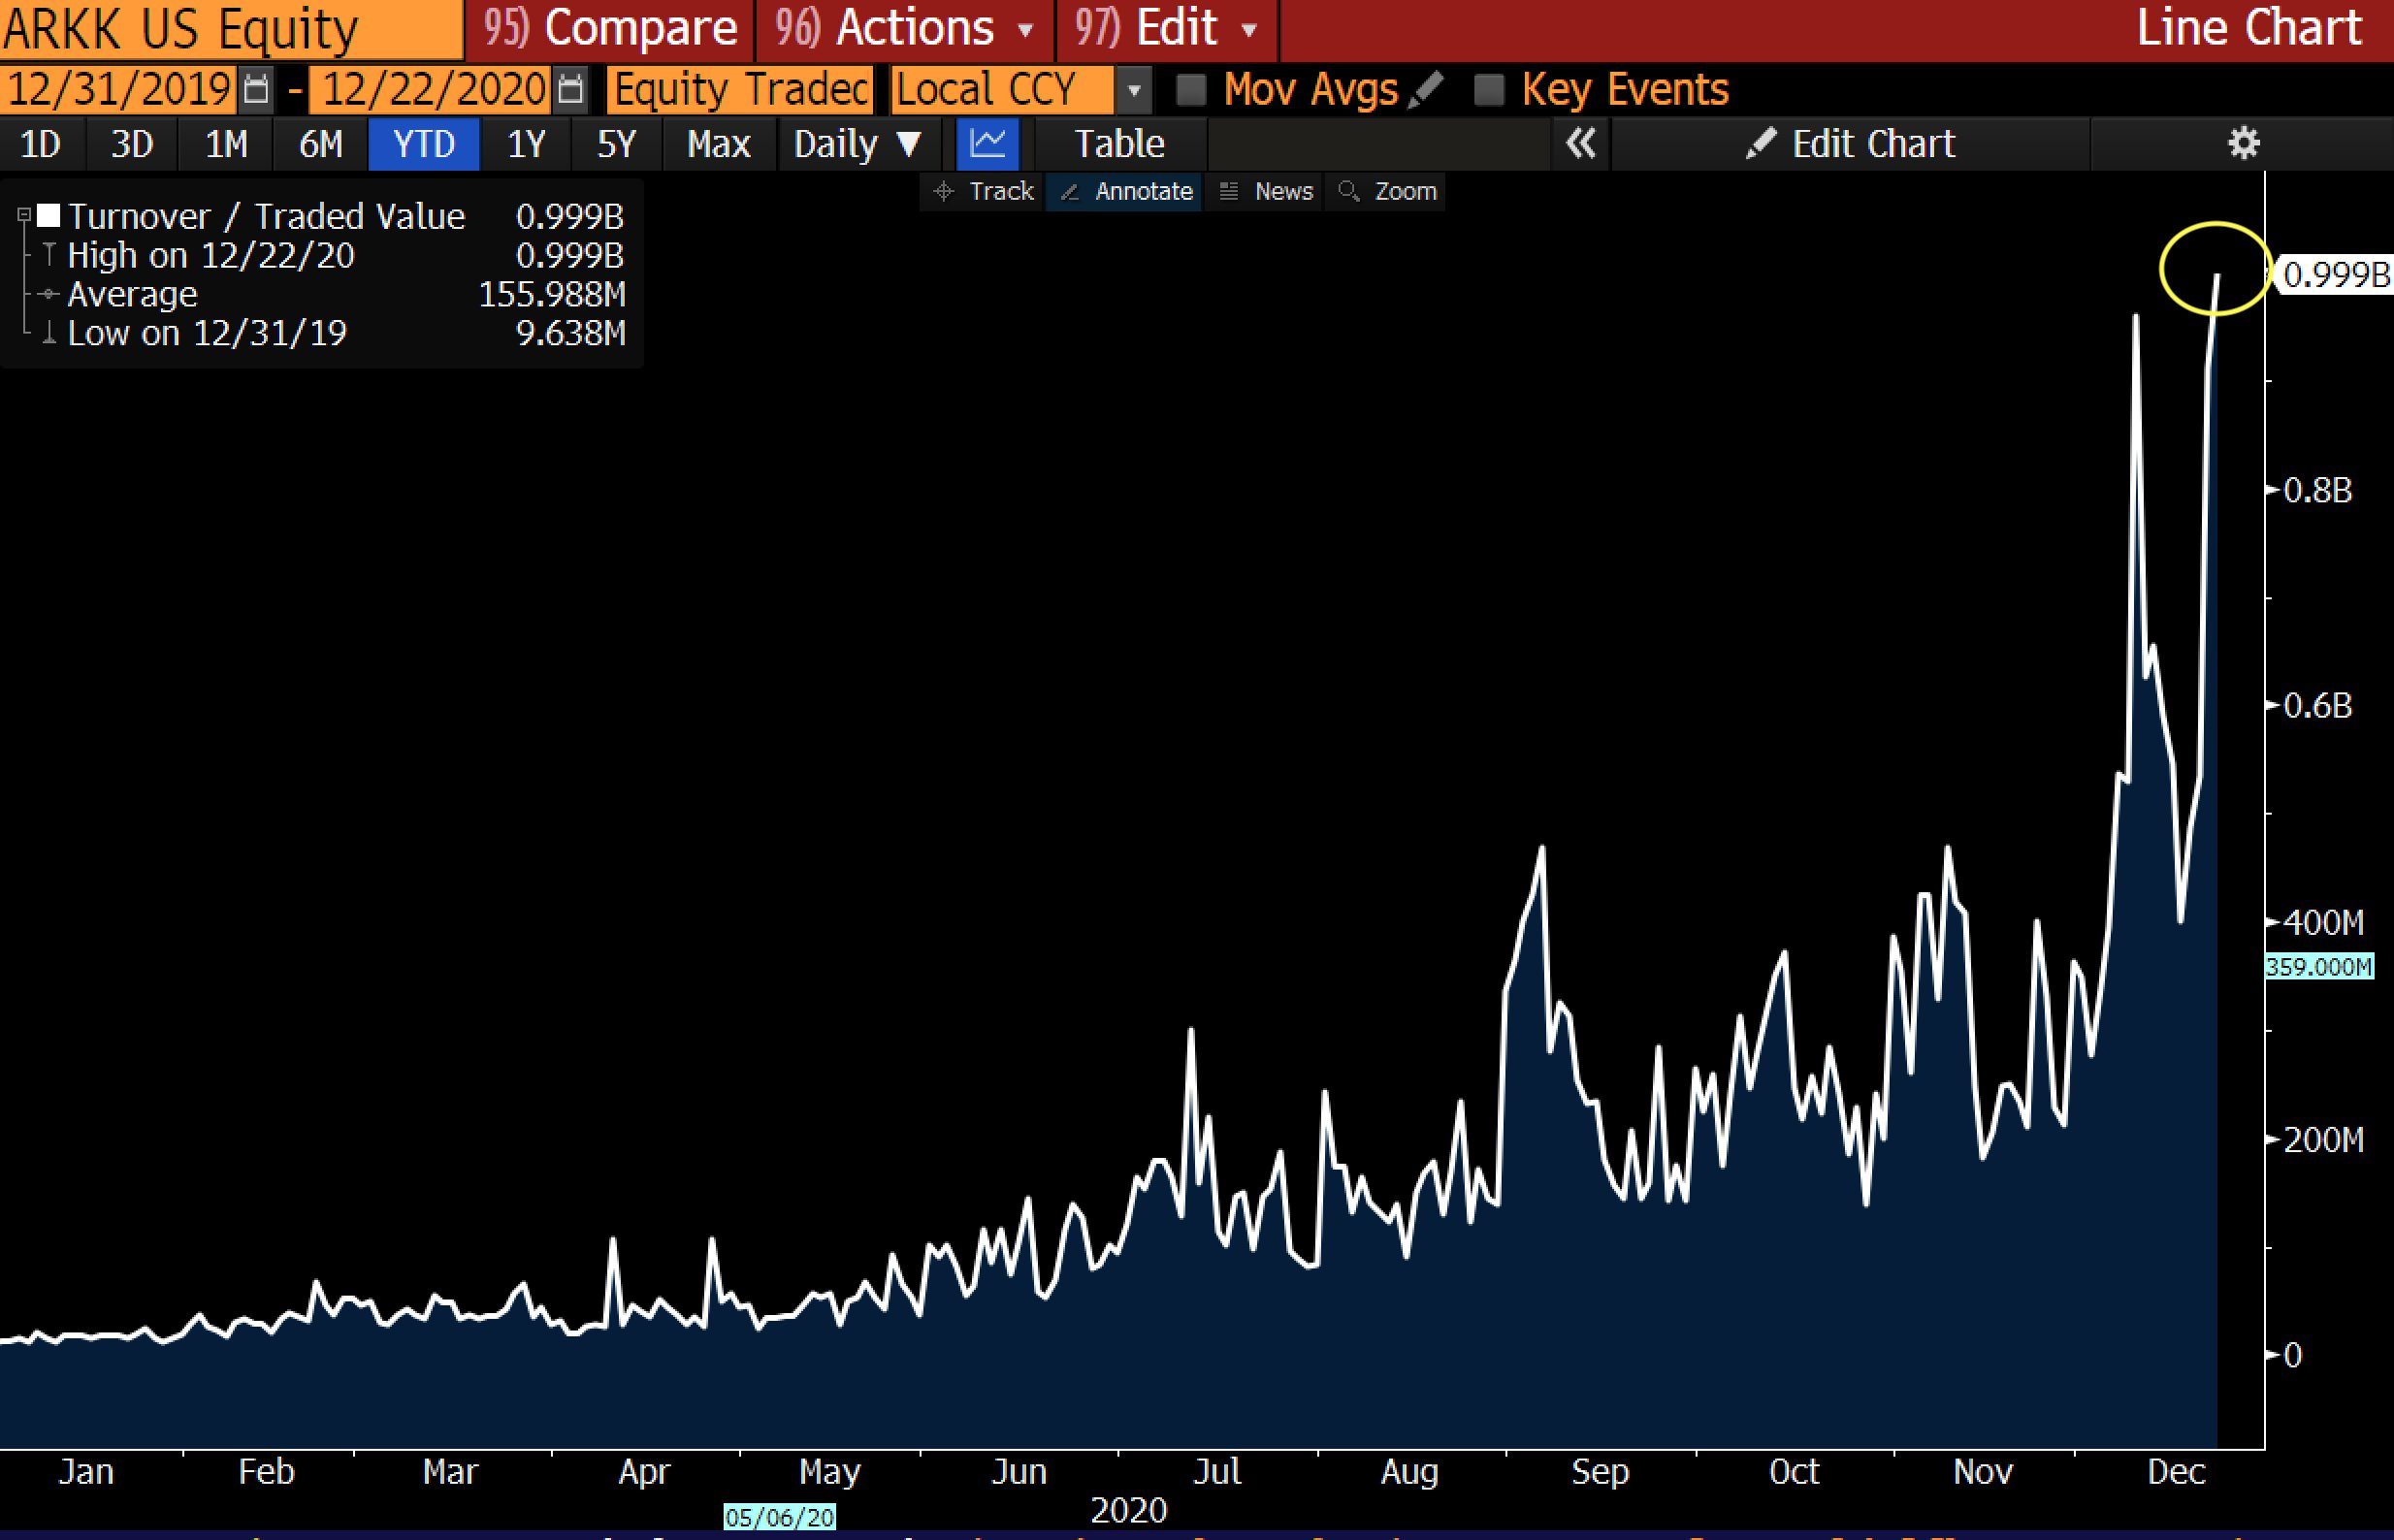
1. At times of minimum risk aversion, investors will buy into stories. Stories like those told by the ARK family of funds, a master at using buzzwords ("ARK believes innovation is key to growth. We aim to capture long-term growth and capital appreciation created by disruptive innovation."). And investors cannot get enough, with trading activity a jaw-dropping levels. [Eric Balchunas]

ark etf trading volume

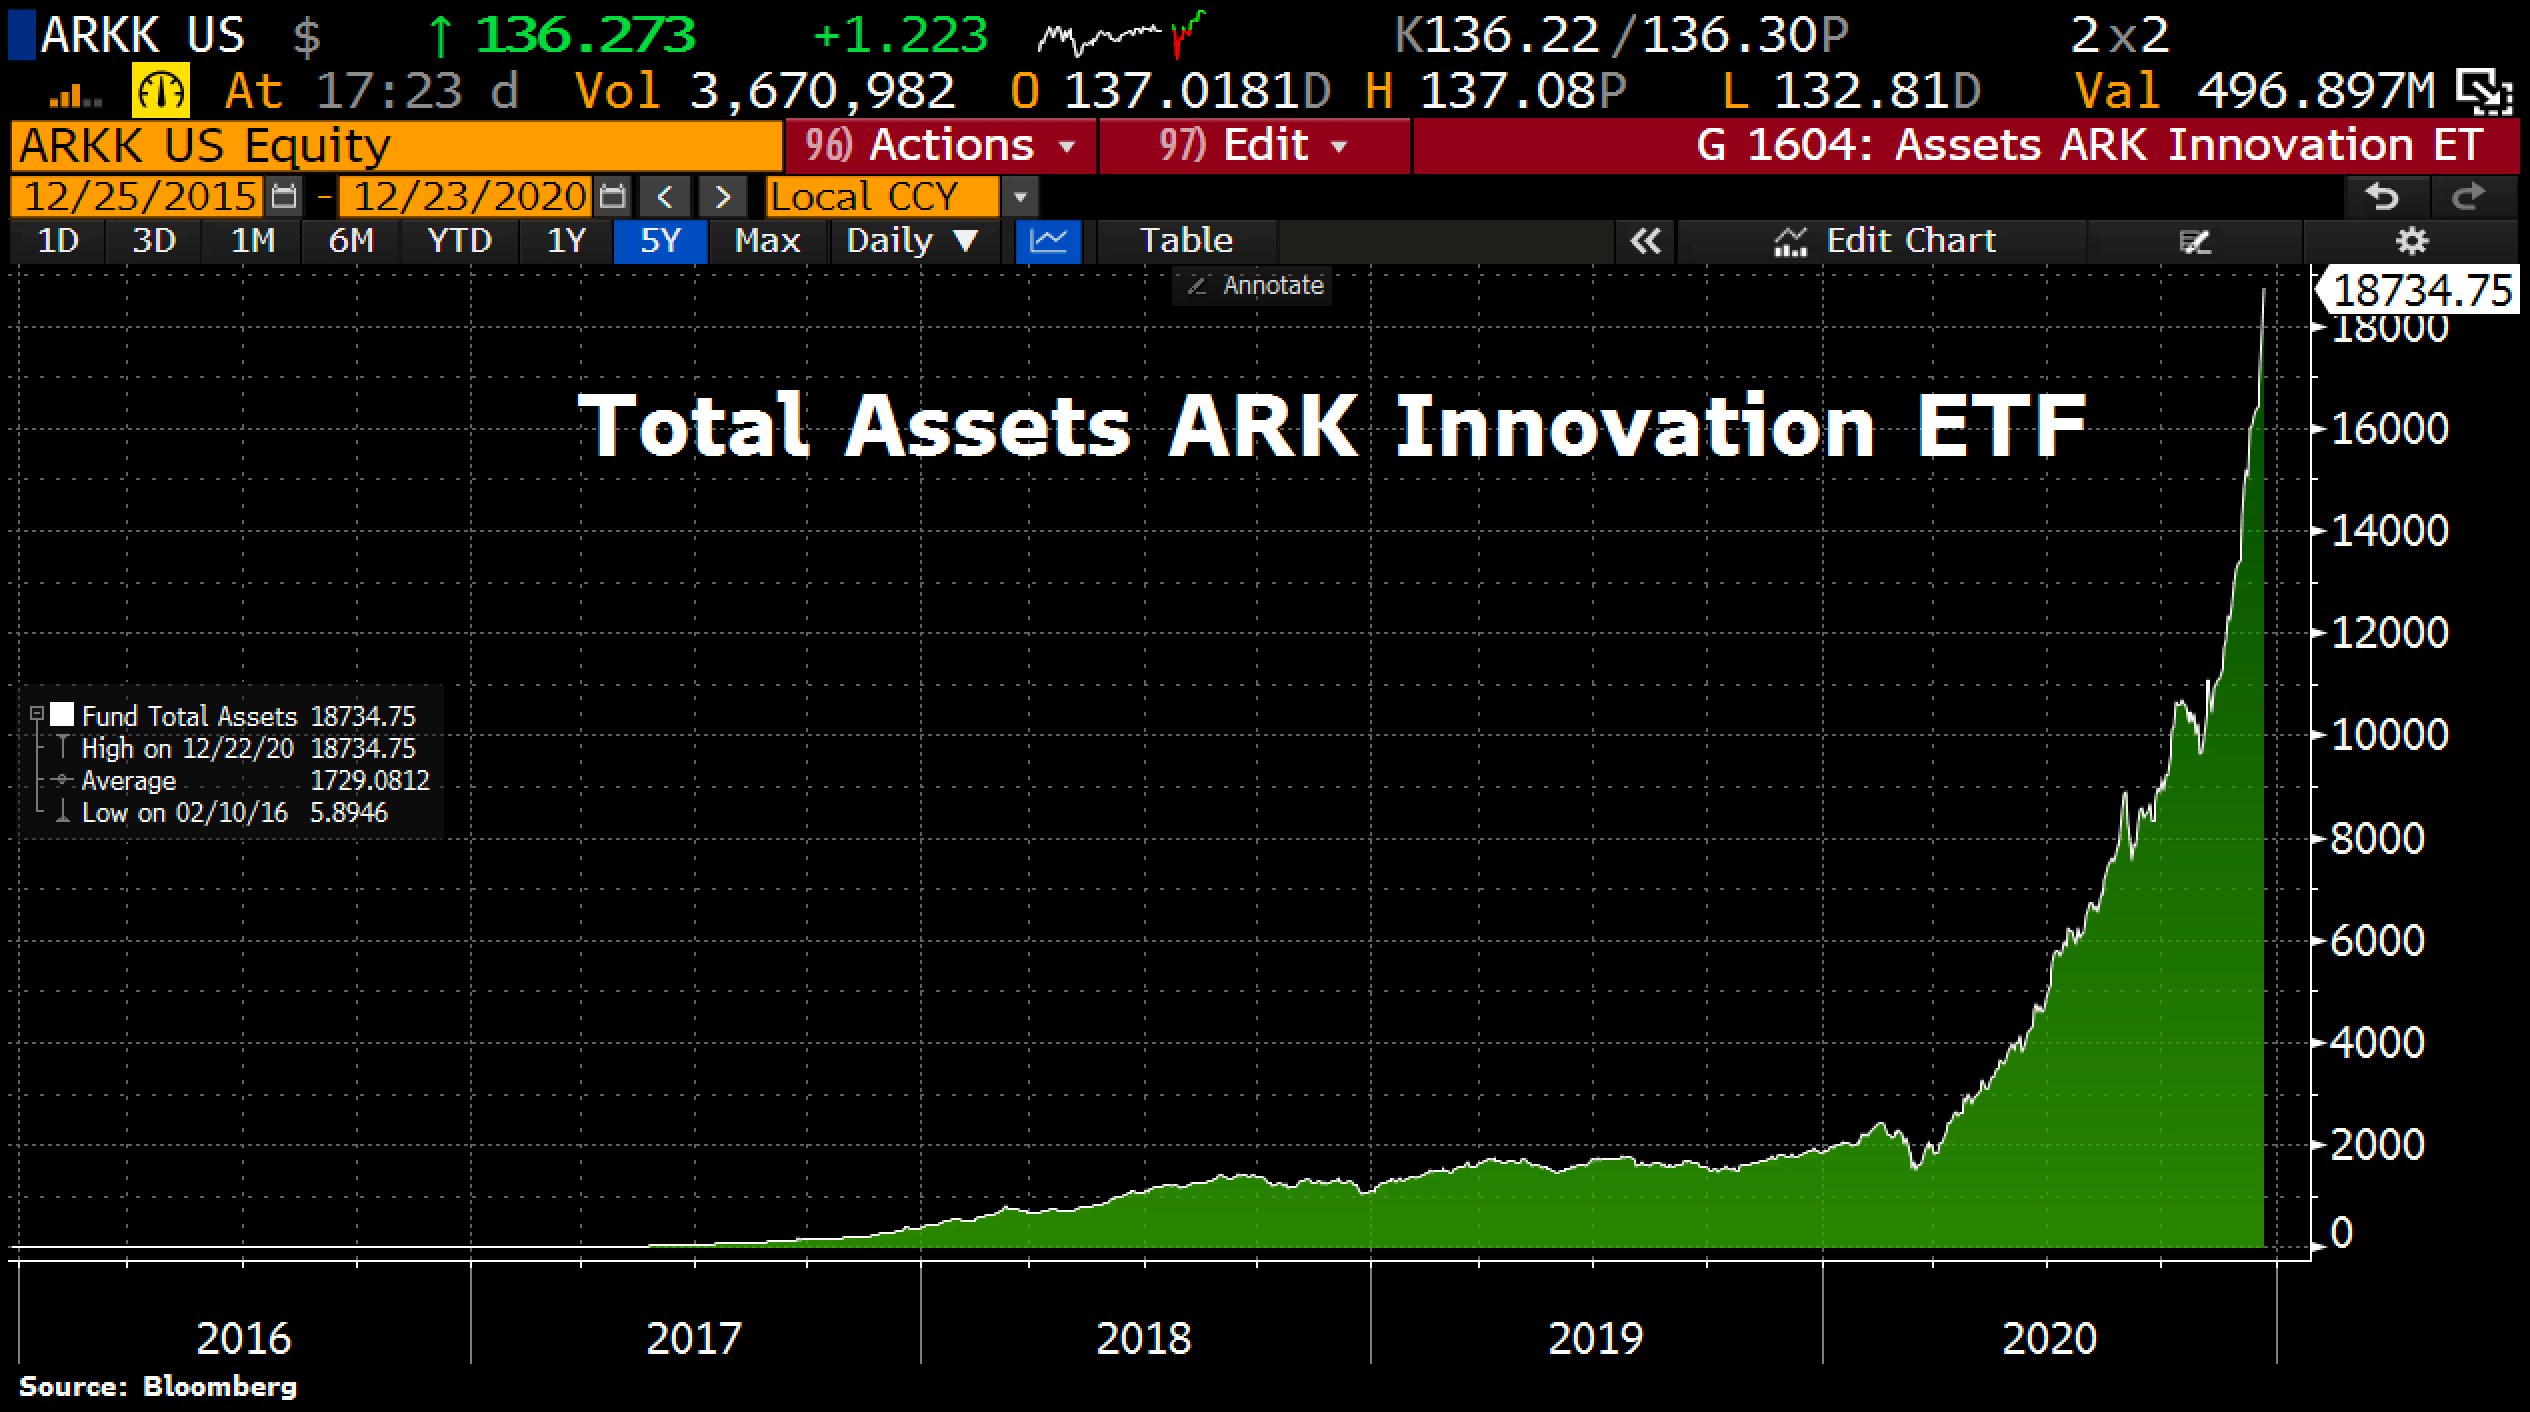
2. That's driven the ARKK fund's assets to tremendous heights. [Holger Zschaepitz]

ark etf assets

3. The rush into the funds are so mad that the company is now ranking among the largest in the industry. [Nate Geraci]

largest etf companies

DATA &
TECHnologies
IndicatorEdge
‍
BackTestEdge
‍
Other Tools
‍
DataEdge API
RESEARCH
reports
Research Solution
‍
Reports Library
‍
actionable
Strategies
Trading Strategies
‍
Smart Stock Scanner
‍
FREE
RESOUrCES
Simple Backtest
Calculator
Simple Seasonality
Calculator
The Kelly Criterion
Calculator
Sentiment Geo Map
‍
Public Research Reports
‍
Free Webinar
COMPANY
‍
About
‍
Meet our Team
‍
In the News
‍
Testimonials
‍
Client Success Stories
Pricing
Bundle pricing
‍
Announcements
‍
FAQ
© 2024 Sundial Capital Research Inc. All rights reserved.
Setsail Marketing
TermsPrivacyAffiliate Program
Risk Disclosure: Futures and forex trading contains substantial risk and is not for every investor. An investor could potentially lose all or more than the initial investment. Risk capital is money that can be lost without jeopardizing ones’ financial security or life style. Only risk capital should be used for trading and only those with sufficient risk capital should consider trading. Past performance is not necessarily indicative of future results.

Hypothetical Performance Disclosure: Hypothetical performance results have many inherent limitations, some of which are described below. No representation is being made that any account will or is likely to achieve profits or losses similar to those shown; in fact, there are frequently sharp differences between hypothetical performance results and the actual results subsequently achieved by any particular trading program. One of the limitations of hypothetical performance results is that they are generally prepared with the benefit of hindsight. In addition, hypothetical trading does not involve financial risk, and no hypothetical trading record can completely account for the impact of financial risk of actual trading. for example, the ability to withstand losses or to adhere to a particular trading program in spite of trading losses are material points which can also adversely affect actual trading results. There are numerous other factors related to the markets in general or to the implementation of any specific trading program which cannot be fully accounted for in the preparation of hypothetical performance results and all which can adversely affect trading results.

Testimonial Disclosure: Testimonials appearing on this website may not be representative of other clients or customers and is not a guarantee of future performance or success.