Data &
Technology
Research
Reports
Report Solutions
Reports Library
Actionable
Strategies
Free
Resources
Simple Backtest Calculator
Simple Seasonality Calculator
The Kelly Criterion Calculator
Sentiment Geo Map
Public Research Reports
Free Webinar
Pricing
Company
About
Meet Our Team
In the News
Testimonials
Client Success Stories
Contact
Log inLoginSign up
< BACK TO ALL REPORTS

Energy Stocks - Oversold in an Uptrend

Dean Christians
2021-03-19
Energy stocks are oversold against the backdrop of a strong uptrend. Let's review forward returns when zero members are above the 10-day moving average, and greater than 95% are above the 200-day moving average.

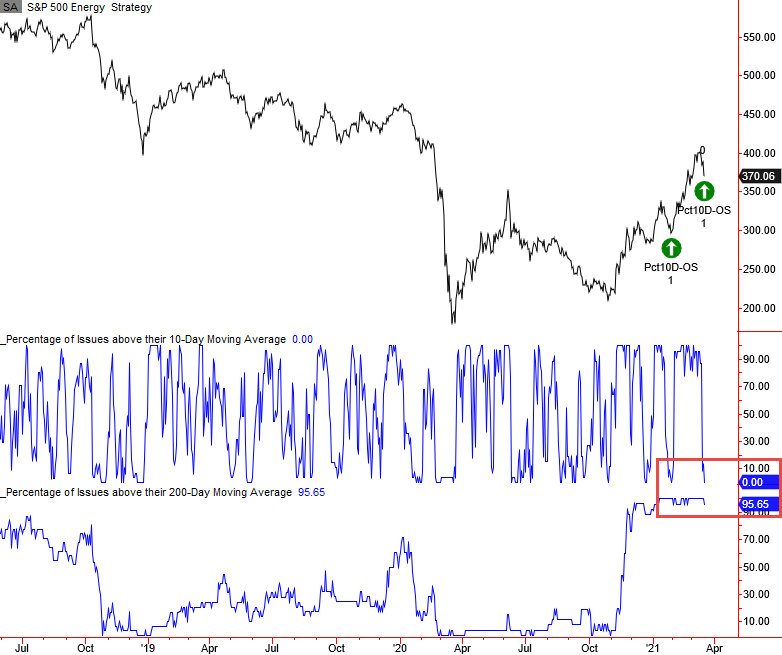
After closing at a new 252-day high last Friday, energy stocks have reversed down this week. On Thursday, I noticed that zero S&P 500 energy sector members closed above their respective 10-day moving average. Simultaneously, over 95% of the energy members are trading above their respective 200-day moving average.

The group is short-term oversold in an uptrend.

Let's review the forward return outlook for energy stocks under the current scenario and take a look at some other signals I'm keeping an eye on.

Current Energy Chart

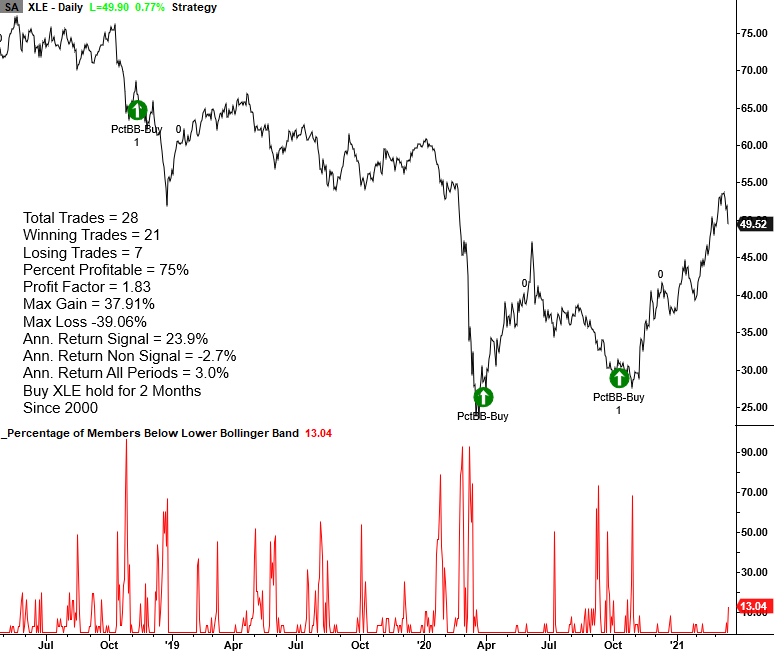
As the chart below shows, this is the second signal in less than 2 months.

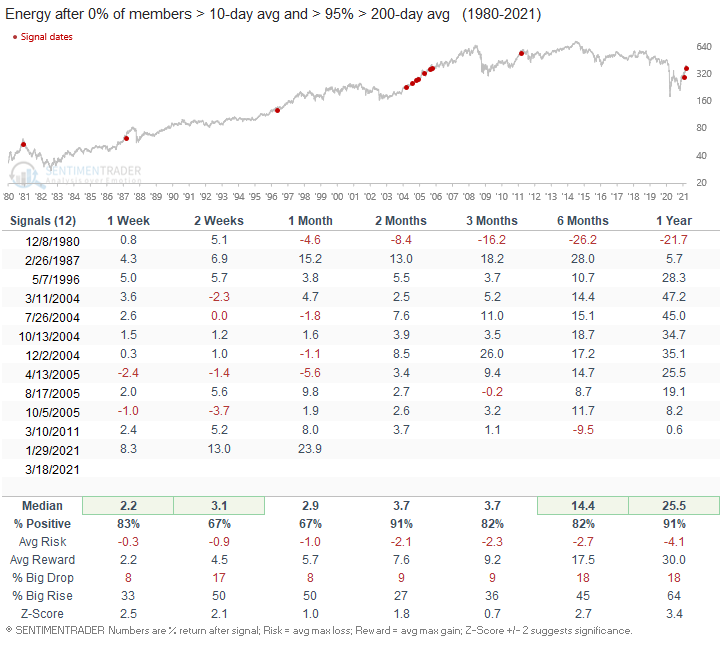
Energy Signal Performance

Excluding the 1980 signal, forward returns look solid across all timeframes.

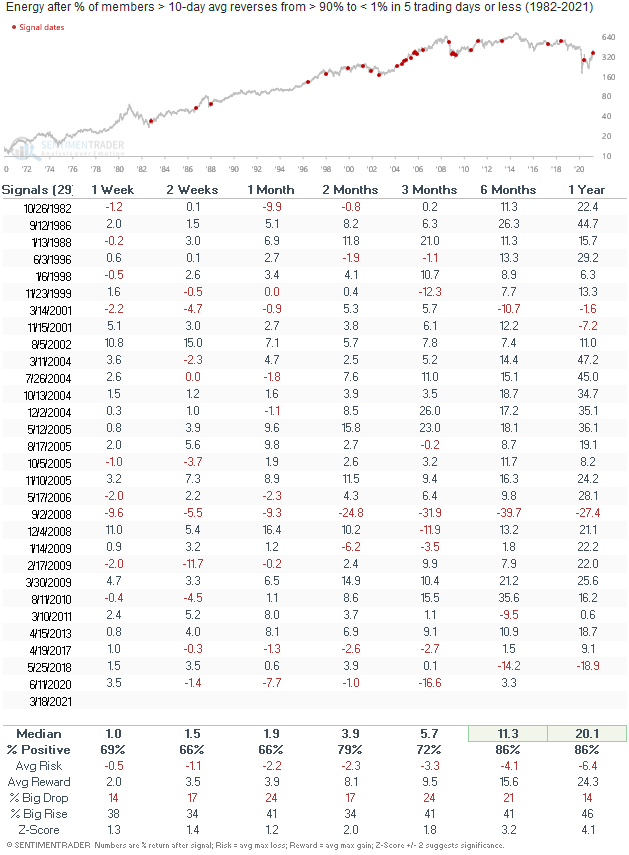
Percentage of Issues above the 10-Day Moving Overbought to Oversold

The reversal this week from an overbought to oversold condition for the percentage of members above the 10-day moving average occurred in a short period of time. I show a reversal from greater than 95% to less than 1% in 5 days. Let's drop the overbought threshold to 90% and keep the other parameters to see what happens to energy stocks when that setup has occurred in the past. I did not include the percentage of members above the 200-day moving average in this study. As the table below shows, performance looks good even with the quick move from overbought to oversold. 

Let's look at some mean reversion models that could signal that the energy group's corrective action is reversing course.

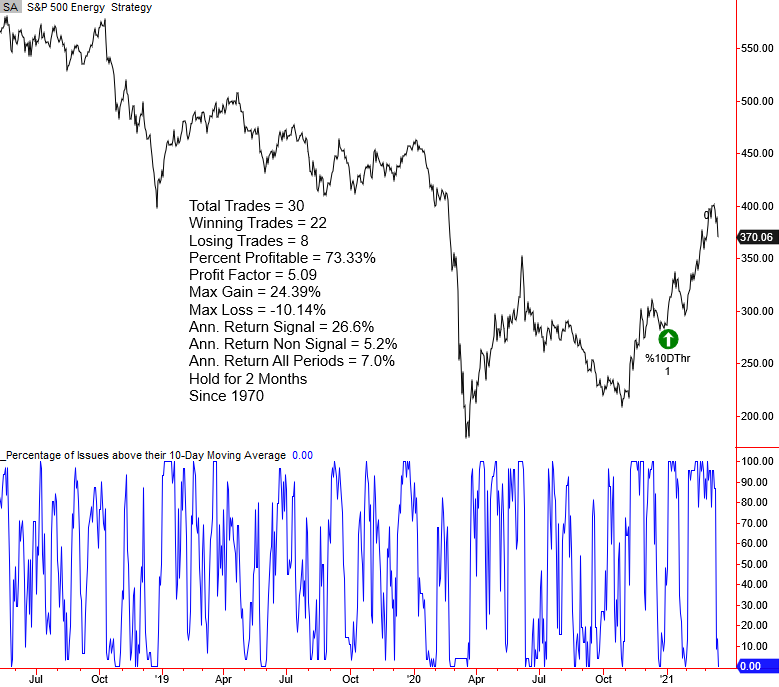
Percentage of Issues above the 10-Day Moving Average Oversold to Overbought Signal

The model in the following chart uses the same technique as the previous study but reverses the scenario. It seeks to identify instances when the percentage of issues above the 10-day moving average cycles from oversold to overbought in a user-defined number of days or less. 


Percentage of Issues Below the Lower Bollinger Band Buy Signal

The model in the following chart seeks to identify instances when the percentage of energy issues trading below their respective lower Bollinger Band cycles from a high percentage to a low percentage and Index momentum turns positive.

Conclusion: The corrective action in energy has moved the group to a short-term oversold condition in a strong uptrend. I never want to catch a falling knife, so I'll be monitoring several models for signals that would suggest that the uptrend is resuming.  

Sorry, you don't have access to this report

Upgrade your subscription plan to get access
Go to Dasboard
DATA &
TECHnologies
IndicatorEdge
‍
BackTestEdge
‍
Other Tools
‍
DataEdge API
RESEARCH
reports
Research Solution
‍
Reports Library
‍
actionable
Strategies
Trading Strategies
‍
Smart Stock Scanner
‍
FREE
RESOUrCES
Simple Backtest
Calculator
Simple Seasonality
Calculator
The Kelly Criterion
Calculator
Sentiment Geo Map
‍
Public Research Reports
‍
Free Webinar
COMPANY
‍
About
‍
Meet our Team
‍
In the News
‍
Testimonials
‍
Client Success Stories
Pricing
Bundle pricing
‍
Announcements
‍
FAQ
© 2024 Sundial Capital Research Inc. All rights reserved.
Setsail Marketing
TermsPrivacyAffiliate Program
Risk Disclosure: Futures and forex trading contains substantial risk and is not for every investor. An investor could potentially lose all or more than the initial investment. Risk capital is money that can be lost without jeopardizing ones’ financial security or life style. Only risk capital should be used for trading and only those with sufficient risk capital should consider trading. Past performance is not necessarily indicative of future results.

Hypothetical Performance Disclosure: Hypothetical performance results have many inherent limitations, some of which are described below. No representation is being made that any account will or is likely to achieve profits or losses similar to those shown; in fact, there are frequently sharp differences between hypothetical performance results and the actual results subsequently achieved by any particular trading program. One of the limitations of hypothetical performance results is that they are generally prepared with the benefit of hindsight. In addition, hypothetical trading does not involve financial risk, and no hypothetical trading record can completely account for the impact of financial risk of actual trading. for example, the ability to withstand losses or to adhere to a particular trading program in spite of trading losses are material points which can also adversely affect actual trading results. There are numerous other factors related to the markets in general or to the implementation of any specific trading program which cannot be fully accounted for in the preparation of hypothetical performance results and all which can adversely affect trading results.

Testimonial Disclosure: Testimonials appearing on this website may not be representative of other clients or customers and is not a guarantee of future performance or success.