Data &
Technology
Research
Reports
Report Solutions
Reports Library
Actionable
Strategies
Free
Resources
Simple Backtest Calculator
Simple Seasonality Calculator
The Kelly Criterion Calculator
Sentiment Geo Map
Public Research Reports
Free Webinar
Pricing
Company
About
Meet Our Team
In the News
Testimonials
Client Success Stories
Contact
Log inLoginSign up
< BACK TO ALL REPORTS

Energy stocks have recaptured their long-term uptrends

Dean Christians
2022-08-24
S&P 500 energy sector stocks trading above their 200-day moving average reversed from fewer than 30% to more than 90%. After similar long-term breadth-based reversals, the sector was higher 86% of the time.

Key points:

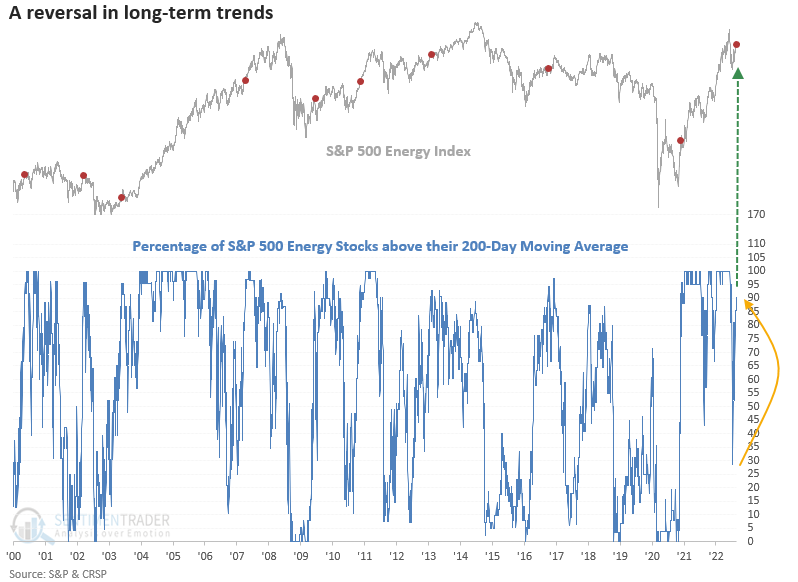
  • More than 90% of S&P 500 energy stocks are now above their 200-day average
  • The broad-based participation occurred after fewer than 30% closed above their average
  • After similar reversals, the S&P 500 energy sector was higher 86% of the time

Energy stocks have recaptured their long-term uptrends 

After dropping over 20% in seven days, one of the swiftest bear markets in history, the energy sector has reversed course. It now looks poised to reassert itself as a market leader. 

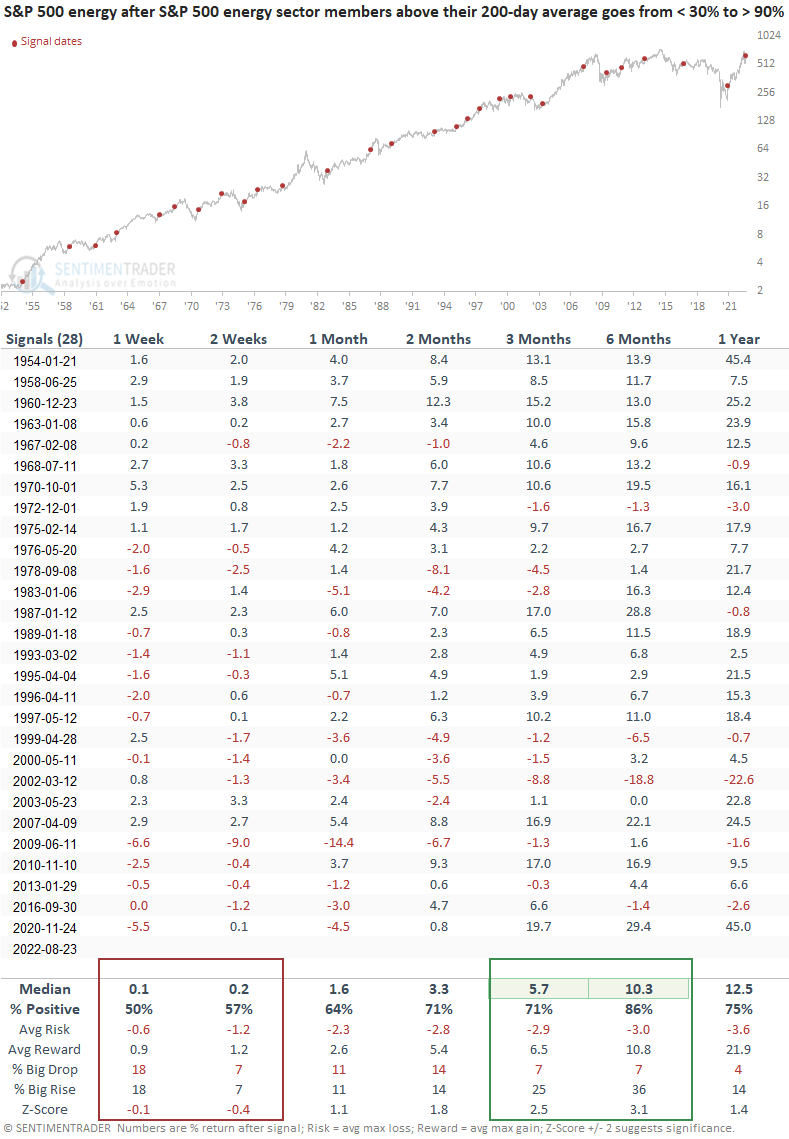
Let's assess the S&P 500 energy sector outlook when the number of stocks trading above their 200-day moving average reverses from < 30% to > 90%.

Similar trend reversals preceded positive returns

A reversal in long-term uptrends looks bullish across medium and long-term time frames with significant z-scores in the three and six-month windows. Besides March 2002, drawdowns were relatively benign across the long-duration time frames. The near-term looks mixed, especially more recent signals.

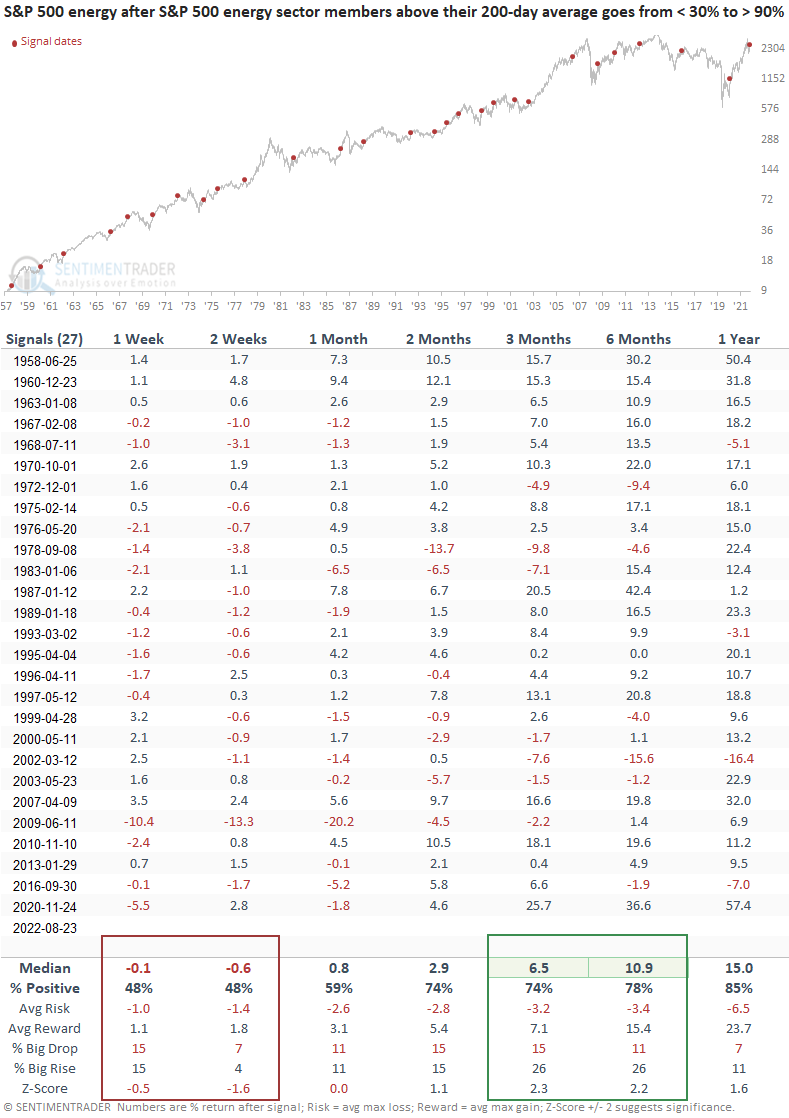
With the ability to invest in a market-capitalization or equal-weighted index methodology via sector ETFs, let's apply the signals to the equal-weighted version of the S&P 500 energy sector. The return profile looks similar. However, the near-term results look weaker, whereas the long-term windows show slightly higher returns when compared to the cap-weighted version.  

The equal-weighted outlook table contains one less signal.

Relative trends for the energy sector look constructive

S&P 500 energy sector stocks outperforming the S&P 500 on a rolling 21-day basis fell to zero as recently as mid-July. As of Monday, 100% of the energy sector stocks are now outperforming the world's most watched benchmark.

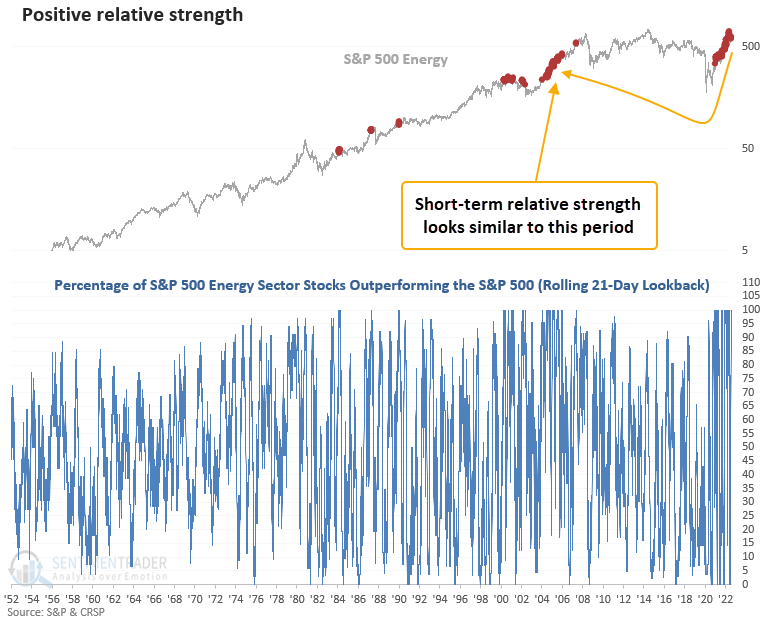
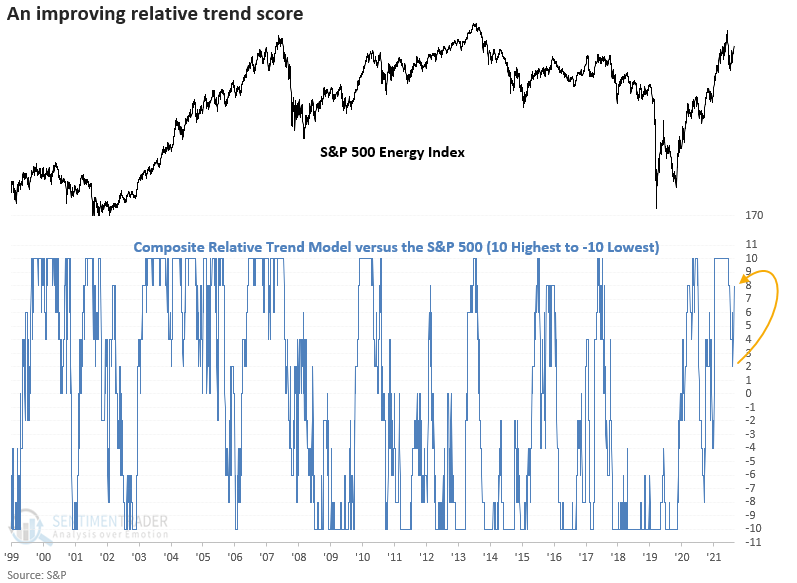
Suppose I compare the S&P 500 energy sector to the S&P 500 using a composite containing ten trend-following indicators. In that case, the model shows a reversal from a score of two to eight. So, a broad measure that uses a diverse set of duration inputs to measure trend strength or weakness shows an improving relative profile.

What the research tells us...

The energy sector has been a market leader for the better part of the last two years. After a gut-wrenching 20% decline in a matter of days, long-term participation trends have reversed from fewer than 30% of stocks trading above their 200-day average to more than 90%. The recovery in absolute trends is also accompanied by improving relative trends, which is always an important factor when investing in a sector.

Sorry, you don't have access to this report

Upgrade your subscription plan to get access
Go to Dasboard
DATA &
TECHnologies
IndicatorEdge
‍
BackTestEdge
‍
Other Tools
‍
DataEdge API
RESEARCH
reports
Research Solution
‍
Reports Library
‍
actionable
Strategies
Trading Strategies
‍
Smart Stock Scanner
‍
FREE
RESOUrCES
Simple Backtest
Calculator
Simple Seasonality
Calculator
The Kelly Criterion
Calculator
Sentiment Geo Map
‍
Public Research Reports
‍
Free Webinar
COMPANY
‍
About
‍
Meet our Team
‍
In the News
‍
Testimonials
‍
Client Success Stories
Pricing
Bundle pricing
‍
Announcements
‍
FAQ
© 2024 Sundial Capital Research Inc. All rights reserved.
Setsail Marketing
TermsPrivacyAffiliate Program
Risk Disclosure: Futures and forex trading contains substantial risk and is not for every investor. An investor could potentially lose all or more than the initial investment. Risk capital is money that can be lost without jeopardizing ones’ financial security or life style. Only risk capital should be used for trading and only those with sufficient risk capital should consider trading. Past performance is not necessarily indicative of future results.

Hypothetical Performance Disclosure: Hypothetical performance results have many inherent limitations, some of which are described below. No representation is being made that any account will or is likely to achieve profits or losses similar to those shown; in fact, there are frequently sharp differences between hypothetical performance results and the actual results subsequently achieved by any particular trading program. One of the limitations of hypothetical performance results is that they are generally prepared with the benefit of hindsight. In addition, hypothetical trading does not involve financial risk, and no hypothetical trading record can completely account for the impact of financial risk of actual trading. for example, the ability to withstand losses or to adhere to a particular trading program in spite of trading losses are material points which can also adversely affect actual trading results. There are numerous other factors related to the markets in general or to the implementation of any specific trading program which cannot be fully accounted for in the preparation of hypothetical performance results and all which can adversely affect trading results.

Testimonial Disclosure: Testimonials appearing on this website may not be representative of other clients or customers and is not a guarantee of future performance or success.