Data &
Technology
Research
Reports
Report Solutions
Reports Library
Actionable
Strategies
Free
Resources
Simple Backtest Calculator
Simple Seasonality Calculator
The Kelly Criterion Calculator
Sentiment Geo Map
Public Research Reports
Free Webinar
Pricing
Company
About
Meet Our Team
In the News
Testimonials
Client Success Stories
Contact
Log inLoginSign up
< BACK TO ALL REPORTS

Energy sector on cusp of becoming golden

Jason Goepfert
2020-12-23
For the first time in 2 years, the energy sector is on the cusp of seeing its 50-day moving average cross above the 200-day average. This would end one of the longest downtrends since 1926, and the ends of other prolonged downtrends had a tendency to see rising prices over the longer-term.

Earlier this fall, we saw that the energy sector had become the most-hated of all time and firms were cutting workers and dividends, before there were finally some signs of an uptick.

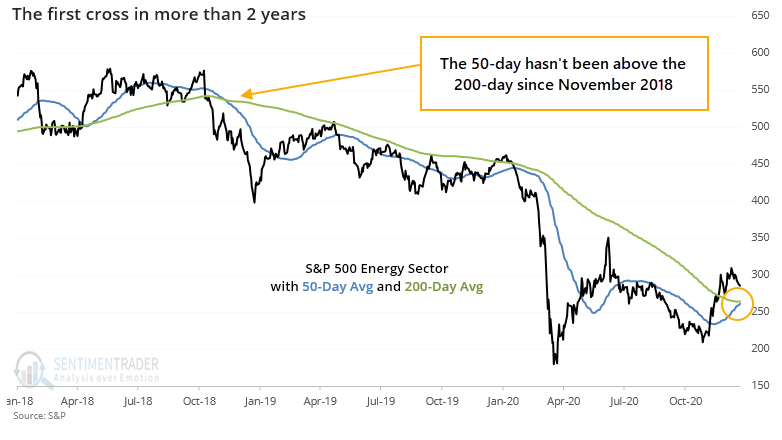
Many of these stocks staged a furious rally then spent recent weeks digesting those gains. Even so, it's been enough of a change in trend that the S&P 500 Energy Sector's 50-day moving average is oh-so-close to crossing above the 200-day average. It would be the first time in more than 2 years.

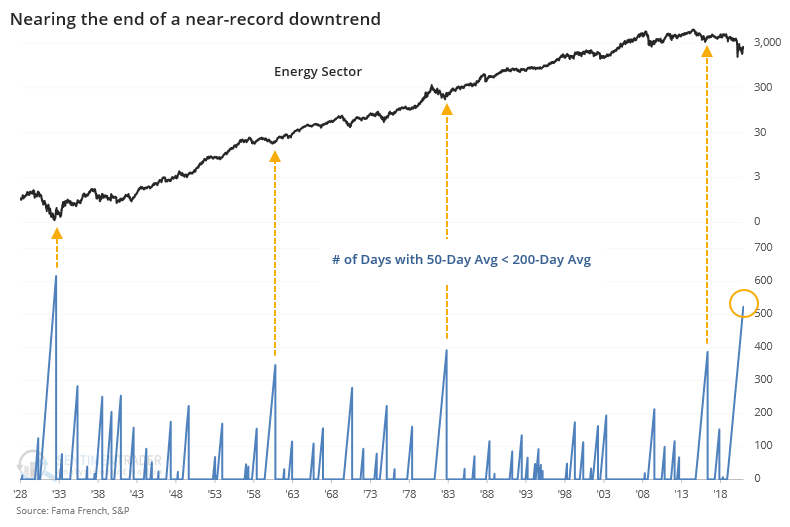
When this finally does cross, it will end the 2nd-longest streak of being in a downtrend since 1926.

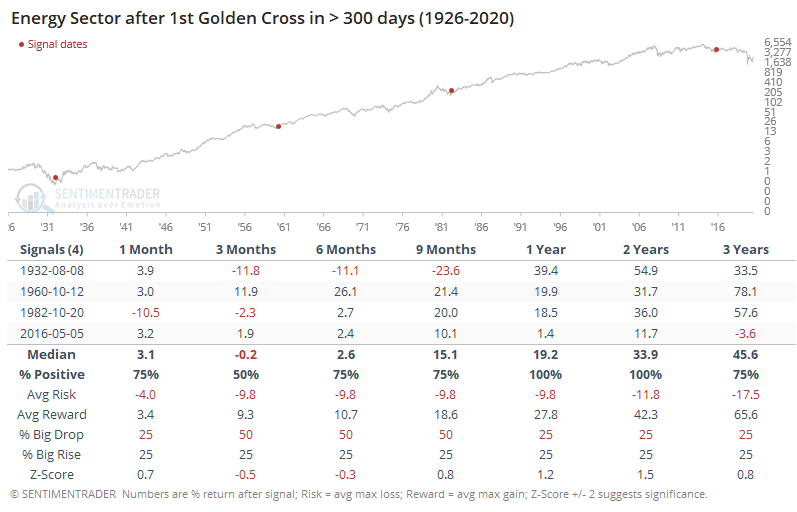
When we look at long-term returns after the ends of such long streaks, there were further gains every time during the next 1-2 years. It was volatile, but the sector enjoyed an average gain of more than 42% at its best point during the next 2 years.

If we look at the ends of less protracted downtrends, then returns were still quite good. These are looking at shorter time frames.

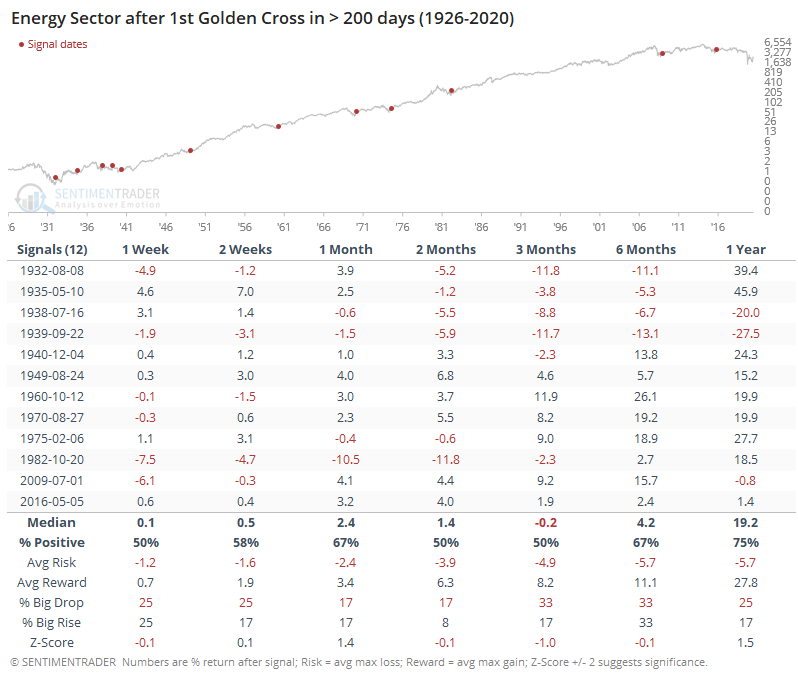
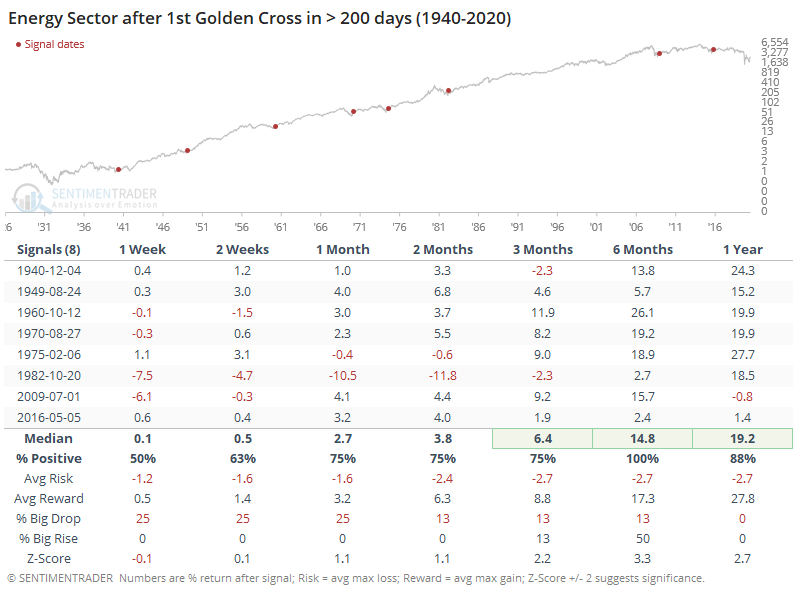
Most of the losses occurred in the 1930s, so if we cheat a bit and start at 1940, then returns improved significantly, with no losses over the next 6 months and including an impressive risk/reward ratio. Over the next year, the sector averaged a nearly 28% gain at its best point, versus not even -3% downside at its worst point.

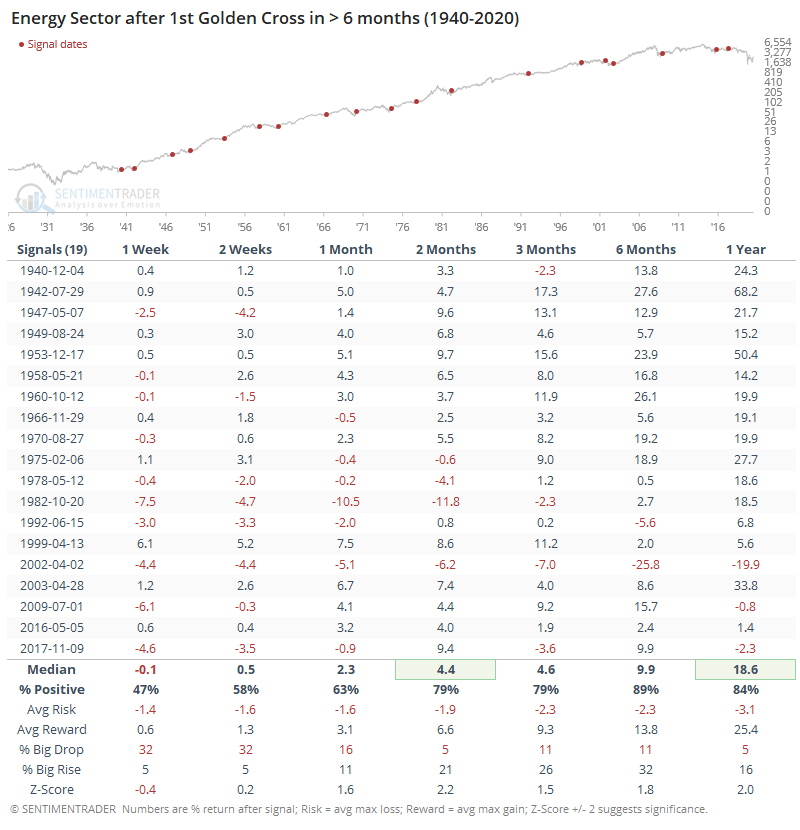
If we relax the parameters even more, with the first moving average cross in 6 months or more, then we can still see a positive bias (since 1940).

It's hard to buy an asset that's hated, especially to a historic degree. There's no telling when conditions are going to morph from horrible to less-horrible. The news flow won't help, because it's almost always the worst at the point of maximum pessimism, and there is great skepticism when the asset finally shows signs of life. We're seeing that now in energy, as well.

The conditions were ripe for a turn this fall, and now some trend measures are starting to suggest that perhaps it's sustainable. This should allow more trend-followers to hop on board and those who missed the initial surge to finally see their opportunity.

Sorry, you don't have access to this report

Upgrade your subscription plan to get access
Go to Dasboard
DATA &
TECHnologies
IndicatorEdge
‍
BackTestEdge
‍
Other Tools
‍
DataEdge API
RESEARCH
reports
Research Solution
‍
Reports Library
‍
actionable
Strategies
Trading Strategies
‍
Smart Stock Scanner
‍
FREE
RESOUrCES
Simple Backtest
Calculator
Simple Seasonality
Calculator
The Kelly Criterion
Calculator
Sentiment Geo Map
‍
Public Research Reports
‍
Free Webinar
COMPANY
‍
About
‍
Meet our Team
‍
In the News
‍
Testimonials
‍
Client Success Stories
Pricing
Bundle pricing
‍
Announcements
‍
FAQ
© 2024 Sundial Capital Research Inc. All rights reserved.
Setsail Marketing
TermsPrivacyAffiliate Program
Risk Disclosure: Futures and forex trading contains substantial risk and is not for every investor. An investor could potentially lose all or more than the initial investment. Risk capital is money that can be lost without jeopardizing ones’ financial security or life style. Only risk capital should be used for trading and only those with sufficient risk capital should consider trading. Past performance is not necessarily indicative of future results.

Hypothetical Performance Disclosure: Hypothetical performance results have many inherent limitations, some of which are described below. No representation is being made that any account will or is likely to achieve profits or losses similar to those shown; in fact, there are frequently sharp differences between hypothetical performance results and the actual results subsequently achieved by any particular trading program. One of the limitations of hypothetical performance results is that they are generally prepared with the benefit of hindsight. In addition, hypothetical trading does not involve financial risk, and no hypothetical trading record can completely account for the impact of financial risk of actual trading. for example, the ability to withstand losses or to adhere to a particular trading program in spite of trading losses are material points which can also adversely affect actual trading results. There are numerous other factors related to the markets in general or to the implementation of any specific trading program which cannot be fully accounted for in the preparation of hypothetical performance results and all which can adversely affect trading results.

Testimonial Disclosure: Testimonials appearing on this website may not be representative of other clients or customers and is not a guarantee of future performance or success.