Data &
Technology
Research
Reports
Report Solutions
Reports Library
Actionable
Strategies
Free
Resources
Simple Backtest Calculator
Simple Seasonality Calculator
The Kelly Criterion Calculator
Sentiment Geo Map
Public Research Reports
Free Webinar
Pricing
Company
About
Meet Our Team
In the News
Testimonials
Client Success Stories
Contact
Log inLoginSign up
< BACK TO ALL REPORTS

Energy is the worst sector, ever

Jason Goepfert
2020-10-30
Losses that energy investors have suffered over the past several years are the worst for any sector, ever, going back to 1928.

Energy has been one of the most consistently losing sectors out of any sector since 1928. It's also suffered one of the largest drawdowns. Looking at each sector's maximum loss from its latest multi-year peak can be instructive, but it's better to look at it relative to the drawdown of the broader S&P 500 index.

Below, we can see two sectors' maximum decline from a 3-year high, minus the drawdown in the S&P 500 index. So, it shows losses that investors suffered beyond what they would have been exposed to in the broader market.

Energy drawdown relative to broader market

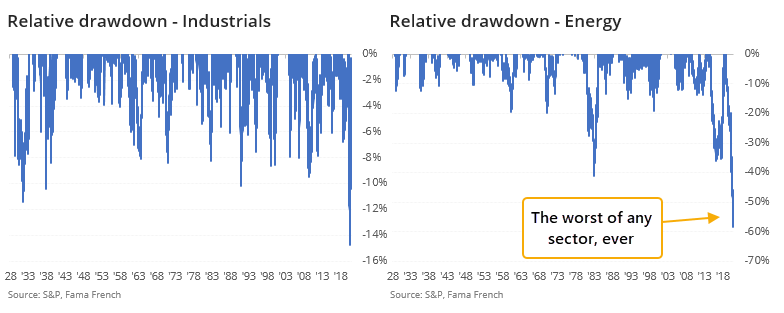
Going back to 1928, it has been unusual to see any sector, at any point, to lose 35% more from a high than did the broader market.

 The current drawdown in energy is now about 60% more than the S&P's, by far the worst of any sector in history. It exceeds the relative losses in tech after the internet bubble burst and devastation in financials following the Great Financial Crisis. 


What else is happening

These are topics we explored in our most recent research. For immediate access with no obligation, sign up for a 30-day free trial now.

  • All sectors' drawdowns relative to the S&P 500 going back to 1928
  • Zoomed-in charts for each sector that reached a certain threshold, and their future relative performance
  • What happens after the S&P 500 becomes oversold for the 1st time in months
  • More than 10% of S&P 500 stocks are also hitting oversold levels
  • Gold is probably facing its first negative quarter in a year

Stat Box

The Relative Strength Index (RSI) is a popular tool among technical analysts. It computes a stock or index's momentum of price gains or losses over (usually) a 14-day time span. A 9-day span is also popular. There are different ways of interpreting it, with a common one being that a reading over 70 suggests a market is overbought, and a reading below 30 is oversold. For the S&P 500, its RSI just fell below 30 for the 1st time in more than 6 months. This has happened 22 times since 1928, and over the next 3 months, the S&P never showed a loss greater than -2%.

Sentiment from other perspectives

We don't necessarily agree with everything posted here - some of our work might directly contradict it - but it's often worth knowing what others are watching.

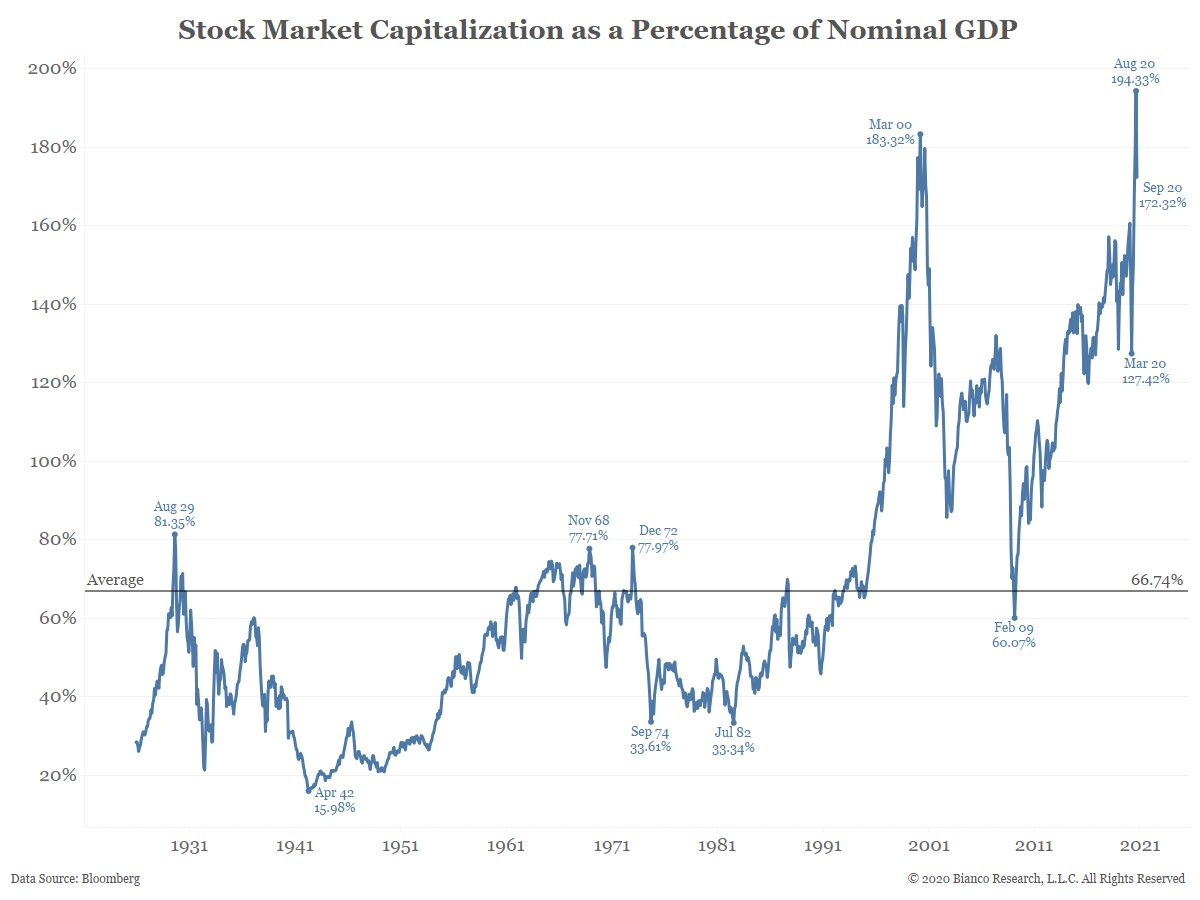
1. With an uptick in GDP, stocks' value versus the economy ticked down but is still at a historic high - Bianco Research

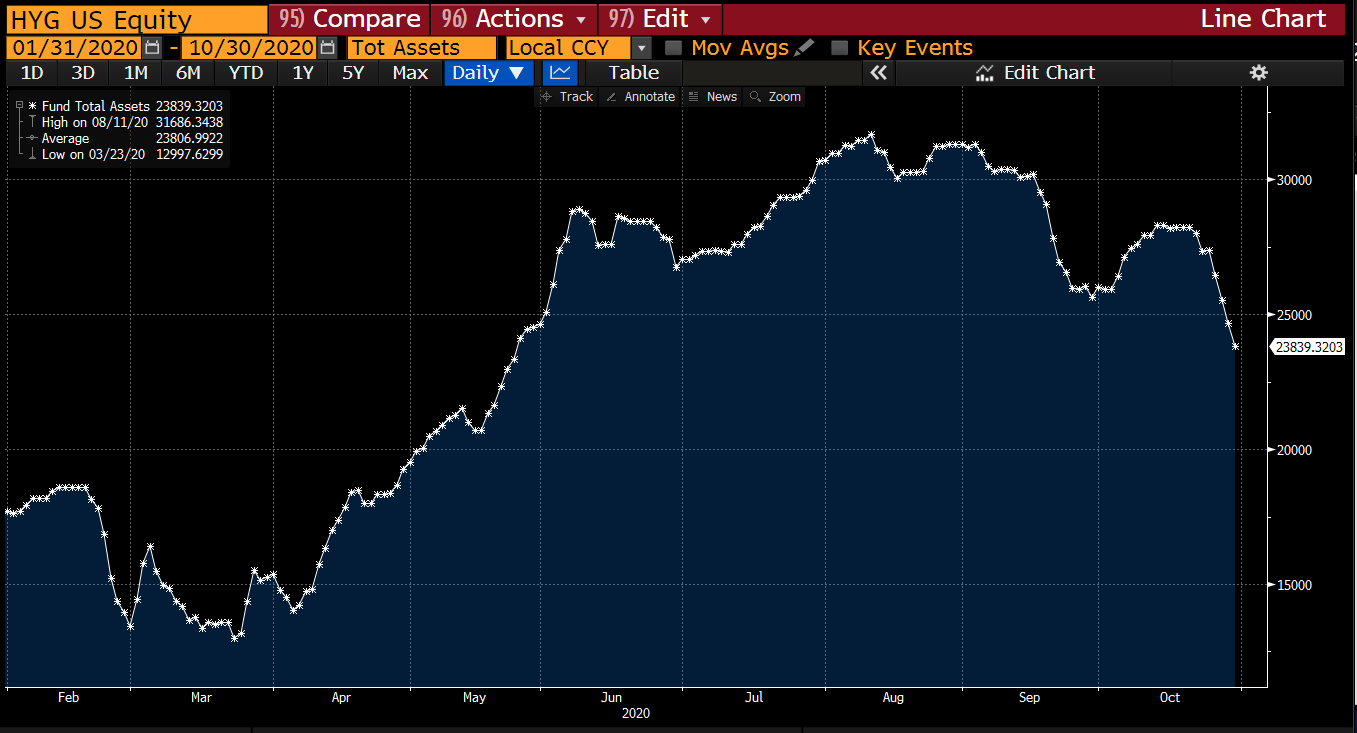
2. Junk bond traders are hightailing it out of their main fund, HYG - Bloomberg

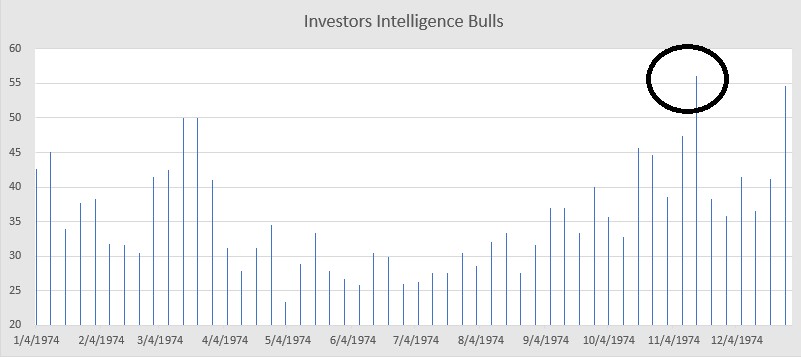
3. Newsletter writers have been pretty, pretty optimistic - Helene Meisler via Realmoney


Investors are confident and volatility is returning. In the video below, Brad Lamensdorf of Active Alts shows why investors may want to freshen up their portfolios for the coming months.

DATA &
TECHnologies
IndicatorEdge
‍
BackTestEdge
‍
Other Tools
‍
DataEdge API
RESEARCH
reports
Research Solution
‍
Reports Library
‍
actionable
Strategies
Trading Strategies
‍
Smart Stock Scanner
‍
FREE
RESOUrCES
Simple Backtest
Calculator
Simple Seasonality
Calculator
The Kelly Criterion
Calculator
Sentiment Geo Map
‍
Public Research Reports
‍
Free Webinar
COMPANY
‍
About
‍
Meet our Team
‍
In the News
‍
Testimonials
‍
Client Success Stories
Pricing
Bundle pricing
‍
Announcements
‍
FAQ
© 2024 Sundial Capital Research Inc. All rights reserved.
Setsail Marketing
TermsPrivacyAffiliate Program
Risk Disclosure: Futures and forex trading contains substantial risk and is not for every investor. An investor could potentially lose all or more than the initial investment. Risk capital is money that can be lost without jeopardizing ones’ financial security or life style. Only risk capital should be used for trading and only those with sufficient risk capital should consider trading. Past performance is not necessarily indicative of future results.

Hypothetical Performance Disclosure: Hypothetical performance results have many inherent limitations, some of which are described below. No representation is being made that any account will or is likely to achieve profits or losses similar to those shown; in fact, there are frequently sharp differences between hypothetical performance results and the actual results subsequently achieved by any particular trading program. One of the limitations of hypothetical performance results is that they are generally prepared with the benefit of hindsight. In addition, hypothetical trading does not involve financial risk, and no hypothetical trading record can completely account for the impact of financial risk of actual trading. for example, the ability to withstand losses or to adhere to a particular trading program in spite of trading losses are material points which can also adversely affect actual trading results. There are numerous other factors related to the markets in general or to the implementation of any specific trading program which cannot be fully accounted for in the preparation of hypothetical performance results and all which can adversely affect trading results.

Testimonial Disclosure: Testimonials appearing on this website may not be representative of other clients or customers and is not a guarantee of future performance or success.