
Energies at the Crossroads

The four primary energy commodity markets (listed below) have been on something of a tear lately:
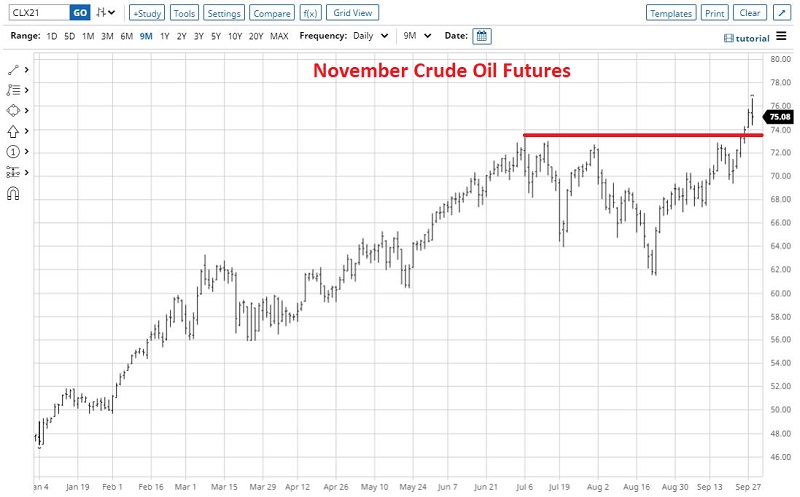
- Crude Oil
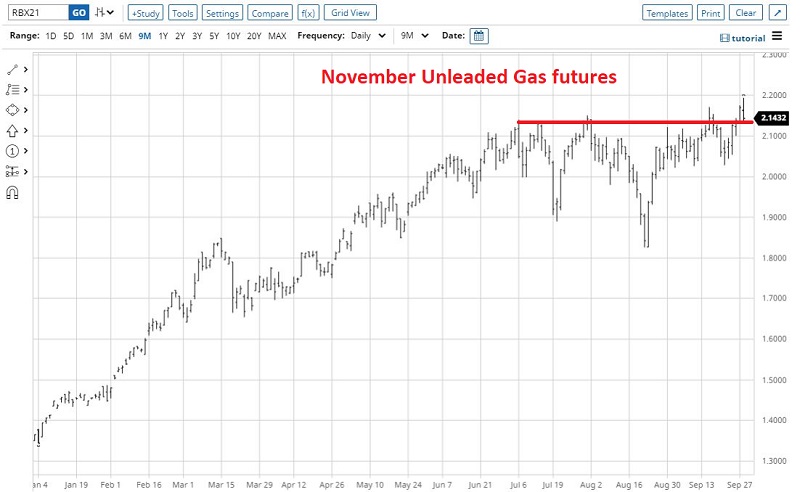
- Unleaded Gas
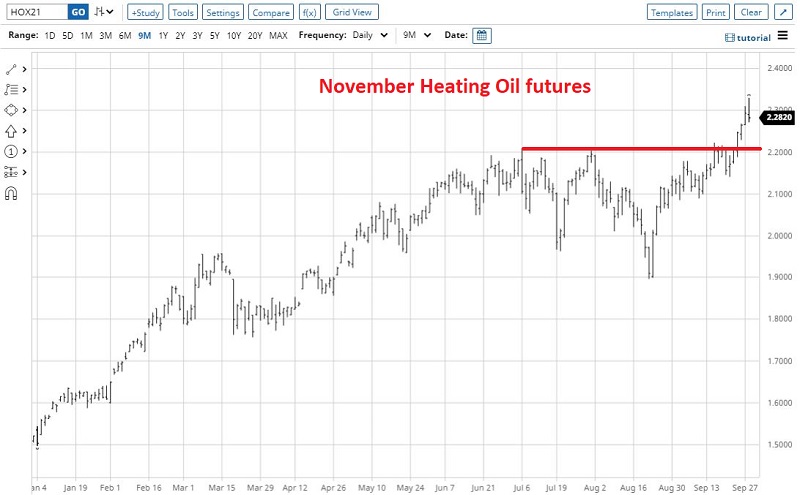
- Heating Oil
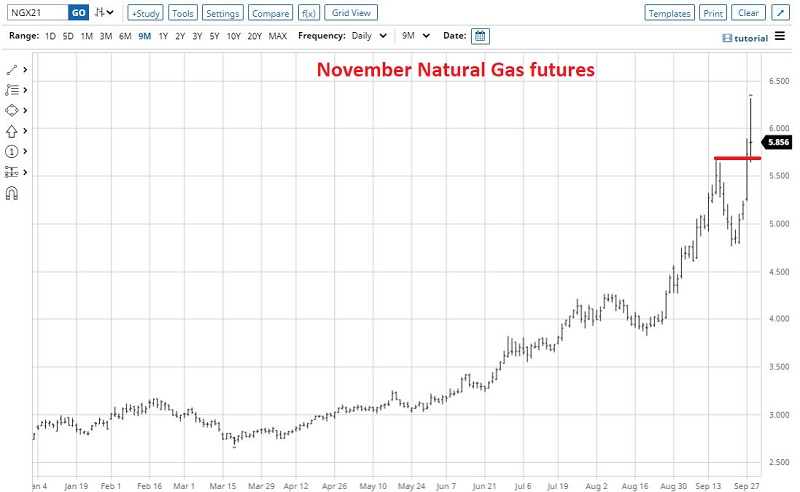
- Natural Gas
3 of these markets can be traded by non-futures traders using ETFs:
- Crude Oil (ETF tickers USO, DBO, and USL)
- Unleaded Gas (ETF ticker UGA)
- Natural Gas (ETF ticker UNG)
WHAT MATTERS
All have broken out to the upside. The question for each market is:
- Will it follow through?
- Or will it break back down through its recent breakout level?
These are important questions on several levels. In a nutshell:
- In the right circumstance, there are few things more bullish than a breakout above prior resistance (which can then be followed by a massive rally)
- On the flip side, a breakout that fails to hold and which reverses back below previous resistance can be one of the most bearish developments (essentially, it implies that the last buyer has piled in and there is no one left to push the price higher)
In the case of energy products, there are potential inflation implications. When energy prices soar, it strongly impacts the price of anything that needs to be manufactured (since the lights have to stay on and the machinery needs to keep running at the plant) and/or shipped - which is just about everything.
So, to spell it out:
- If energy commodity prices break out to the upside and run to sharply higher levels, that would make a strong argument for inflation staying high for an extended period of time into the future
- On the other hand, if energy commodity prices fail to maintain a breakout and start to head lower, this would suggest the possibility that inflation really is "transitory," as the folks at the Fed have been telling us all along
SEASONALITY AS A STARTING POINT
I will not pretend that I can predict how the various energy products will perform in the short, intermediate, or long term. I do, however, pay attention to seasonal trends. As you can see in the chart below, each of the four commodity markets listed earlier is in the middle of - or are soon entering - a period of, ahem, "seasonal significance." Take a close look at the charts below
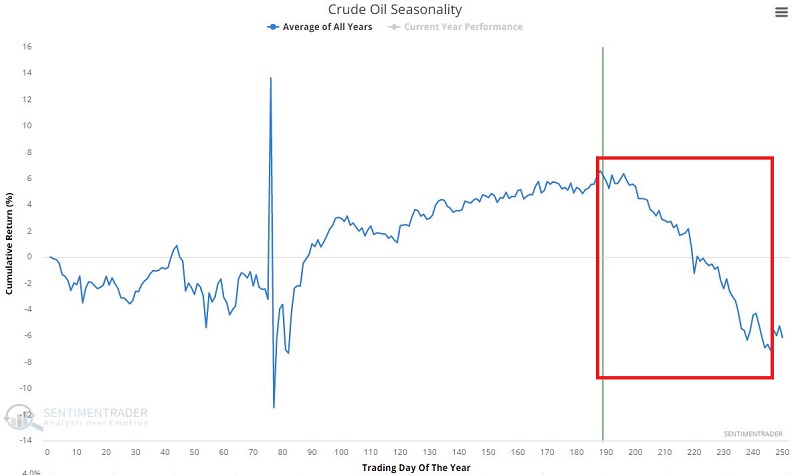
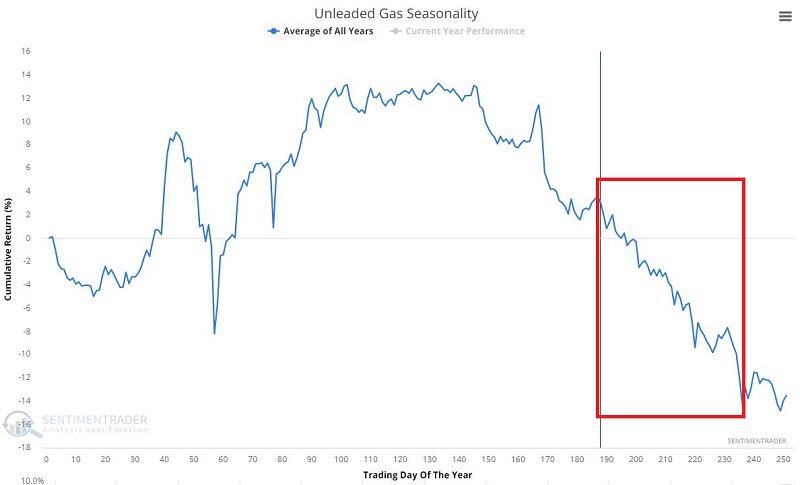
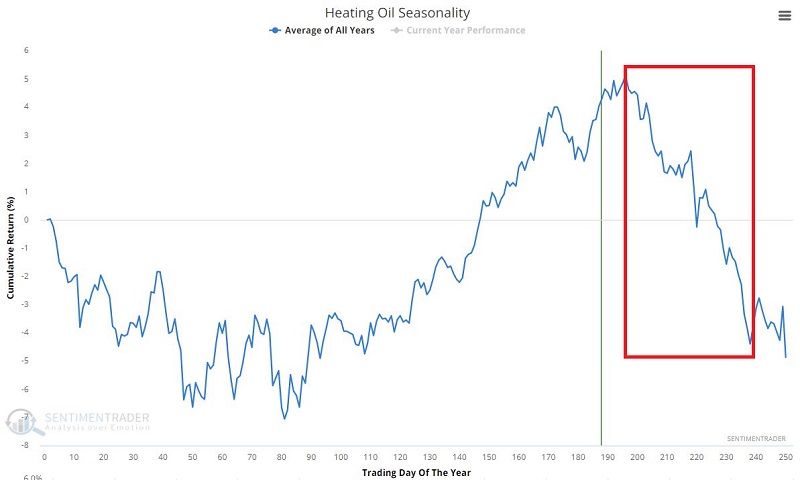
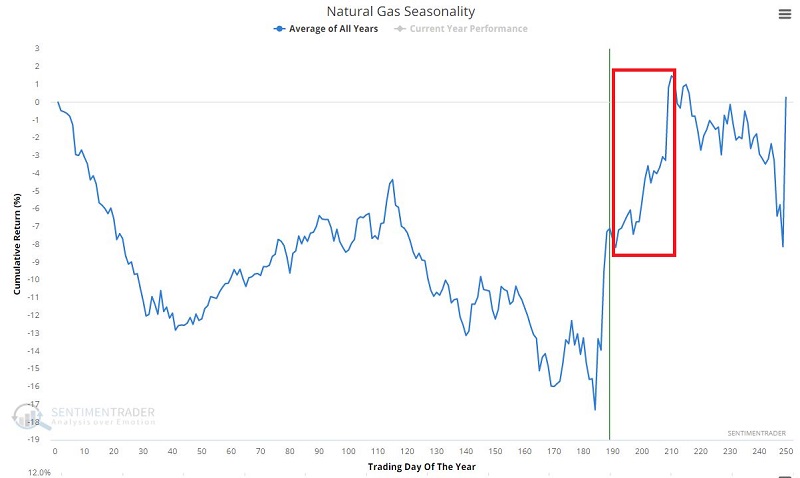
The first thing to remember is that seasonality is "climate, not weather." It tells you what has tended to happen in the past during a given time period. It DOES NOT tell you what IS going to happen this time around.
With the above caveat in mind, note that crude oil, unleaded gas, and heating oil are all facing some extremely unfavorable seasonal headwinds.
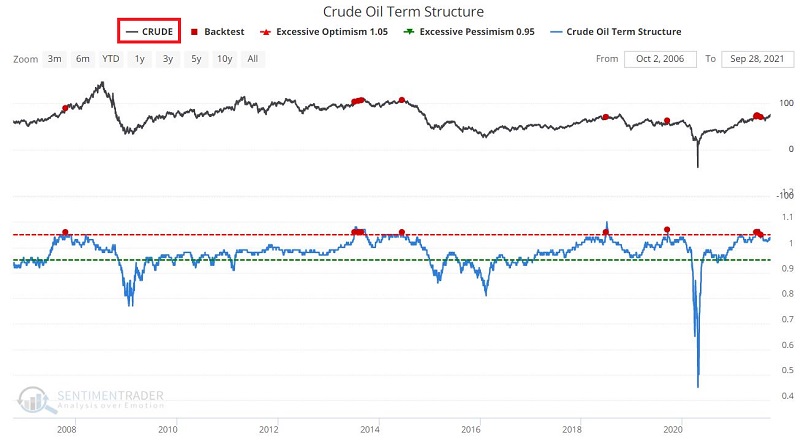
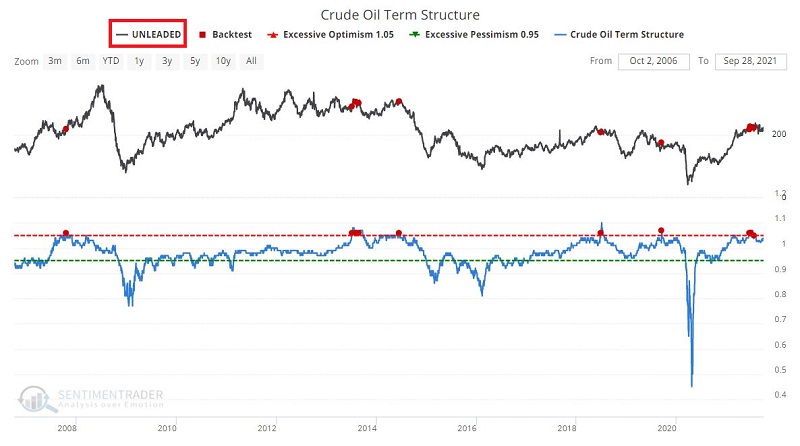
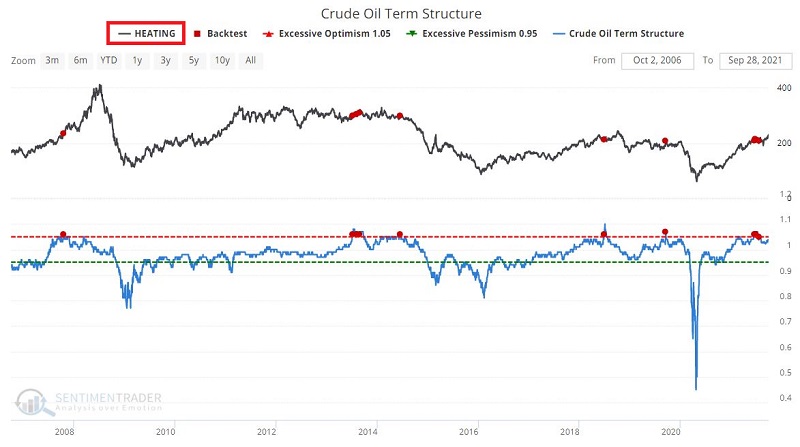
CRUDE OIL TERM STRUCTURE
The term structure of crude oil futures shows the relationship of the near-term futures contract to a further-out contract. If it is above 1.0, then the near-term contract is priced higher than the further-out contract, called backwardation. If below 1.0, then the market is in contango. When it goes into severe contango, that is a sign of stress in the market and has typically only occurred when the crude oil formed a long-term bottom.
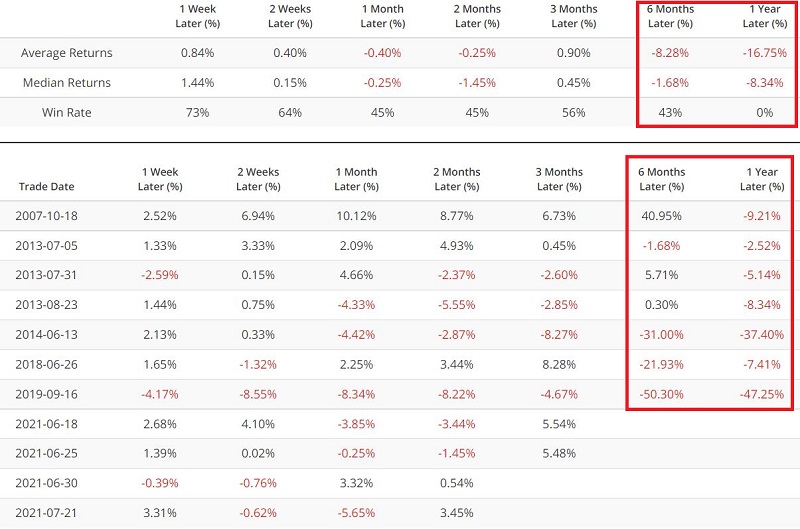
Historically, readings above 1.05 have signaled a less than favorable outlook for energy commodities. If we look at:
- The performance of crude oil starting back into the 1980s
- When Crude Oil Term Structure crossed above 1.05 for the first time in 3 months
- We find roughly 50% winning trade across all time frames (1 week to 1 year)
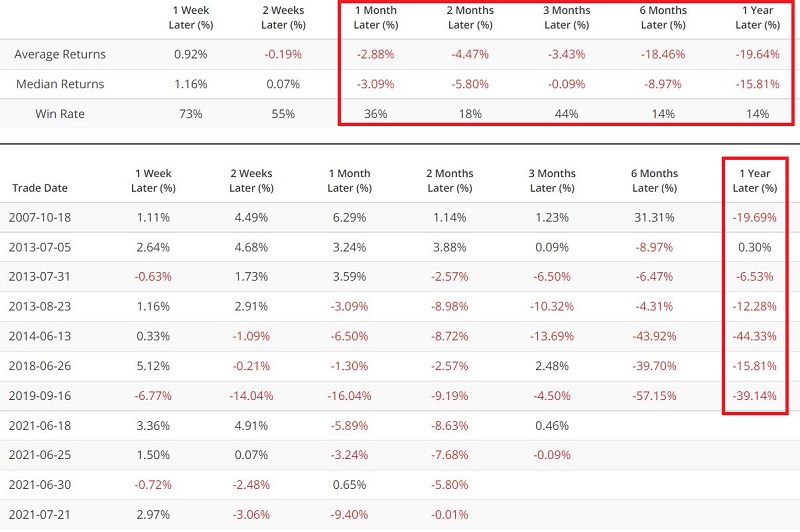
- In the past 15 years, however, results have been decidedly worse
To run the test above using the last 15 years of data, click here. The results for this test appear below.
To run the same test using Unleaded Gas, click here.
To run the same test using Heating Oil, click here.
SUMMARY
Are crude oil, unleaded gas, and heating oil all doomed to decline in the months ahead due to unfavorable seasonality and an unfavorable signal from Crude Oil Term Structure? Not at all. But remember the key points:
If prices remain strong and/or advance to higher levels:
- We could be looking at a major continuation advance for energy prices, so traders should respect the trend (i.e., focus on trading the long side)
- We are likely also looking at a more impactful and potentially long-lasting bout of inflation than we are currently being led to believe
If prices reverse and begin to head lower:
- We could be looking at a major reversal and decline energy in energy prices, so traders should respect the seasonal headwinds (i.e., focus on trading the short side)
- Inflation may turn out to be tamer than so many fear at the moment