
Emerging Markets versus the S&P 500 Index

Key Points
- Intermarket relationships ebb and flow over time
- At times emerging markets outperform the S&P 500 Index and vice versa
- Tracking the relationship trend between these two asset classes can offer investors the opportunity to exceed a buy-and-hold approach.
Emerging Markets versus S&P 500 Index
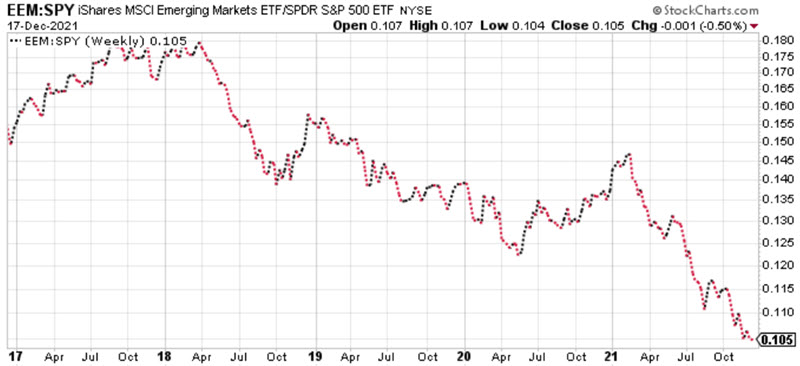
The chart below (courtesy of StockCharts) is a relative strength chart that displays the fluctuations of EEM (iShares MSCI Emerging Markets ETF) relative to the changes of SPY (SPDR S&P 500 ETF Trust). A rising line means EEM is outperforming, and a falling line means SPY is outperforming.
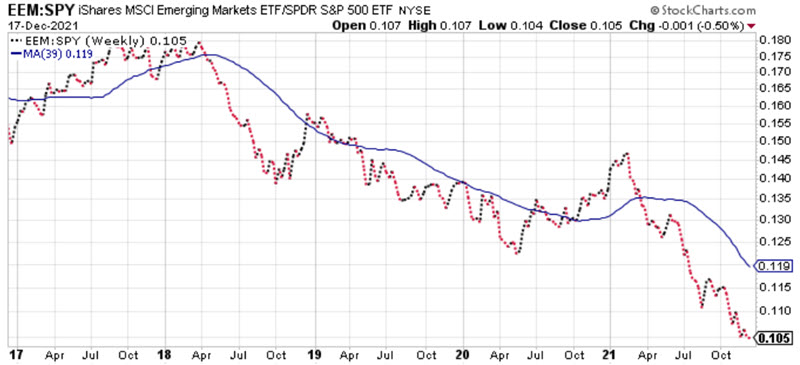
To help identify a trend, we add a 39-week exponential moving average in the chart below. When the dashed line is above the solid line, it means EEM is outperforming, and when the dashed line is below the solid line, it implies SPY is outperforming.
Tracking the relationship over time
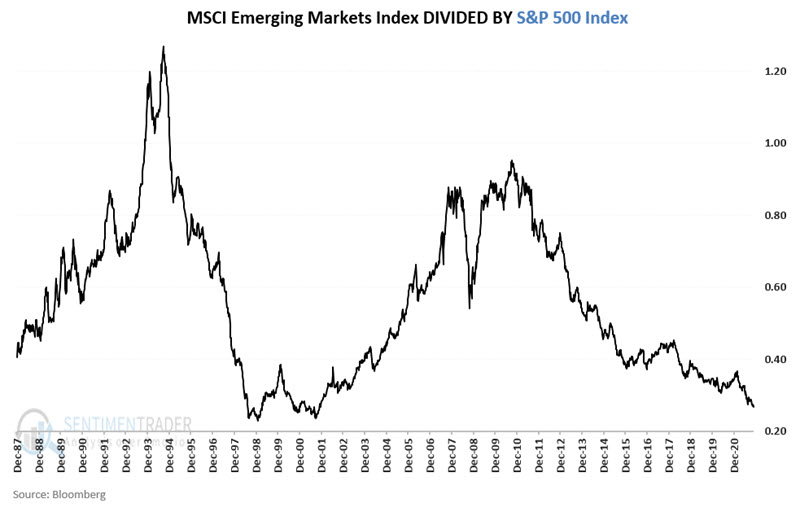
For testing purposes, we will use actual index data weekly. We will use the MSCI Emerging Markets Index (EM) and the S&P 500 Index (SPX). Please note that the ETFs used in the charts above are designed to track these specific indexes. So, a trader without access to index data can use EEM and SPY as a proxy.
The chart below displays the fluctuations in the relationship between EM and SPX since the late 1980s.
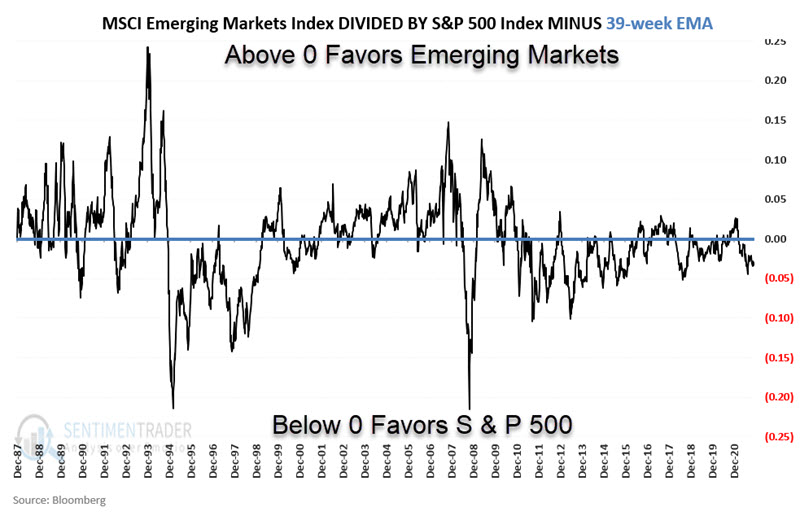
The chart below adds the 39-week exponential moving average to designate the overall trend as rising objectively (favoring EM) or falling (favoring SPX). The chart below shows the difference between the ratio and its moving average.
Favor Emerging Markets only when the trend is positive
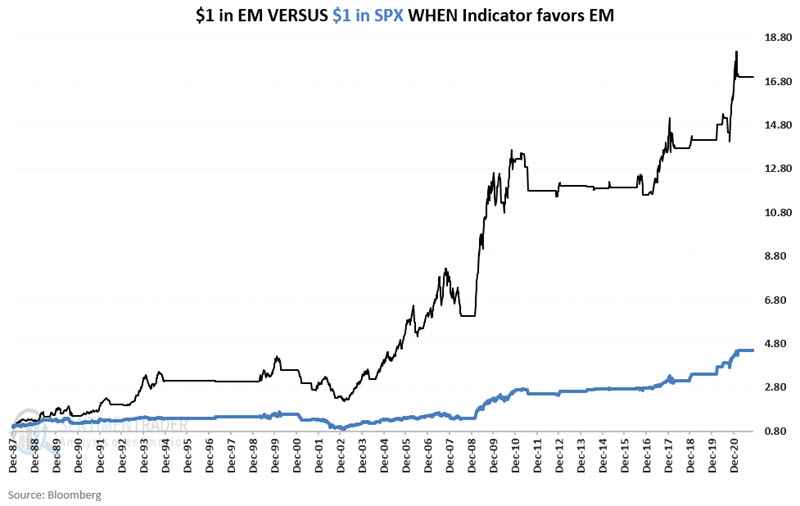
The chart below displays the growth of $1 invested in each index ONLY when the line in the chart above is positive (i.e., favoring EM). The black line displays the growth of $1 invested in Emerging Markets, and the blue line shows the growth of $1 invested in the S&P 500 Index. Through last week, $1 in EM grew to $16.99 while $1 in SPX grew to $4.48.
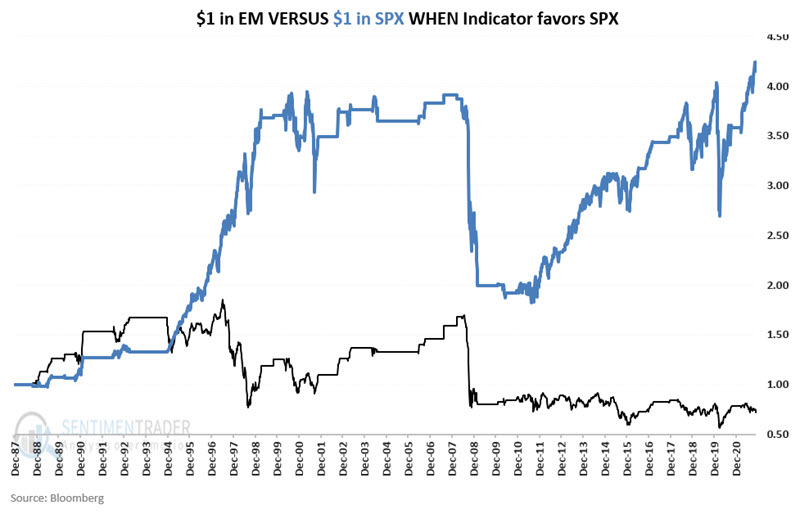
The chart below displays the growth of $1 invested in each index ONLY when the line in the chart above is negative (i.e., favoring EM). Again, the black line displays the growth of $1 invested in Emerging Markets, and the blue line shows the growth of $1 invested in the S&P 500 Index. $1 in EM declined in value to $0.71, while $1 in SPX grew to $4.17.
Putting the two together
For the next test, we will:
- Hold EM if the relative strength line is above its 39-week EMA
- Hold SPX if the relative strength line is below its 39-week EMA
We will refer to this as the "Switching" strategy.
As a baseline, we will also split money evenly between the two indexes and rebalance to a 50/50 split each year's first Friday. We will refer to this as the "Buy/Hold/Rebalance" strategy.
The chart below displays the growth of $1 invested using the Switching strategy versus $1 in the Buy/Hold/Rebalance strategy.
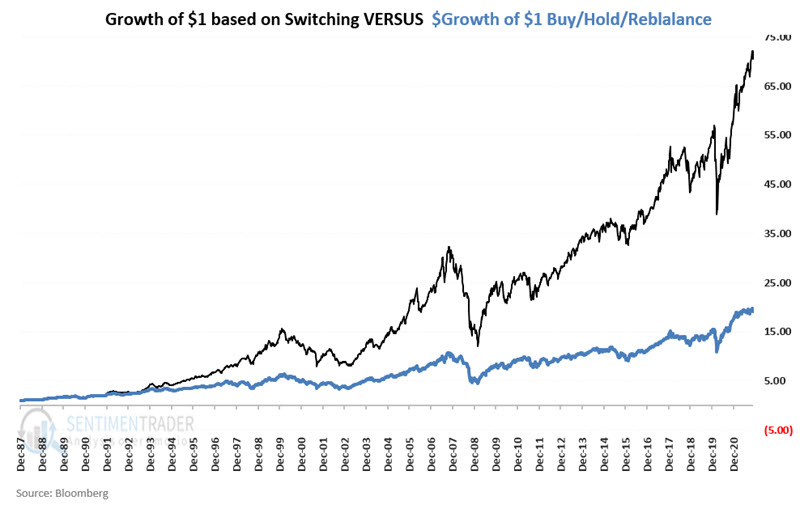
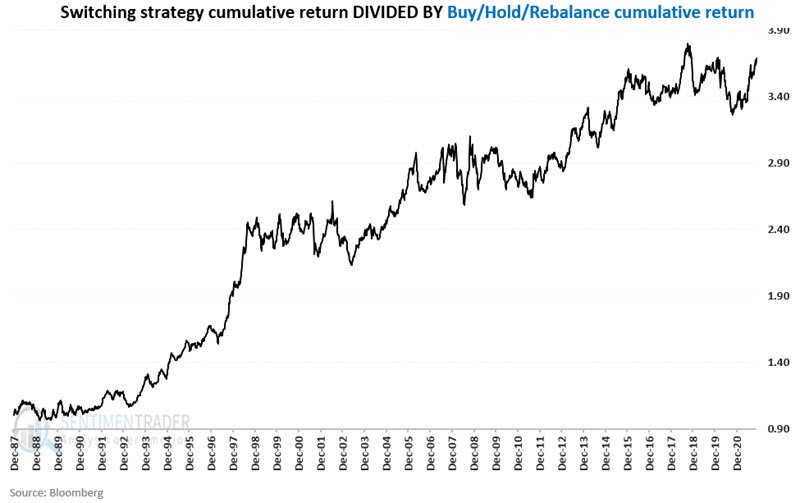
$1 in the Switching strategy grew to $70.91, while $1 in the Buy/Hold/Rebalance strategy grew to $19.08. The Switching strategy outperformed the Buy/Hold/Rebalance strategy by a factor of 3.72-to-1, as shown in the chart below.
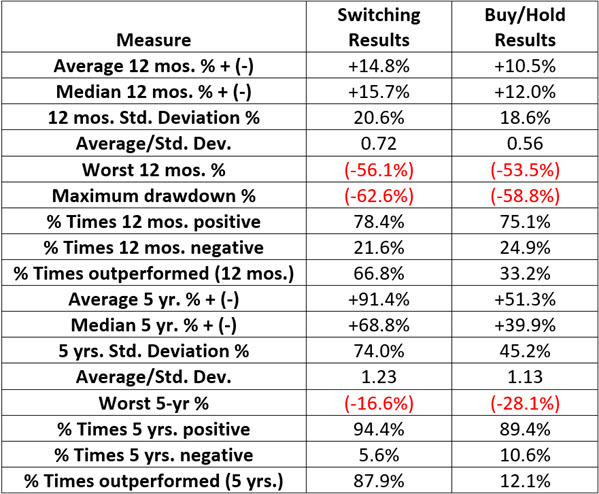
The table below displays a summary of the results for the Switching Strategy versus the Buy/Hold/Rebalance strategy.
Notes on real-world trading
- A trader interested in using this strategy can track the EEM/SPY relationship relative to its 39-week EMA, as shown in the second chart displayed in this article.
- When the dashed line crosses above the 39-week EMA, a trader will buy EEM, and when the dashed line crosses below the 39-week EMA, a trader will buy SPY.
- The Switching strategy is presently in SPY and will remain that way until the dashed line closes a week above the 39-week EMA.
- The Switching strategy presented here is an "always in and fully invested" approach. While strategy results have outperformed buy-and-hold, this is NOT a "low-risk" strategy in any sense of the word. Note the "Worst 12 months" entry in the table above (-56.1%) and the "Maximum drawdown" (-62.6%).
What the research tells us…
The variations in the price swings for emerging markets versus the S&P 500 Index appear to be sufficient to offer an edge to investors who are willing to follow an objective, trend-following approach. While long-term results appear to be quite favorable using the Switching strategy, these returns come with a high degree of volatility and risk associated with them.