
Emerging Markets Mean Reversion Opportunity

On Friday, 10/15/21, two models for emerging market stocks issued a buy signal at the close of trading. In my Monday morning absolute and relative trend updates, I've noted that a few emerging market countries like India and Saudi Arabia look good. However, the weight-of-the-evidence has suggested that one should avoid a broad-based index allocation.
Emerging markets have two adverse factors that are currently weighing on the indexes. The first is a positive dollar trend, which I highlighted in a note on 8/20/21. The second unfavorable factor for emerging markets is monetary tightening by several central banks, which I highlighted in a note on 10/6/21.
Let's review the results for the following models to assess whether we should change our outlook on emerging markets from unfavorable to favorable.
EMERGING MARKET MODEL SIGNALS
- Average True Range Spread Model
- Breadth Composite Model
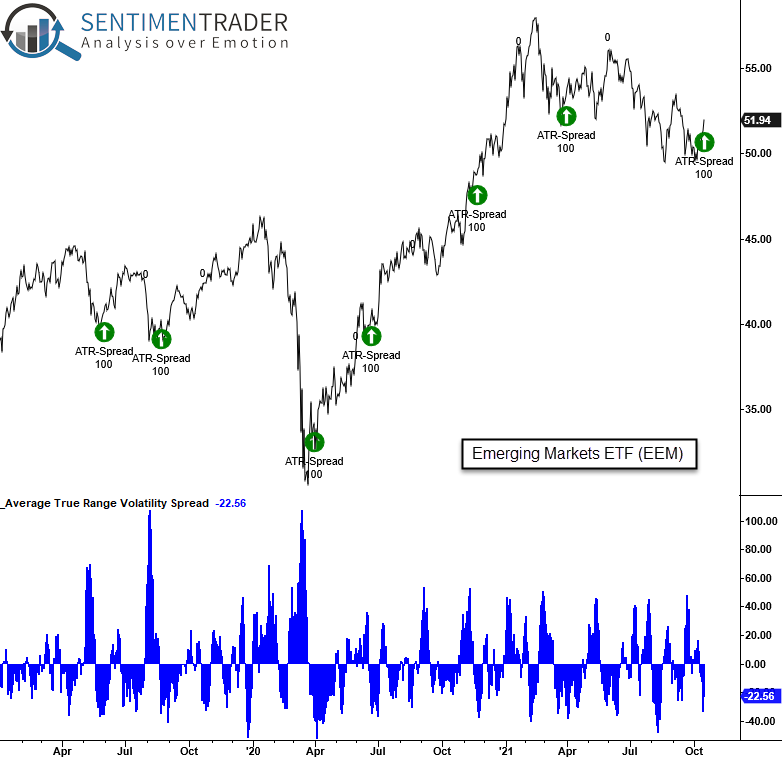
AVERAGE TRUE RANGE SPREAD MODEL
Please click here for the original Average True Range Spread buy signal concept note. The following link contains a second note on the ATR Spread concept. Click here.
AVERAGE TRUE RANGE SPREAD CONCEPT
The average true range spread signal identifies when a stock, ETF/index, or commodity reverses from a period of high volatility to low volatility in a user-defined number of days.
CURRENT DAY CHART
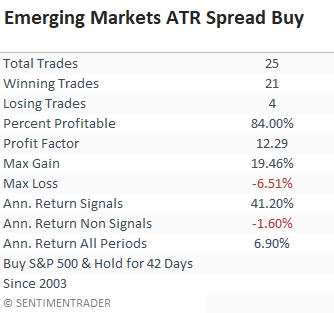
TRADING STATISTICS
The trading statistics in the table below reflect the optimal days-in-trade holding period of 42 days. When I run optimizations for trading signals, I cap the max number of days at 42. i.e., I optimize to find the best DIT holding period between 5 and 42 days.
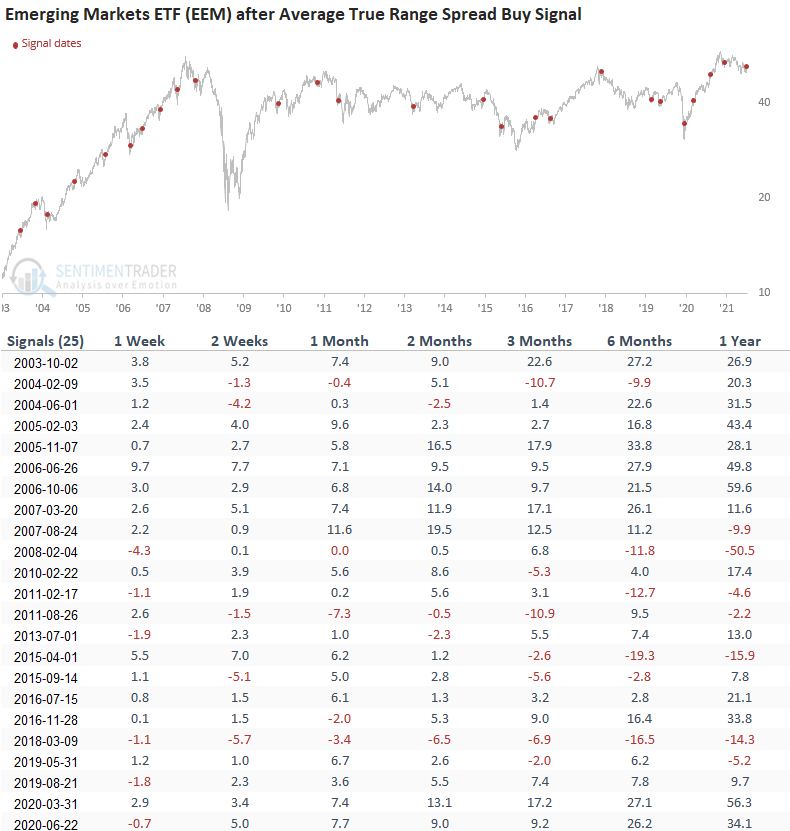
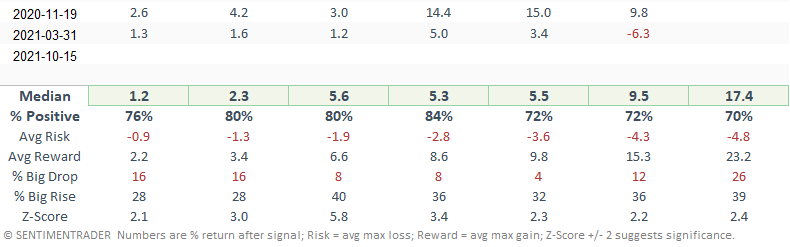
HOW THE SIGNALS PERFORMED
The results look excellent across all time frames, with several significant risk/reward profiles, especially the 1-month window.
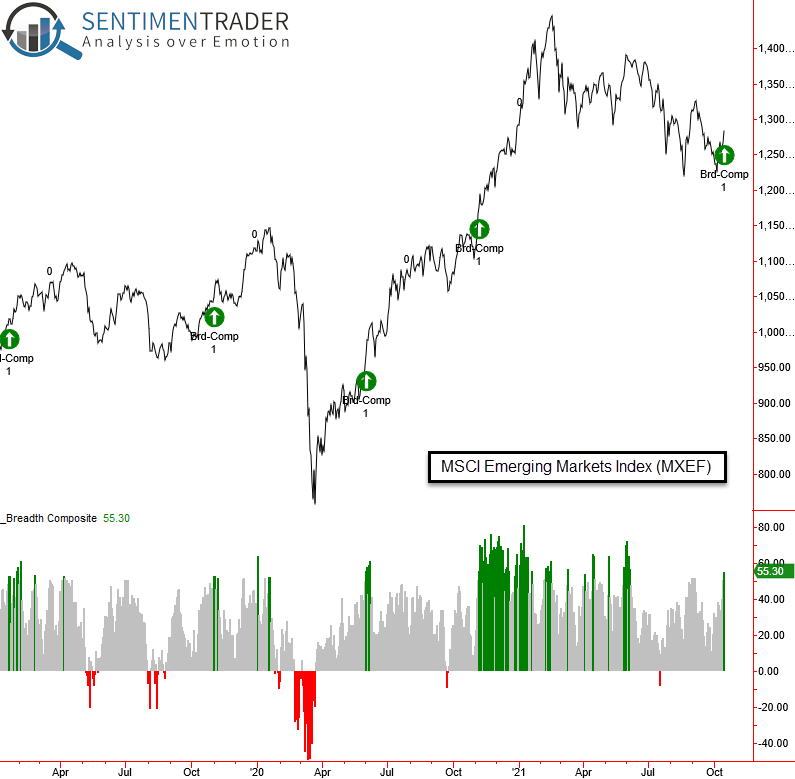
BREADTH COMPOSITE MODEL
The following breadth composite is constructed from the 44 countries USD-based ETF series that I share in my Monday ETF updates. The emerging markets composite contains participation-based indicators from 22 countries.
BREADTH COMPOSITE INDICATOR COMPONENTS
- Percentage of EM countries above the 10-day moving average
- Percentage of EM countries above the 50-day moving average
- Percentage of EM countries above the 200-day moving average
- Percentage spread between 21-Day highs and lows for EM countries
- Percentage spread between 63-Day highs and lows for EM countries
- Percentage spread between 252-Day highs and lows for EM countries
BREADTH COMPOSITE CONCEPT
The composite breadth signal identifies when the composite surges above a user-defined threshold level. The model will issue an alert based upon the following conditions.
SIGNAL CRITERIA FOR EMERGING MARKETS
- If the composite breadth indicator crosses below 0%, then the reset condition is active.
- If the reset condition is confirmed and the composite breadth indicator crosses above 52.5%, then buy.
CURRENT DAY CHART
TRADING STATISTICS
The trading statistics in the table below reflect the optimal days-in-trade holding period of 41 days. When I run optimizations for trading signals, I cap the max number of days at 42. i.e., I optimize to find the best DIT holding period between 5 and 42 days.
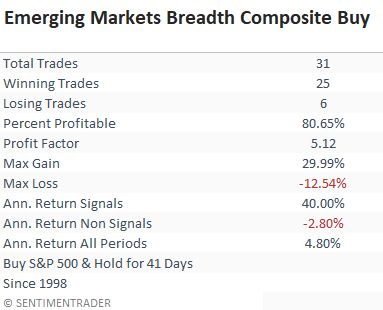
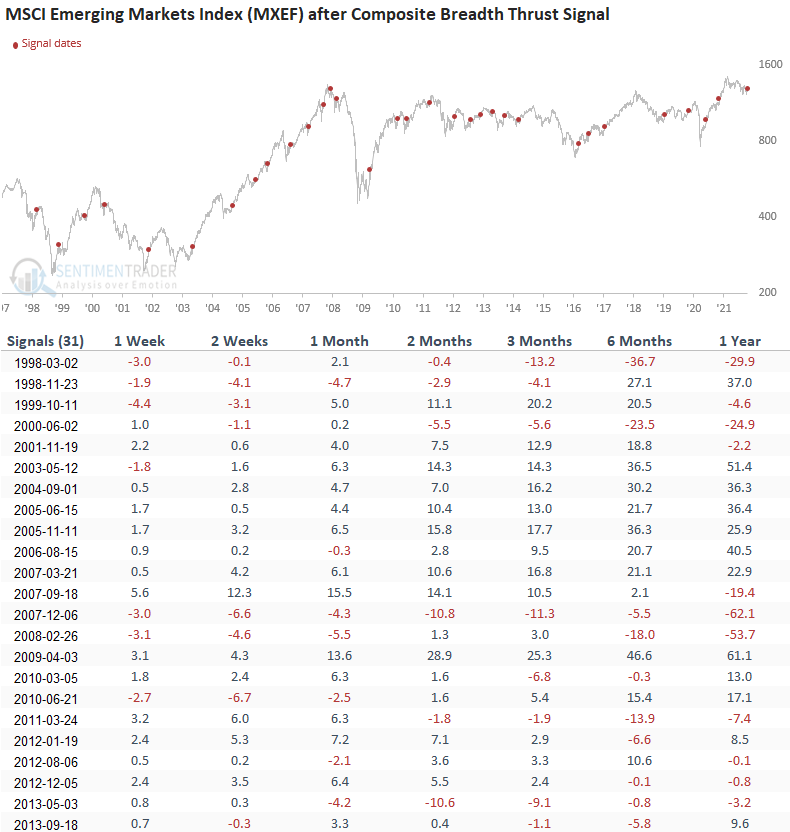
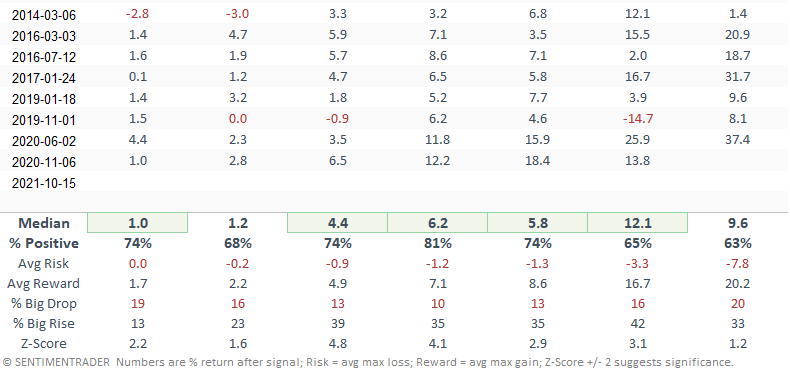
HOW THE SIGNALS PERFORMED
Results look solid across almost all time frames. While several risk/reward profiles are good, the one and two-month windows are excellent. And, I would note that the 2-month window has registered 16/18 positive gains since 2008.
Both models' performance and risk/reward profiles look good enough to suggest that one should consider a mean-reversion opportunity in an emerging market ETF. However, given the dollar and monetary policy backdrop, I view the opportunity as a short-term rent versus buy-and-hold strategy.
As always, this note is not a recommendation but rather a complementary tool to your investment process.