Data &
Technology
Research
Reports
Report Solutions
Reports Library
Actionable
Strategies
Free
Resources
Simple Backtest Calculator
Simple Seasonality Calculator
The Kelly Criterion Calculator
Sentiment Geo Map
Public Research Reports
Free Webinar
Pricing
Company
About
Meet Our Team
In the News
Testimonials
Client Success Stories
Contact
Log inLoginSign up
< BACK TO ALL REPORTS

Emerging Markets Have Only Done This 3 Other Times

Jason Goepfert
2021-07-29
Through late July, emerging market stocks are underperforming the S&P 500 by one of the widest margins in history.

The most widely benchmarked index in the world has enjoyed a historically consistent and persistent rally in 2021. For many of its stocks, and especially for stocks outside the U.S., it's been a much different story.

Even while the S&P 500 has set record after record, stumbles in some Chinese stocks have helped to drag down emerging market indexes. The MSCI Emerging Markets Index has now turned negative for the year.

Emerging markets versus the S&P 500

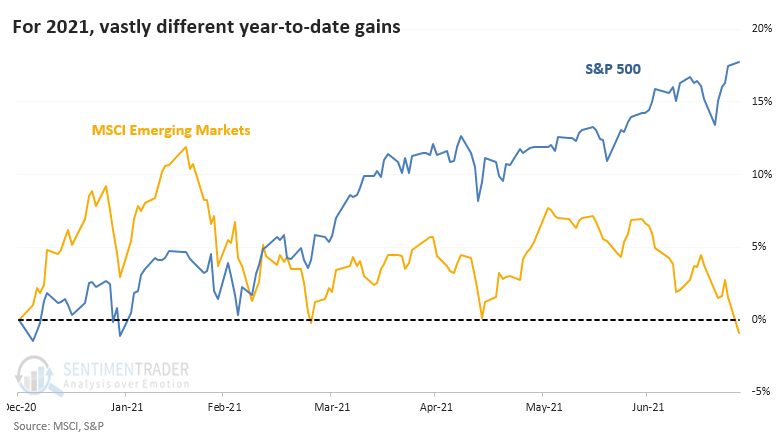
Through the end of July (or close to it, anyway), this is the 4th-widest difference in returns between the S&P and emerging markets.

There is a tendency to think that we should see some mean reversion through the end of the year. Bulls outside of the U.S. would want to think that impressive returns in the S&P would prompt investors to re-allocate to lagging markets. It wasn't to be.

Since 1988, there have been 3 other times when the S&P 500 was up by double digits through late July while emerging markets were in negative territory for the year. Each time, emerging markets fell further in the month(s) ahead.


What else we're looking at

  • Full returns in Emerging Markets, the S&P 500, and their ratio after wide performance spreads through July
  • Looking at lesser spreads to get a larger sample size
  • What happens when the S&P 500 makes a historically quick recovery from a pullback
  • Investigating the merits of a Bull Put Spread on gold
  • Why we need to keep a close eye on coffee

Stat box

Last week, the S&P 500 recovered from a 2.5% pullback from a 52-week high in only 4 trading days. Since 1928, that ranks among the top 11 fastest recoveries ever.

Etcetera

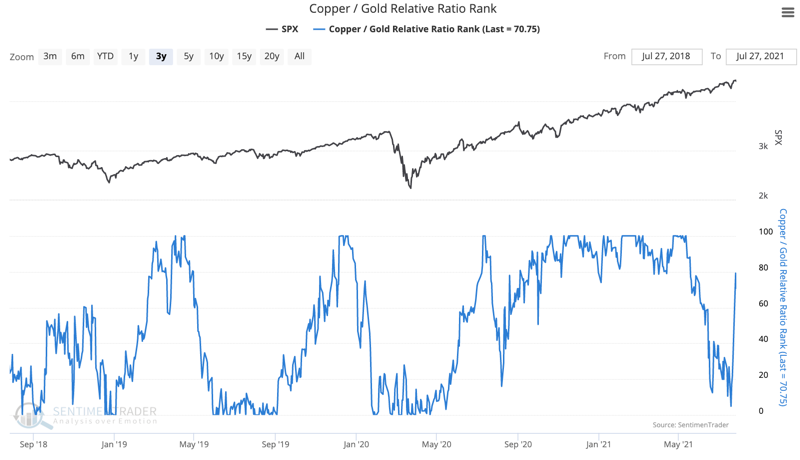
Rebounding risk appetite. The Copper/Gold Relative Ratio Rank went vertical this week, jumping 76 points. This shows increasingly risk-seeking behavior among investors.

copper to gold ratio

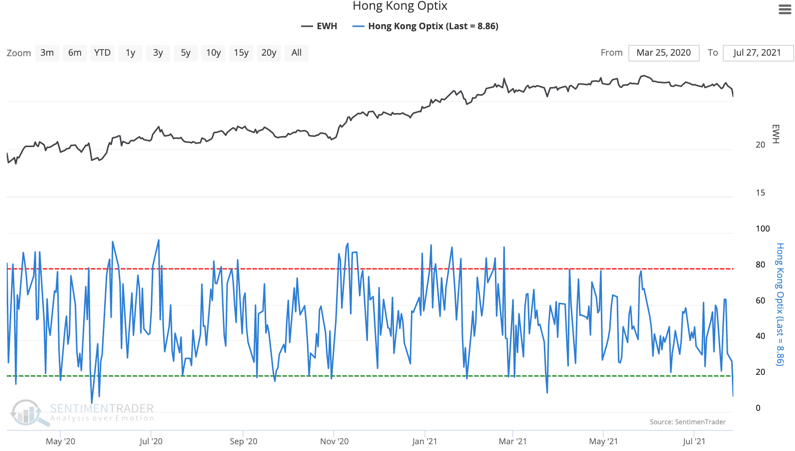
Low expectations. The Hong Kong Optimism Index reached its lowest point since March 2020, falling below 9%. Our Backtest Engine shows that the average return in EWH in the month following similar signals in an uptrend was +2.1%.

hong kong sentiment

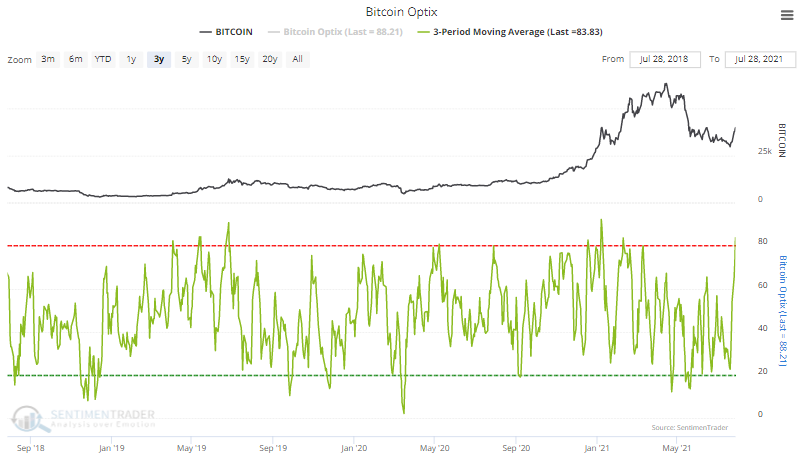
Bitcoin blast. Over the past 3 sessions, the Optimism Index for bitcoin has averaged more than 83%, ranking among the highest readings of the past 3 years.

bitcoin sentiment

DATA &
TECHnologies
IndicatorEdge
‍
BackTestEdge
‍
Other Tools
‍
DataEdge API
RESEARCH
reports
Research Solution
‍
Reports Library
‍
actionable
Strategies
Trading Strategies
‍
Smart Stock Scanner
‍
FREE
RESOUrCES
Simple Backtest
Calculator
Simple Seasonality
Calculator
The Kelly Criterion
Calculator
Sentiment Geo Map
‍
Public Research Reports
‍
Free Webinar
COMPANY
‍
About
‍
Meet our Team
‍
In the News
‍
Testimonials
‍
Client Success Stories
Pricing
Bundle pricing
‍
Announcements
‍
FAQ
© 2024 Sundial Capital Research Inc. All rights reserved.
Setsail Marketing
TermsPrivacyAffiliate Program
Risk Disclosure: Futures and forex trading contains substantial risk and is not for every investor. An investor could potentially lose all or more than the initial investment. Risk capital is money that can be lost without jeopardizing ones’ financial security or life style. Only risk capital should be used for trading and only those with sufficient risk capital should consider trading. Past performance is not necessarily indicative of future results.

Hypothetical Performance Disclosure: Hypothetical performance results have many inherent limitations, some of which are described below. No representation is being made that any account will or is likely to achieve profits or losses similar to those shown; in fact, there are frequently sharp differences between hypothetical performance results and the actual results subsequently achieved by any particular trading program. One of the limitations of hypothetical performance results is that they are generally prepared with the benefit of hindsight. In addition, hypothetical trading does not involve financial risk, and no hypothetical trading record can completely account for the impact of financial risk of actual trading. for example, the ability to withstand losses or to adhere to a particular trading program in spite of trading losses are material points which can also adversely affect actual trading results. There are numerous other factors related to the markets in general or to the implementation of any specific trading program which cannot be fully accounted for in the preparation of hypothetical performance results and all which can adversely affect trading results.

Testimonial Disclosure: Testimonials appearing on this website may not be representative of other clients or customers and is not a guarantee of future performance or success.