
Emerging markets are showing signs of momentum

Despite the major indexes hanging tough and adding to their gains Monday, we're still not seeing a huge improvement in the numbers of stocks, industries, sectors, and global indexes rising above their 200-day averages. It takes time to improve, but this is one of the hallmarks of an unhealthy market environment.
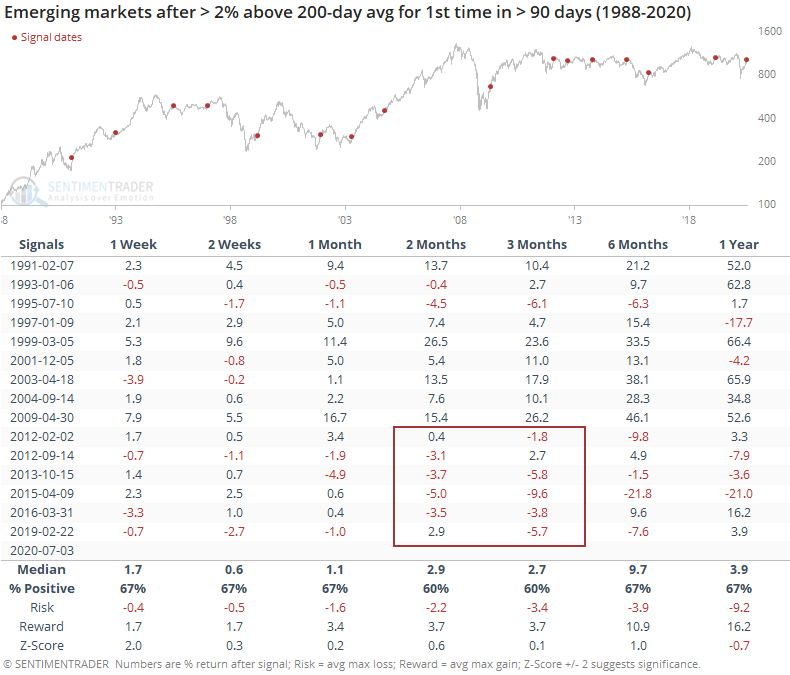
Emerging markets are often looked to as an indicator of risk appetite. If investors are buying those stocks, then it's assumed that they have a high tolerance for risk. Lately, those stocks have been doing very well, and for the first time in months, the MSCI Emerging Markets Index has moved more than 2% above its 200-day average.
It's often beneficial to build a filter around the 200-day average to filter out those times when an index gyrates slightly above or below it, without changing its longer-term trend. When emerging markets finally managed to break this far away from its average, it typically kept going, though it was not a strong edge. Since 2010, every one of these signals showed a negative return either 2 or 3 months later.
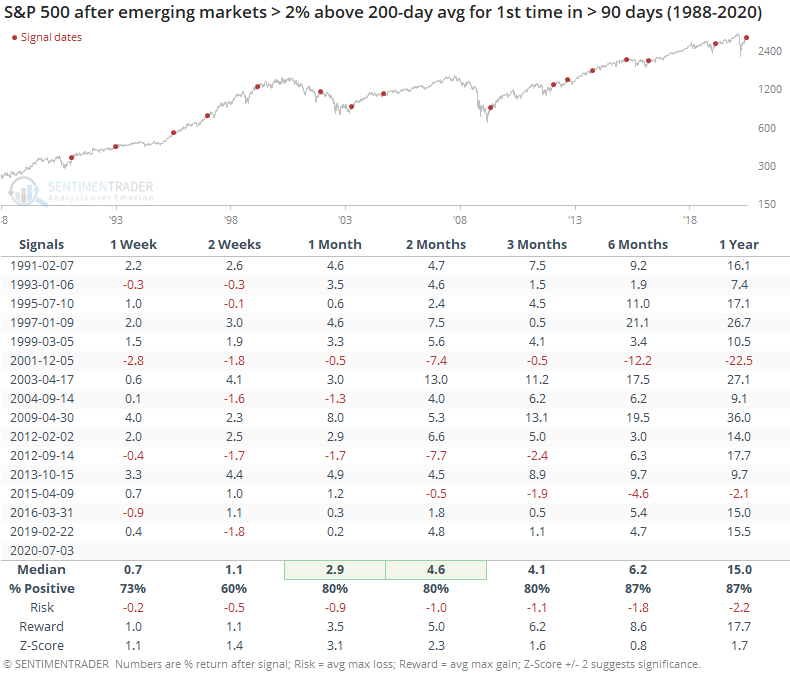
It was a better sign for the S&P 500.
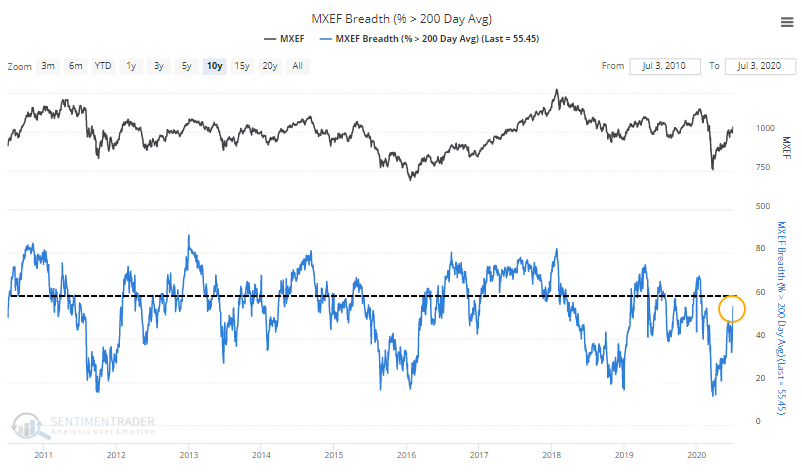
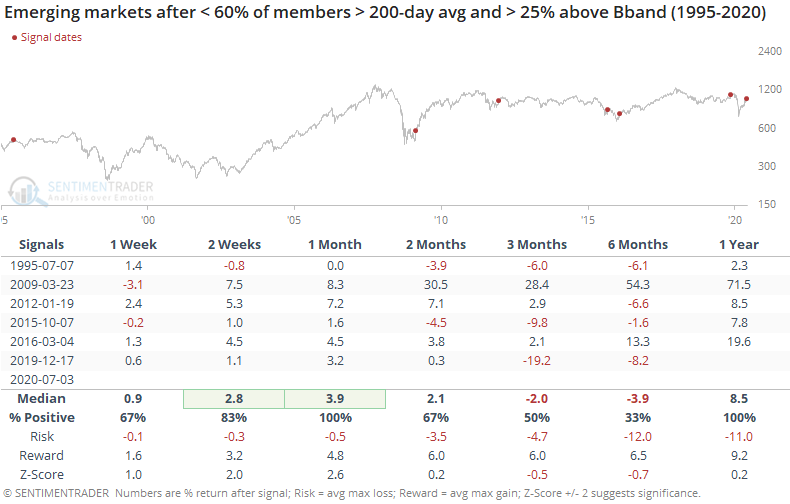
Like we're seeing with domestic indexes, even though they're holding up, many stocks are not necessarily following along. In emerging markets, there are still fewer than 60% of stocks above their long-term averages.
Even so, the push late last week triggered many of them to move outside of their upper Bollinger Bands and also become overbought, with a Relative Strength Index above 70.
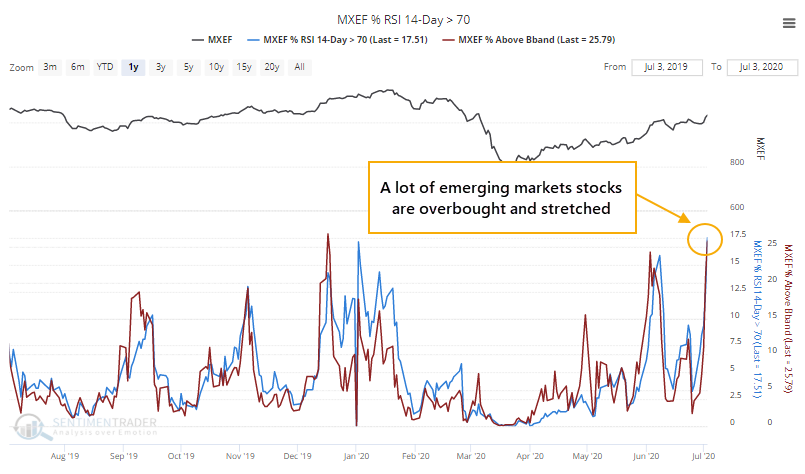
When less than 60% of them were above their 200-day averages, but more than 25% of them spiked above their volatility bands, it was a good short- to medium-term sign of momentum. Unfortunately, several of these rallies failed, and the risk/reward was poor over the next 6 months. A year later, they were higher every time, so there's that.
Returns were better when there was a big jump in the percentage of these stocks becoming overbought, even within the context of less than 60% of them being above their 200-day averages.
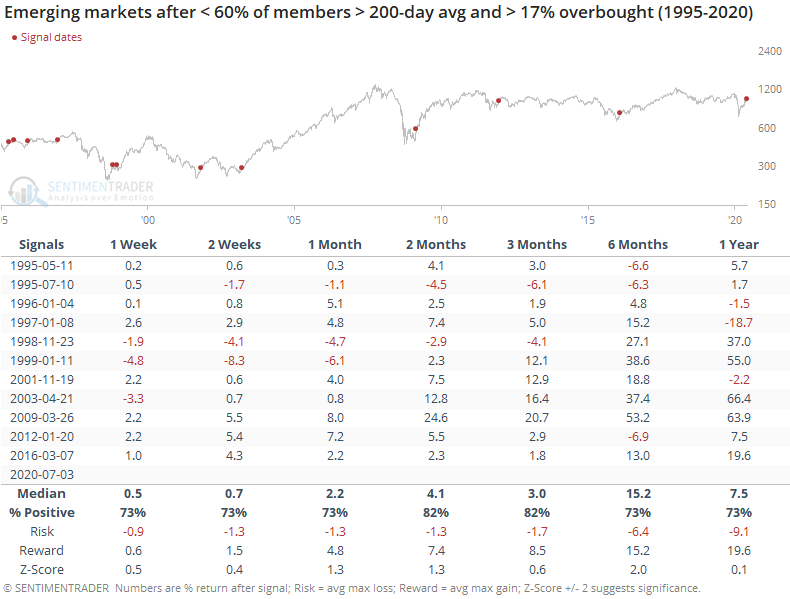
Global markets don't necessarily behave as domestic ones do. If we apply these same tests to indexes like the S&P 500, then forward returns are poor over the medium-term. Even though emerging markets have struggled to show sustained bull markets, when they witness momentum like this, it has been a better sign than not.
There is some concern, among U.S. investors anyway, that if the dollar rallies, emerging market investments will suffer. Since "smart money" hedgers are net long the dollar, perhaps that's more of a worry than usual.
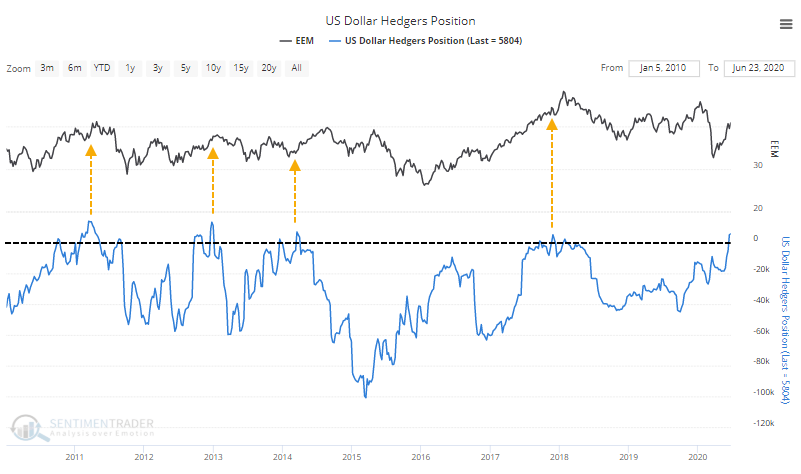
Over the past decade, when hedgers had bets on a rising dollar, funds like EEM did tend to struggle over a multi-month time period. It wasn't a perfect indicator by any stretch, but it looks to be at least a minor worry here.
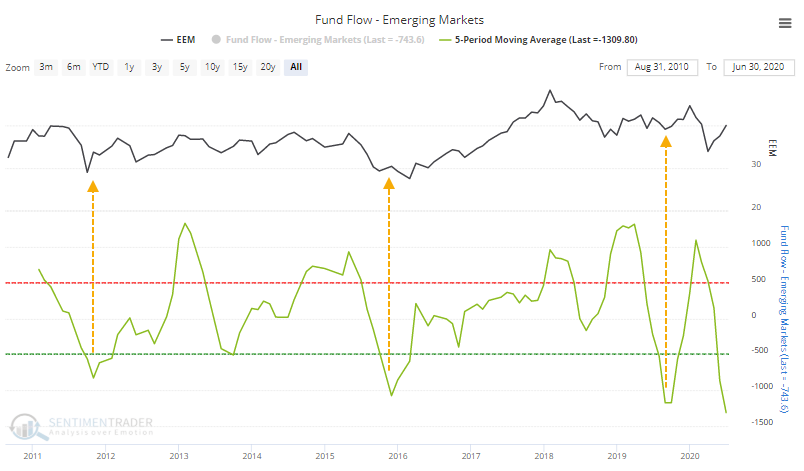
On the plus side, ETF investors seem to have become apathetic on funds like EEM, with shares outstanding falling to the lowest since the financial crisis.
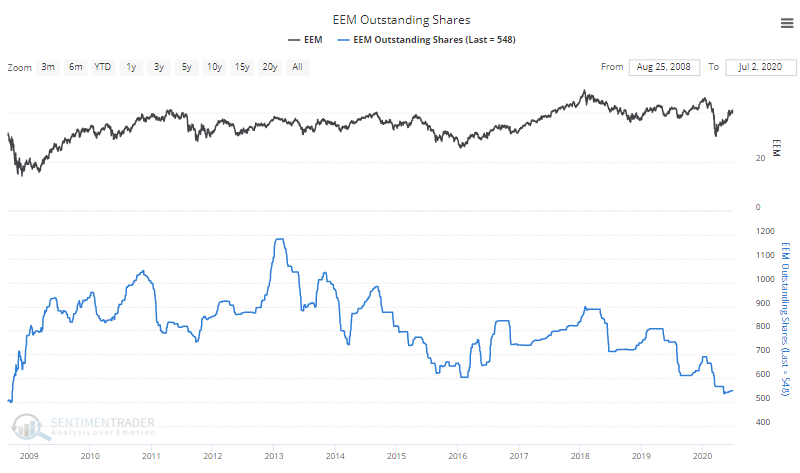
Even if investors are drifting to other funds, there isn't much evidence of it. Fund flows across all emerging market ETFs have moved to a record low. Over the past 5 months, an average of over $1.3 billion per month has flowed, and other times when the 5-month average outflow neared $1 billion, it was a good sign.
There are a couple of minor worries about emerging markets here, but the momentum is more of a good sign than an "overbought is bad" one. Ideally, for bulls, the move will become sustained enough that more than 60% of stocks can exceed and hold their 200-day averages and shift the environment to more of a healthy one. Based on preliminary signs, that should happen.