
Economy and stocks losing an important economic tailwind

Key Points
- When you boil it all down, stock market performance is essentially a function of economic growth
- When the economy is growing, stocks typically advance
- But when the stock market gets a whiff of recession, stocks invariably decline
- The Heavy Truck Index is a surprisingly helpful indicator for both stocks and the economy
- This indicator will flip from "favorable" to "unfavorable" at the end of April
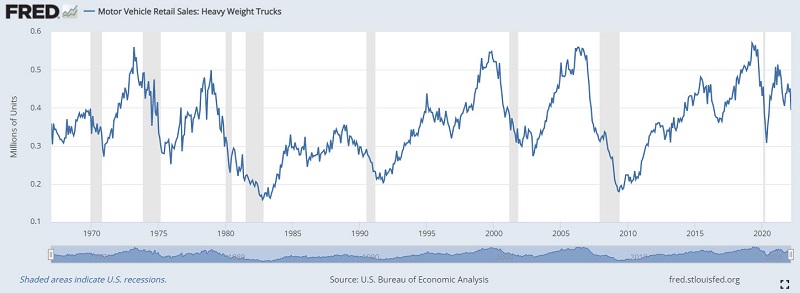
Heavy Truck Index
The Heavy Truck Index is a data series that tracks the number of newly registered heavy trucks with government agencies in the United States.
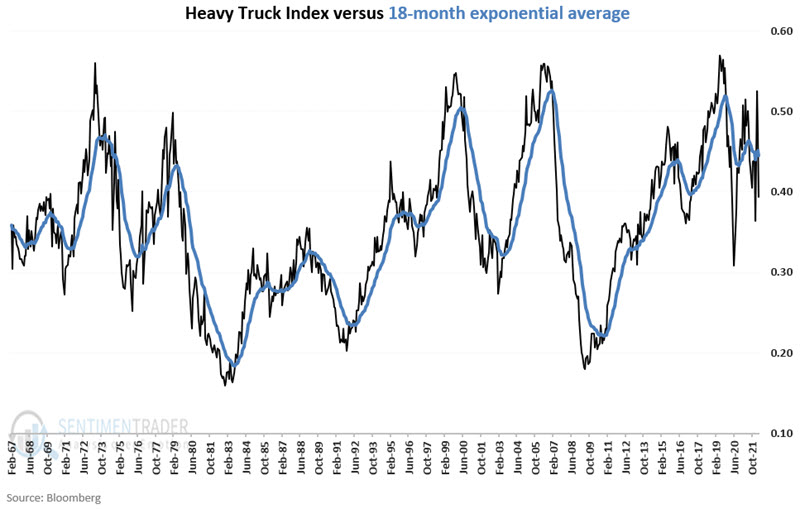
What is most important is the trend of the data. The chart below displays HTI versus its own 18-month exponential moving average.
The chart below displays the difference between the monthly HTI reading and its 18-month EMA. We will detail shortly that this indicator is "favorable" for stocks and the overall economy when it is above 0 and "unfavorable" below 0.
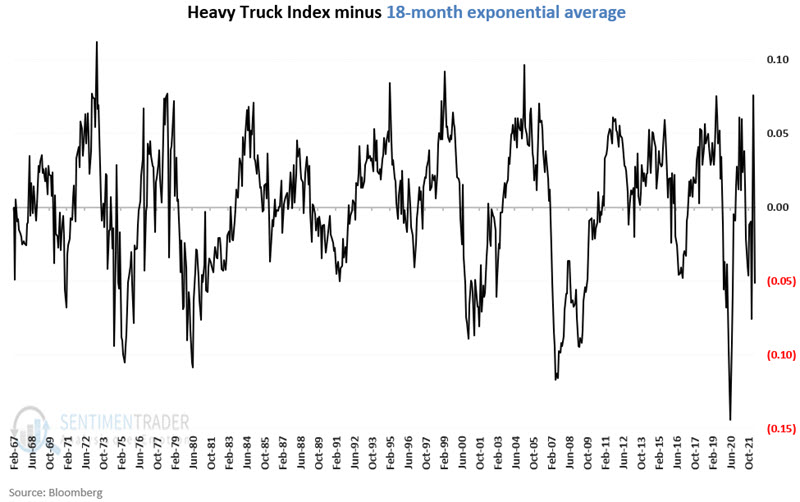
The Heavy Truck Index has dropped below its 18-month EMA following the latest update of data on 4/5/2022. One other note: I update this indicator "officially" ONLY at the end of each month. So technically, I will not count this indicator as "unfavorable" until May 1st. Nevertheless, it is helpful to understand the implication now.
Does this impending "unfavorable" status portend doom for the economy and stocks? Not necessarily. But it does remove a very important piece of evidence from the positive side of the ledger.
Heavy Truck Index versus Coincident Economic Indicators
To track the course of the economy, we will use the Coincident Economic Indicators (CEI) data series.
At the end of each month:
- We note the status of our HTI indicator
- We then note performance (% rise or fall) in CEI for the next month
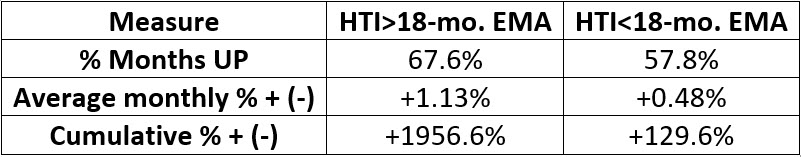
The table below displays monthly CEI performance depending on whether our HTI indicator is above or below its 18-month EMA.
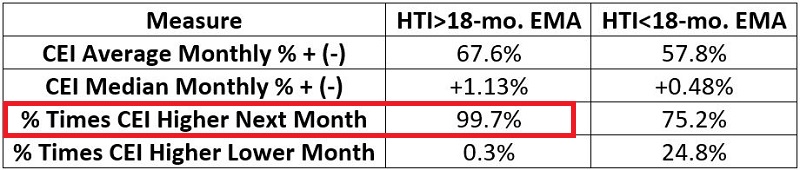
Key things to note in the table above:
- The economy performed significantly better when HTI > 18-month average (average +0.30% versus +0.10%)
- CEI has experienced exactly one monthly contraction when HTI > 18-month EMA
- Except for that one month, a down-trending HTI indicator preceded ALL OTHER calendar months that witnessed a contraction in CEI
The implication: As long as Heavy Truck Sales are above their 18-month average, there has historically been almost no risk of a recession. As of May 1st, this "economic green light" will flash yellow instead.
The chart below displays cumulative Coincident Economic Indicators % +(-) based on whether HTI is above or below its 18-month EMA at the end of the previous month.
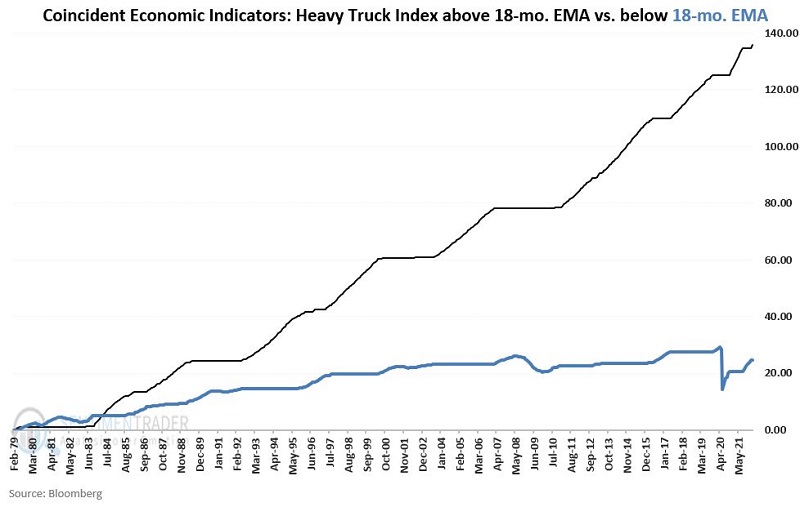
Again, this indicator shifting to "unfavorable" (blue line in the chart above) does not mean the economy is due to weaken. But the odds shift dramatically away from the high probability (see black line in the chart above) of continued economic growth enjoyed when this indicator is "favorable."
Heavy Truck Index versus Stocks
Economic forecasts are all well and good, but the real issue for investors is to be in the stock market at the right time. The chart below displays the growth of $1 invested in the S&P 500 Index when:
- HTI > 18-month average (black line)
- HTI < 18-month average (blue line)
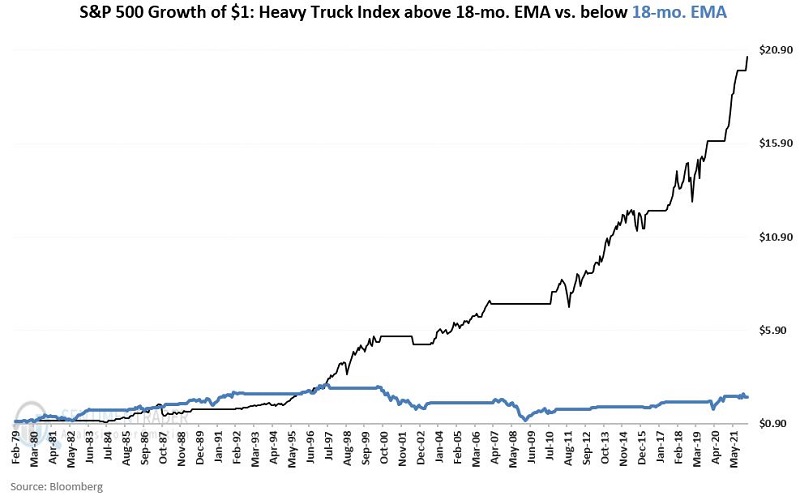
For the record:
What the research tells us…
When the Heavy Truck Index is above its 18-month EMA, the odds of a recession are exceedingly low, AND the odds favor a rise in stocks prices.
On the other hand, when the Heavy Truck Index is below its 18-month average, there is no guarantee that a recession will develop. However, the odds of a recession increase significantly. Likewise, there is no guarantee that a bear market in stocks will develop. However, the longer the downtrend in HTI persists - and the larger the decline - the greater the odds of a significant stock bear market.
As of the end of April 2022, the status of this indicator will flip from "favorable" to "unfavorable."