Data &
Technology
Research
Reports
Report Solutions
Reports Library
Actionable
Strategies
Free
Resources
Simple Backtest Calculator
Simple Seasonality Calculator
The Kelly Criterion Calculator
Sentiment Geo Map
Public Research Reports
Free Webinar
Pricing
Company
About
Meet Our Team
In the News
Testimonials
Client Success Stories
Contact
Log inLoginSign up
< BACK TO ALL REPORTS

Economists keep underestimating the U.S.

Jason Goepfert
2021-11-12
For the first time in several months, economic surprises in the U.S. turn positive.

Economic data is exceeding economists' ability to keep up.

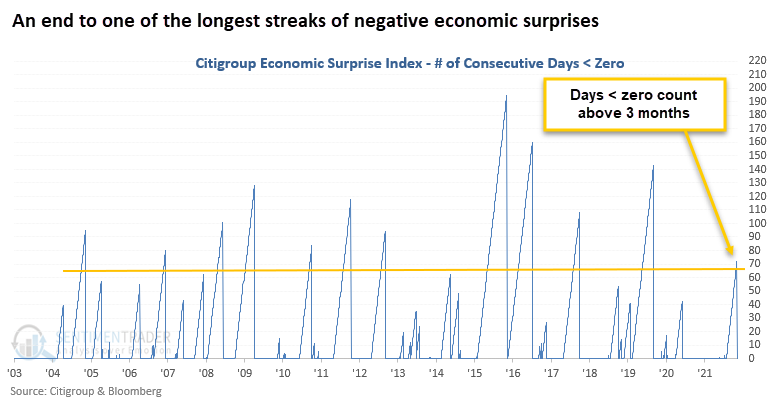
According to Bloomberg, the Citigroup economic surprise index measures data surprises relative to market expectations. A positive reading means that data releases have been stronger than expected and a negative reading means that data releases have been worse than expected.

After a surge in positive economic reports a year ago, economists adjusted their expectations and subsequent reports failed to meet those higher standards. Dean noted that now that conditions are (somewhat) normalizing, reports are once again beating expectations.

In recent days, the Citigroup economic surprise index crossed above zero. This move into positive territory ended a streak of more than 70 days below zero.

Economic surprises turn positive for the first time in months

This signal has triggered 11 other times over the past 18 years. After the others, stocks tended to do well over longer time frames, while a popular bond ETF showed more of a struggle.


What else we're looking at

  • Returns in stocks and bonds after a recovery in economic surprises
  • What a breadth recovery in the high-yield bond market means for stocks and bonds
  • A look at seasonality and sentiment in major energy contracts

Stat box

Wednesday's trading activity marked only the 40th time since 1975 that both the U.S. dollar and gold rose by more than 0.9% on the same day. 

Etcetera

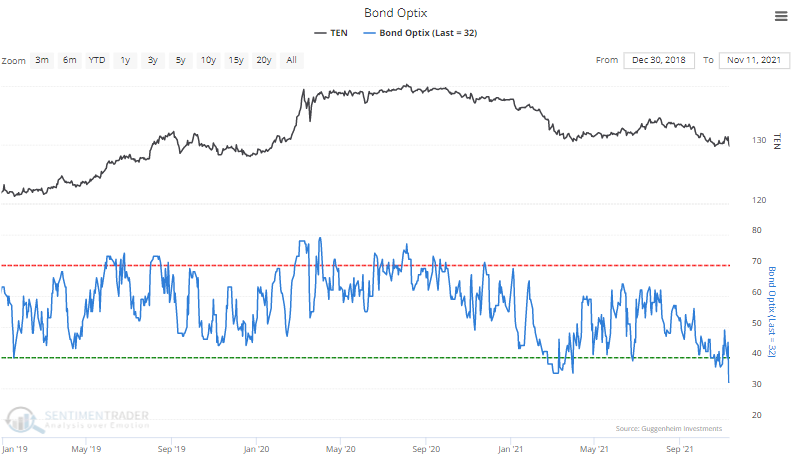
Bonds bomb. Thanks to an inflation scare, investors are avoiding bonds. The Optimism Index for Treasury notes and bonds has plunged to the lowest level in 3 years.

Optimism on bonds is tanking

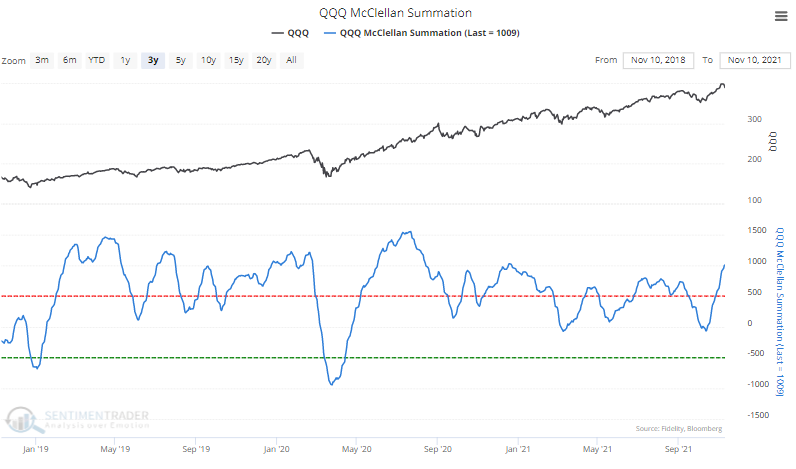
Big tech rebound. After resetting at zero, the McClellan Summation Index for the Nasdaq 100 index has soared again, showing strong underlying momentum in tech shares. The Summation Index is once again above +1,000 and challening the highest level in a year.

The McClellan Summation Index for the NDX is soaring

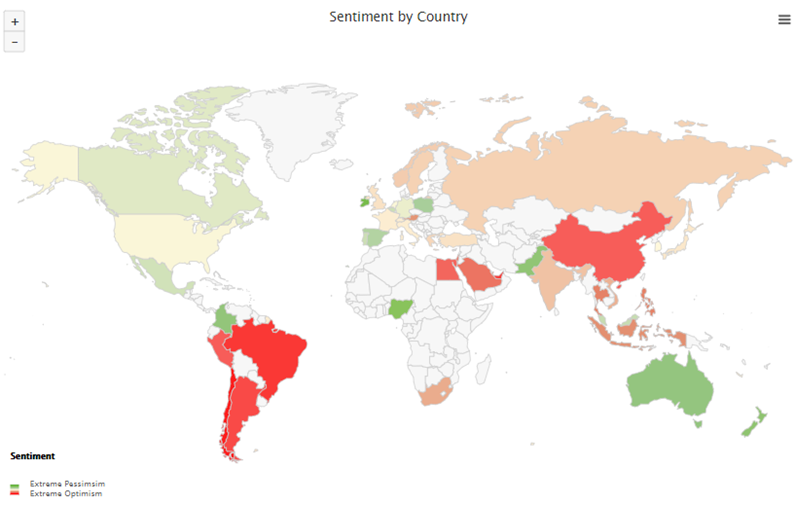
A quick about-face. Our Optimism Index Geo-Map shows that for the first time in a while, investors are suddenly the most optimistic (red color) in South American countries like Brazil, as well as China.

Optimism map shows high optimism in Brazil, China

DATA &
TECHnologies
IndicatorEdge
‍
BackTestEdge
‍
Other Tools
‍
DataEdge API
RESEARCH
reports
Research Solution
‍
Reports Library
‍
actionable
Strategies
Trading Strategies
‍
Smart Stock Scanner
‍
FREE
RESOUrCES
Simple Backtest
Calculator
Simple Seasonality
Calculator
The Kelly Criterion
Calculator
Sentiment Geo Map
‍
Public Research Reports
‍
Free Webinar
COMPANY
‍
About
‍
Meet our Team
‍
In the News
‍
Testimonials
‍
Client Success Stories
Pricing
Bundle pricing
‍
Announcements
‍
FAQ
© 2024 Sundial Capital Research Inc. All rights reserved.
Setsail Marketing
TermsPrivacyAffiliate Program
Risk Disclosure: Futures and forex trading contains substantial risk and is not for every investor. An investor could potentially lose all or more than the initial investment. Risk capital is money that can be lost without jeopardizing ones’ financial security or life style. Only risk capital should be used for trading and only those with sufficient risk capital should consider trading. Past performance is not necessarily indicative of future results.

Hypothetical Performance Disclosure: Hypothetical performance results have many inherent limitations, some of which are described below. No representation is being made that any account will or is likely to achieve profits or losses similar to those shown; in fact, there are frequently sharp differences between hypothetical performance results and the actual results subsequently achieved by any particular trading program. One of the limitations of hypothetical performance results is that they are generally prepared with the benefit of hindsight. In addition, hypothetical trading does not involve financial risk, and no hypothetical trading record can completely account for the impact of financial risk of actual trading. for example, the ability to withstand losses or to adhere to a particular trading program in spite of trading losses are material points which can also adversely affect actual trading results. There are numerous other factors related to the markets in general or to the implementation of any specific trading program which cannot be fully accounted for in the preparation of hypothetical performance results and all which can adversely affect trading results.

Testimonial Disclosure: Testimonials appearing on this website may not be representative of other clients or customers and is not a guarantee of future performance or success.