
Economic indicators lurching toward a contrarian stance

Key points:
- As economic news gets worse, consumer and investor confidence trends lower
- It is when things start to look their worst that the best opportunities present themselves
- Both consumer confidence and manufacturing data suggest that moment is getting closer
Tumbling consumer confidence is not a bad thing
As perceptions regarding the stock market and the economy worse, consumer confidence declines. Sometimes the decline is slow and steady over many months. Other times, the bottom drops out.
In any event, there are two things to remember. First, this indicator should be viewed as a contrarian indication. The worse things look, the more investors should force themselves to adopt a more favorable outlook for stocks. Secondly, signals from this indicator should generally not be viewed as automatic, standalone buy signals for stocks.
As we will see below, the market can sometimes continue to flounder after consumer confidence drops below a certain level. However, at other times the market can reverse quickly. The bottom line is that these signals amount to important alerts rather than automatic and immediate buy signals.
The chart and table below display performance results for the S&P 500 Index when the University of Michigan Consumer Confidence Survey is below 58%.
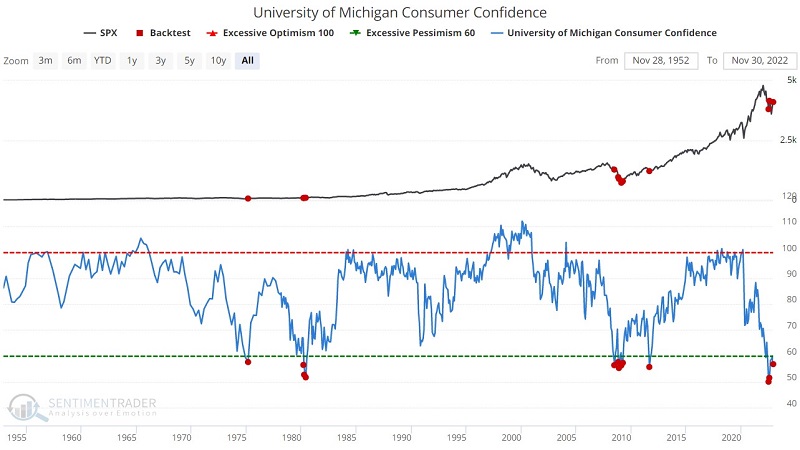
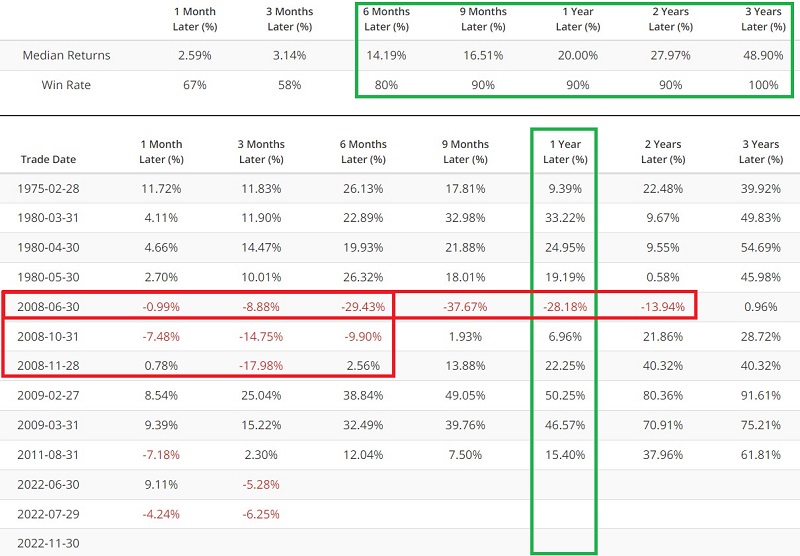
The good news is that the S&P 500 was higher twelve months later 90% of the time, with a median gain of +20%. The bad news is that June 2008 signal came into the teeth of the massive Great Financial Crisis decline and was followed by a dramatic waterfall decline in the months ahead. On the plus side, the June and July 2022 signals have so far been followed by a (volatile) recovery.
Weakening manufacturing data is always scary but also typically bullish
The chart and table below display performance results for the S&P 500 Index when the ISM PMI Manufacturing Index is below 50%.
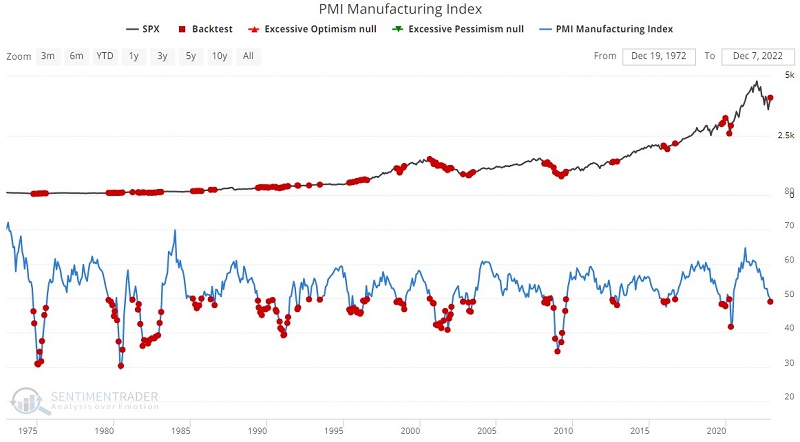
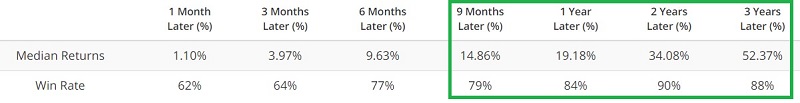
This particular version of this indicator is by no means a precision market timing tool. Note that acting on the first drop below 50% would have resulted in buying into the teeth of 2000, 2008, and 2019-2020 declines. Still, the S&P 500 stood higher twelve months later 84% of the time, with a robust median gain of +19.2%. Once again, this indicator version is more of an alert to keep your wits while everyone around is losing theirs.
Let's look at an even more extreme version of this indicator. The chart and table below display performance results for the S&P 500 Index when the ISM PMI Manufacturing Index is below 42%.
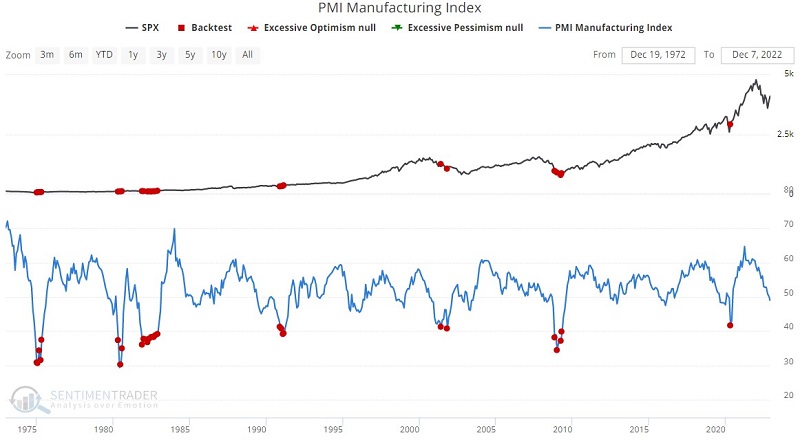
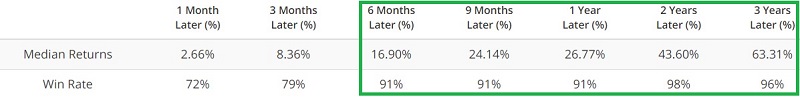
Median twelve-month returns following a PMI reading below 42% increase to a sizeable +26.19% with a 91% Win Rate. Note that this has not yet occurred during the current cycle, nor is than any guarantee that the PMI Manufacturing Index will fall that far during this cycle. But rest assured that if it does, the financial press will announce the results in grim, ominous tones, with inferences of an awful economy. Your job at that point is to be a contrarian.
What the research tells us…
Stock market bottoms tend to occur when the economy looks awful. The worse consumer confidence and manufacturing data look, the uglier the financial news headlines and the thicker the gloom and doom on Wall Street. But the thicker the gloom, the harder investors should force themselves to think like a contrarian and look for the inevitable buying opportunity. Are the gloom and doom thick enough to present a buying opportunity? That can only really be known in hindsight. But even if that opportunity is not yet at hand, we can likely see it from here.