Data &
Technology
Research
Reports
Report Solutions
Reports Library
Actionable
Strategies
Free
Resources
Simple Backtest Calculator
Simple Seasonality Calculator
The Kelly Criterion Calculator
Sentiment Geo Map
Public Research Reports
Free Webinar
Pricing
Company
About
Meet Our Team
In the News
Testimonials
Client Success Stories
Contact
Log inLoginSign up
< BACK TO ALL REPORTS

Economic and Consumer Sentiment Composite Buy Signal

Dean Christians
2021-04-15
Let's review a new economic and consumer sentiment composite model buy signal that triggered this week.

Several years ago, I created an economic and consumer sentiment composite to measure survey data changes across a diverse group of categories. The composite contains data from small business owners, housing, manufacturing, services, and consumers. The economic and consumer sentiment composite model for March is now complete, with an update from the NFIB on Tuesday. The new data helped drive the 3-month net change in the composite above a level that generated a new buy signal as of 3/31/21.

Source/Components

1.) NFIB Small Business Optimism

2.) NFIB Small Business Economy to Improve

3.) University of Michigan Consumer Sentiment

4.) Conference Board Consumer Confidence

5.) ISM Manufacturing PMI

6.) National Association of Homebuilders

7.) Philadelphia Fed Business Outlook

8.) ISM Non-Manufacturing NMI

Calculations

1.) % Rank each component versus entire history from highest to lowest and average the group on an equal-weighted basis.

Economic and Consumer Sentiment Composite Buy Signal

The Economic and Consumer Sentiment Composite model seeks to identify instances in history when the 3-month net change in the composite surges above a user-defined threshold when the S&P 500 is in an uptrend.  The model will issue an alert based upon the following conditions.

Signal Criteria

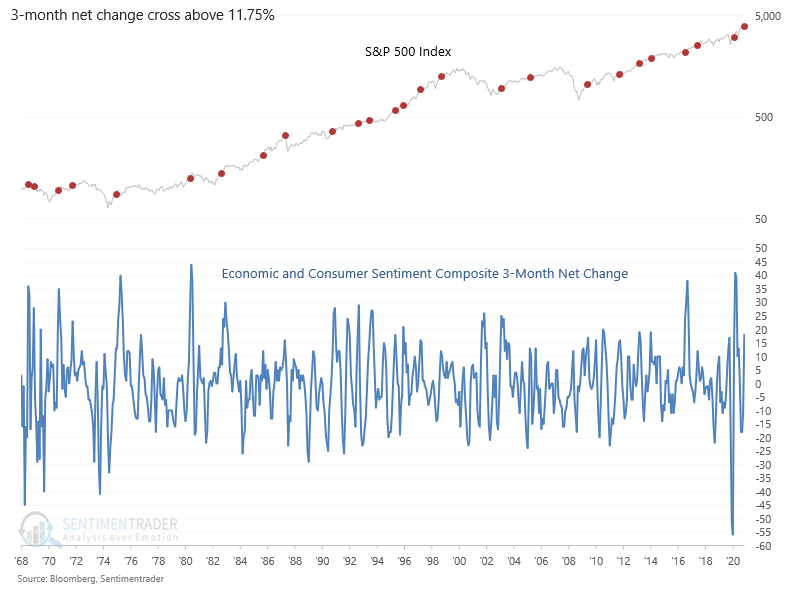
Condition1 = Composite 3-month net change cross above 11.75%.

Condition2 = S&P 500 Index > 12-month moving average.

Condition3 = 3-month net change resets below zero.

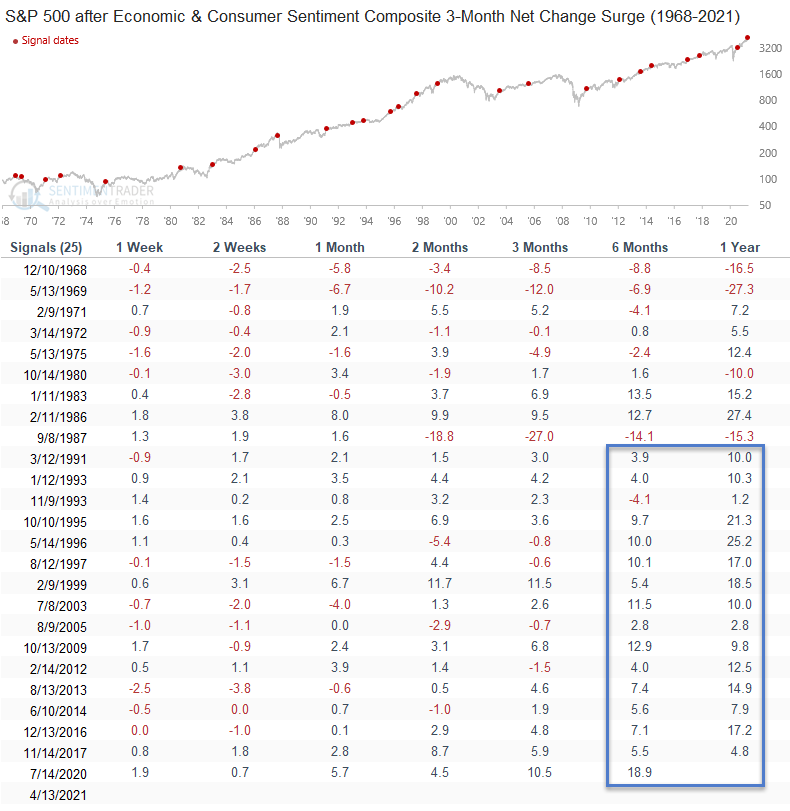
Let's take a look at some charts and the historical signal performance.

Current Day Chart

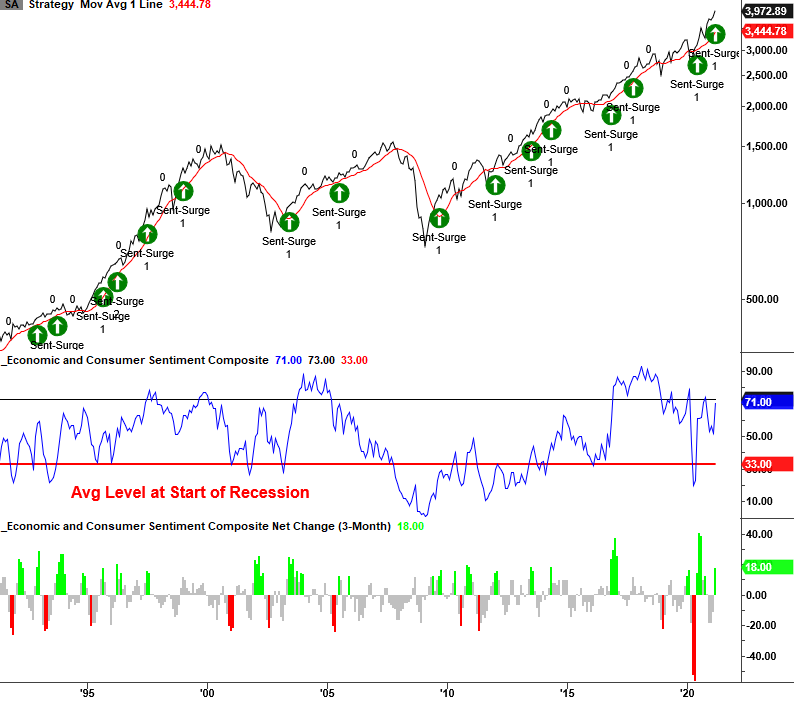
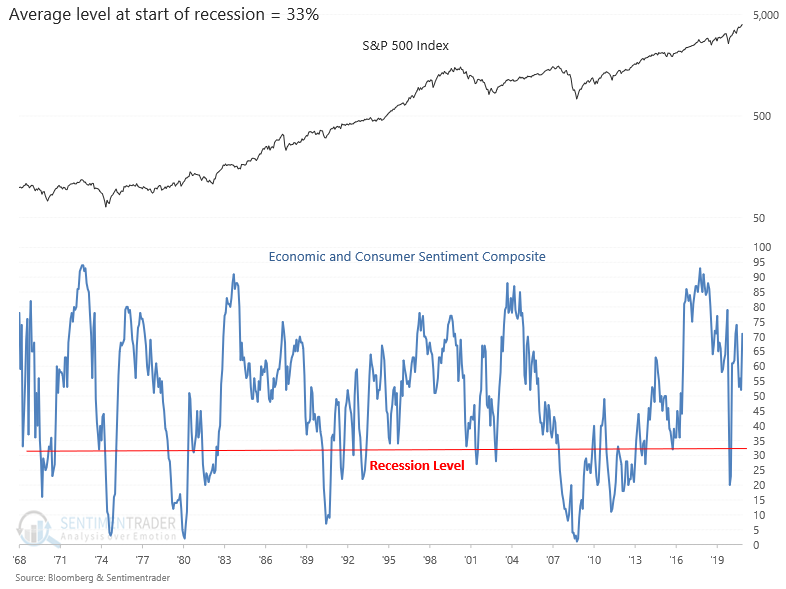
Economic and Consumer Sentiment Composite Chart

Economic Sentiment Composite 3-Month Net Change Chart
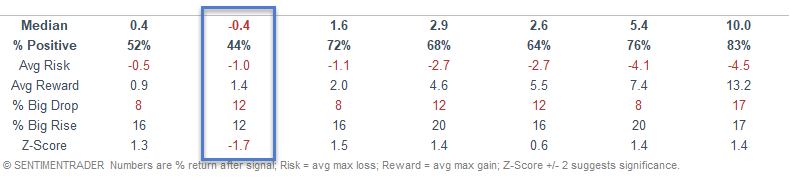
Signal Performance

Please note that signal dates have been adjusted forward to the second Tuesday of each new month. That day reflects the report date for the final component update in the model. For example, rather than using a signal date of 3/31/21, the signal date has been adjusted to 4/13/21. I believe this provides a more realistic outlook for assessing forward returns.

Performance in the six and twelve-month timeframe looks good, especially since 1991. I would note the 2-week timeframe is week.

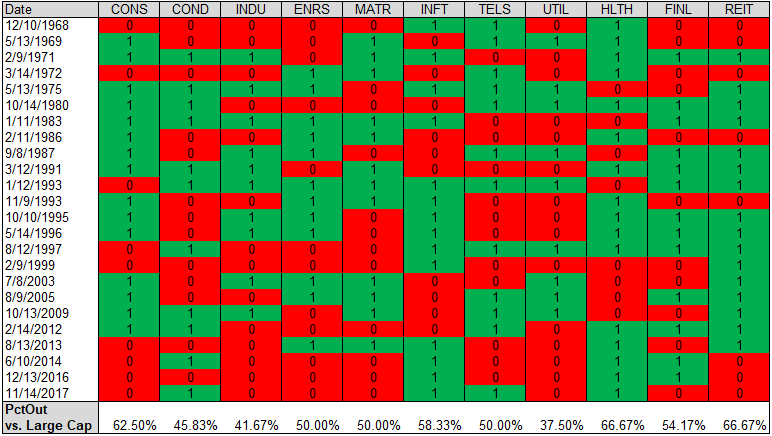
Sector Relative Performance vs. Large-Cap Stocks ( 1 Outperform  -  0 Underperform)

Interestingly, the signal tends to favor growth-oriented sectors.


Sorry, you don't have access to this report

Upgrade your subscription plan to get access
Go to Dasboard
DATA &
TECHnologies
IndicatorEdge
‍
BackTestEdge
‍
Other Tools
‍
DataEdge API
RESEARCH
reports
Research Solution
‍
Reports Library
‍
actionable
Strategies
Trading Strategies
‍
Smart Stock Scanner
‍
FREE
RESOUrCES
Simple Backtest
Calculator
Simple Seasonality
Calculator
The Kelly Criterion
Calculator
Sentiment Geo Map
‍
Public Research Reports
‍
Free Webinar
COMPANY
‍
About
‍
Meet our Team
‍
In the News
‍
Testimonials
‍
Client Success Stories
Pricing
Bundle pricing
‍
Announcements
‍
FAQ
© 2024 Sundial Capital Research Inc. All rights reserved.
Setsail Marketing
TermsPrivacyAffiliate Program
Risk Disclosure: Futures and forex trading contains substantial risk and is not for every investor. An investor could potentially lose all or more than the initial investment. Risk capital is money that can be lost without jeopardizing ones’ financial security or life style. Only risk capital should be used for trading and only those with sufficient risk capital should consider trading. Past performance is not necessarily indicative of future results.

Hypothetical Performance Disclosure: Hypothetical performance results have many inherent limitations, some of which are described below. No representation is being made that any account will or is likely to achieve profits or losses similar to those shown; in fact, there are frequently sharp differences between hypothetical performance results and the actual results subsequently achieved by any particular trading program. One of the limitations of hypothetical performance results is that they are generally prepared with the benefit of hindsight. In addition, hypothetical trading does not involve financial risk, and no hypothetical trading record can completely account for the impact of financial risk of actual trading. for example, the ability to withstand losses or to adhere to a particular trading program in spite of trading losses are material points which can also adversely affect actual trading results. There are numerous other factors related to the markets in general or to the implementation of any specific trading program which cannot be fully accounted for in the preparation of hypothetical performance results and all which can adversely affect trading results.

Testimonial Disclosure: Testimonials appearing on this website may not be representative of other clients or customers and is not a guarantee of future performance or success.