Products
SentimenTrader Trading Tools
‍
Backtest Engine
My Trading Toolkit
Correlation Analysis
Seasonality
Indicators & Data API
‍
Proprietary Indicators & Charts
Market Data API
Strategies & Scanner
‍
50+ Trading Strategies
Smart Stock Scanner
Research Reports
‍
Research Solutions
Reports Library
Free Resources
Simple Backtest Calculator
Simple Seasonality Calculator
The Kelly Criterion Calculator
Sentiment Geo Map
Public Research Reports
Pricing
Company
About
In the News
Testimonials
Client Success Stories
Contact
Log inLoginSign up
< BACK TO ALL REPORTS

Economic activity hasn't done this since the global financial crisis

Dean Christians
2022-06-07
The Macro Index Model, a measure of economic activity, plunged on a month/month basis by the 2nd most significant amount in history. Let's assess the outlook for stocks and commodities after similar growth decelerations.

Key points:

  • The Macro Index Model declined by 27% in the month of May
  • After similar contractions, the S&P 500 showed flat to slightly negative returns 
  • Sector and industry group returns and consistency look more unfavorable
  • Commodities look constructive, especially compared to stocks

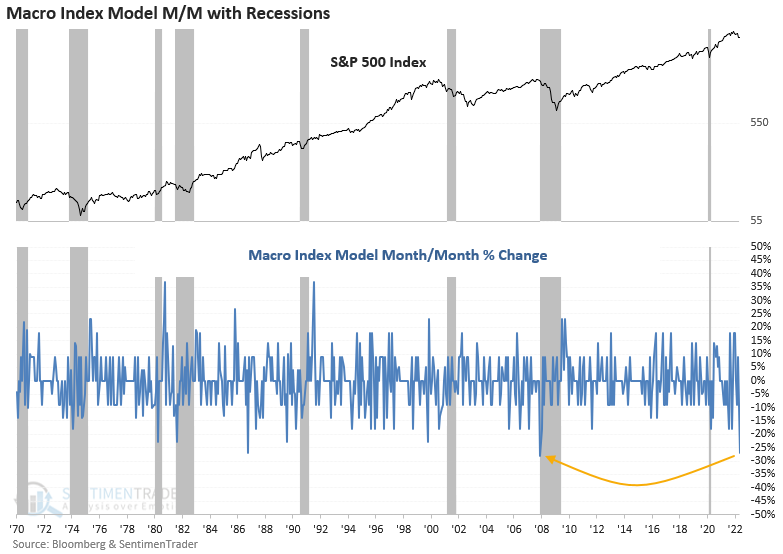
The Macro Index Model plunged on a month/month basis

The SentimenTrader Macro Index Model combines 11 diverse economic indicators to determine the state of the U.S. economy right now. The Index plunged by the 2nd most significant amount in history, with data reporting in May. Powerful m/m contractions occurred just before recessions in 1981-82 and 2007-08. In some instances, like in 1990-91 and 2001, the plunge occurred well ahead of an economic downturn. And 1986 is a reminder that not all significant declines are associated with a recession.

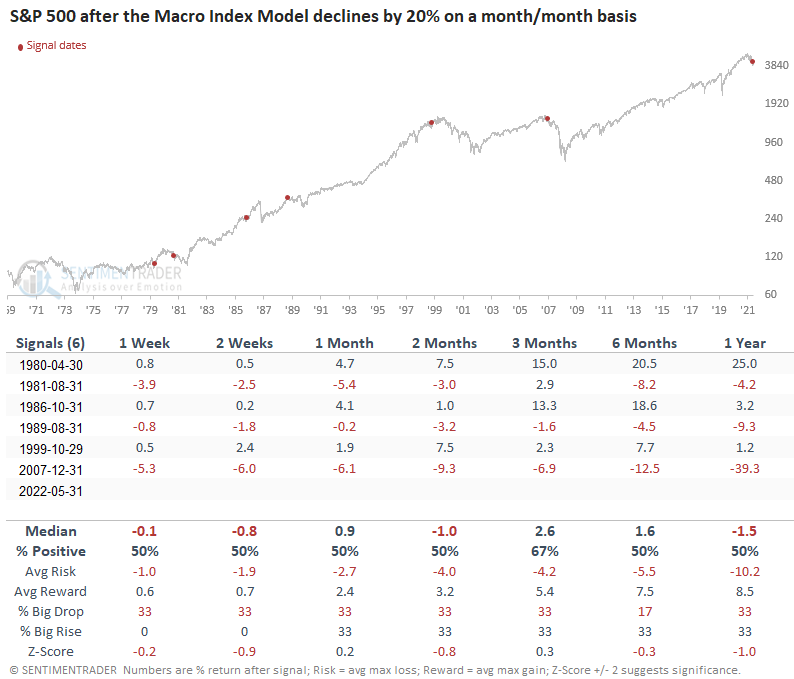
Let's conduct a study to assess the outlook for stocks and commodities after the Macro Index Model declines by 20% or more in a single month.

Similar signals preceded flat to slightly negative returns for the S&P 500

This study generated a signal 6 other times over the past 42 years. After the others, the S&P 500 showed flat to slightly negative returns and a coin toss on the win rate across almost all time frames. While the sample size is small, which is typically the case with economic data, the m/m plunge in the Macro Index Model should act as a friendly reminder that growth decelerations can impact stocks. 

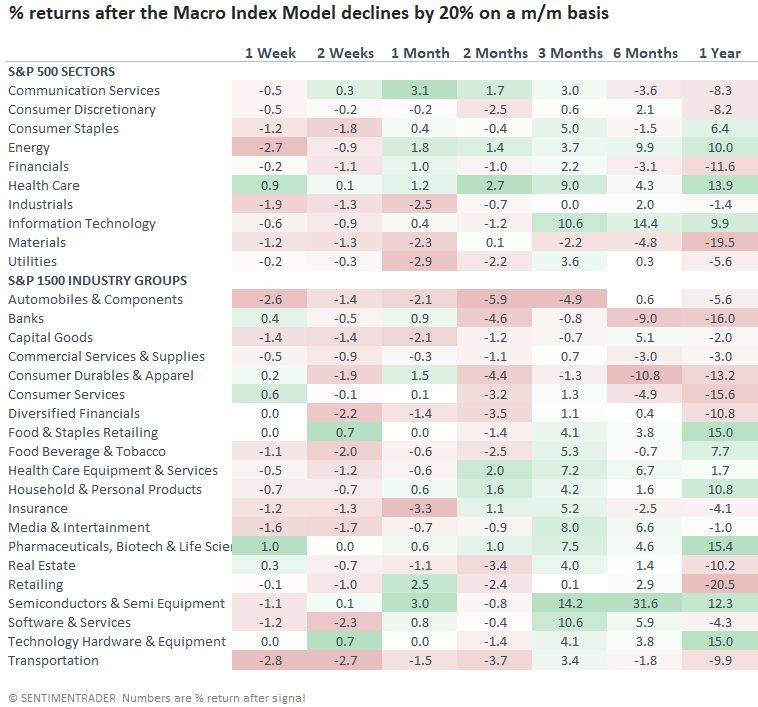
Sector and industry group performance after signals

The sector and industry group table appears more alarming than a broad index like the S&P 500. The slowing economic backdrop looks unfavorable toward most cyclical and value-oriented groups, especially financials/banks. Not surprisingly, defensive-oriented groups perform the best. The historical record for Energy is interesting and supports the case for a continuation of the bullish trend.

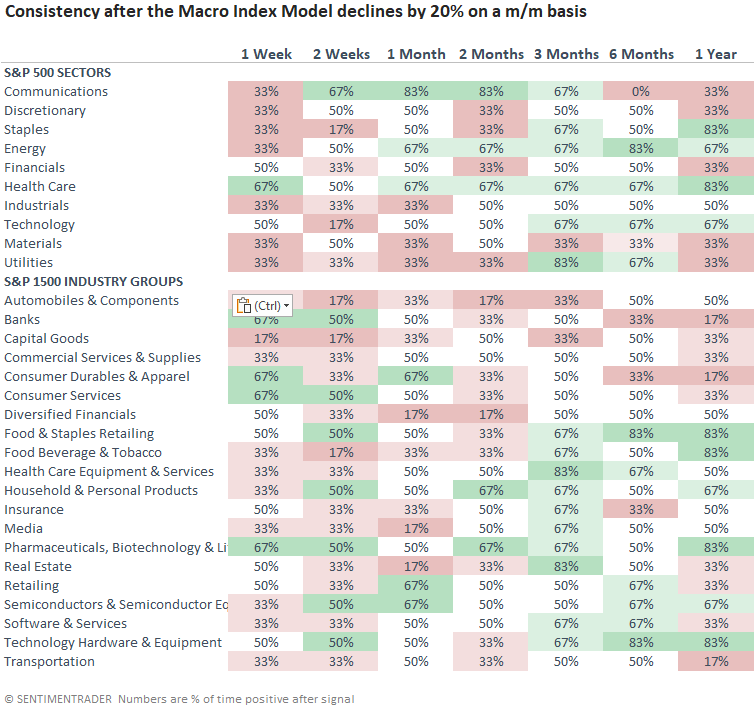
Sector and industry group consistency after signals

Energy, health care, and staples show the most consistent trends, especially in the 3 to 12-month time frames.

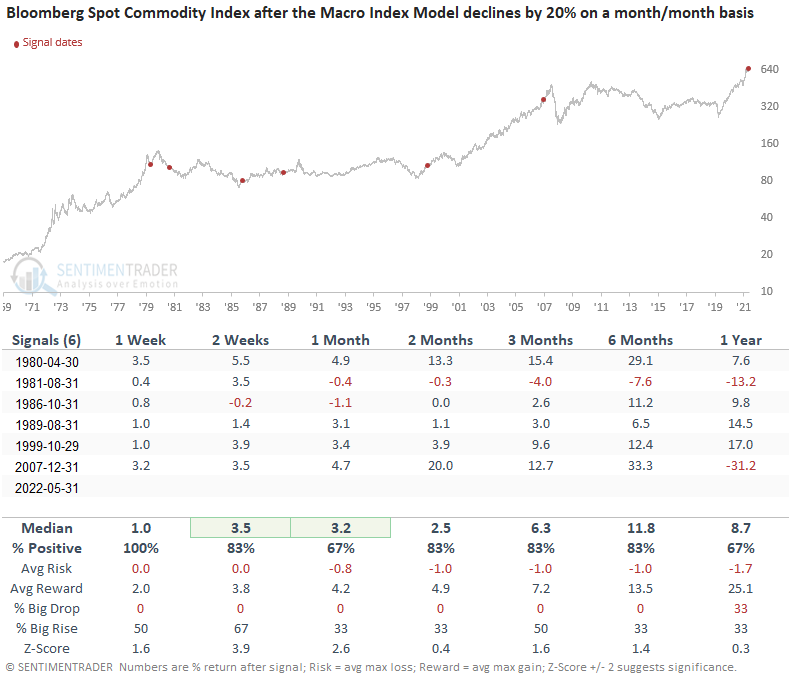
What happens to commodities after signals

The outlook table for commodities suggests the bull market can continue despite the m/m plunge in economic activity. The 33% gain in 6 months after the 2007 signal is a reminder that commodities can disconnect from the economy and stocks in a meaningful way at times.

What the research tells us...

When the Macro Index Model contracts on a month/month basis by 20% or more, we need to be mindful that a deceleration in growth could impact stocks. And the plunge in the Index could also foreshadow a potential recession. Similar setups to what we're seeing now have preceded flat to slightly negative returns for the S&P 500. Applying the signals to sectors and industries suggests one should be tilted toward defensive groups and away from cyclical/value ones. Interestingly, commodities tend to disconnect from stocks and perform well, which is similar to now.

Sorry, you don't have access to this report

Upgrade your subscription plan to get access
Go to Dasboard
PRODUCTS
SentimenTrader
Trading Tools
Indicators & Data API
‍
Strategies & Scanner
‍
Research Reports
FREE
RESOUrCES
Simple Backtest
Calculator
Simple Seasonality
Calculator
The Kelly Criterion
Calculator
Sentiment Geo Map
‍
Public Research Reports
‍
Pricing
Bundle pricing
‍
Announcements
‍
FAQ
COMPANY
‍
About
‍
In the News
‍
Testimonials
‍
Client Success Stories
CONTACT
‍
General Inquiries
‍
Media Inquiries
‍
Financial Professionals Inquiries
‍
© 2025 Sundial Capital Research Inc. All rights reserved.
Setsail Marketing
TermsPrivacyAffiliate Program
Risk Disclosure: Futures and forex trading contains substantial risk and is not for every investor. An investor could potentially lose all or more than the initial investment. Risk capital is money that can be lost without jeopardizing ones’ financial security or life style. Only risk capital should be used for trading and only those with sufficient risk capital should consider trading. Past performance is not necessarily indicative of future results.

Hypothetical Performance Disclosure: Hypothetical performance results have many inherent limitations, some of which are described below. No representation is being made that any account will or is likely to achieve profits or losses similar to those shown; in fact, there are frequently sharp differences between hypothetical performance results and the actual results subsequently achieved by any particular trading program. One of the limitations of hypothetical performance results is that they are generally prepared with the benefit of hindsight. In addition, hypothetical trading does not involve financial risk, and no hypothetical trading record can completely account for the impact of financial risk of actual trading. for example, the ability to withstand losses or to adhere to a particular trading program in spite of trading losses are material points which can also adversely affect actual trading results. There are numerous other factors related to the markets in general or to the implementation of any specific trading program which cannot be fully accounted for in the preparation of hypothetical performance results and all which can adversely affect trading results.

Testimonial Disclosure: Testimonials appearing on this website may not be representative of other clients or customers and is not a guarantee of future performance or success.