
Dumb Money stays negative and fund managers follow

Key points:
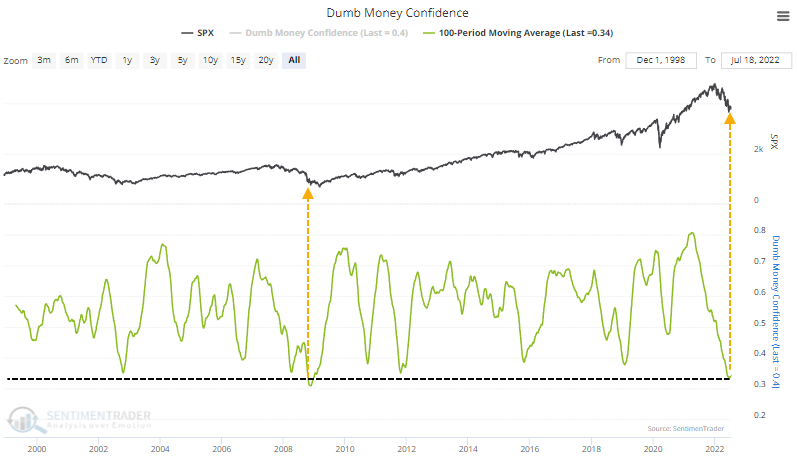
- The 100-day average of Dumb Money Confidence is nearing a record low, exceeded only by October 2008
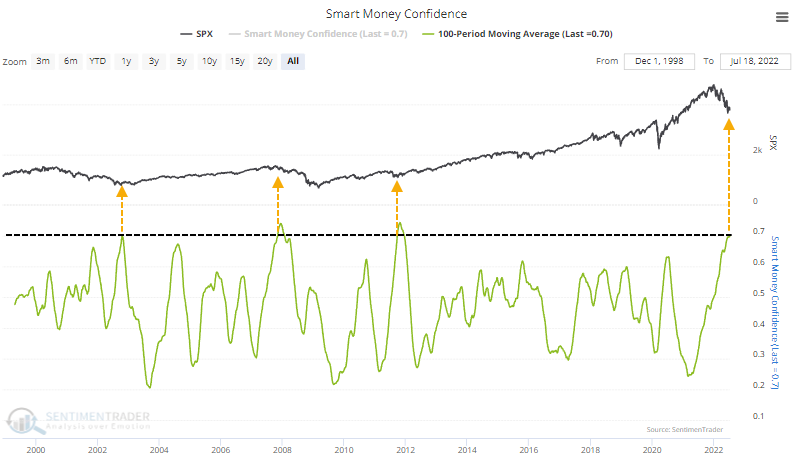
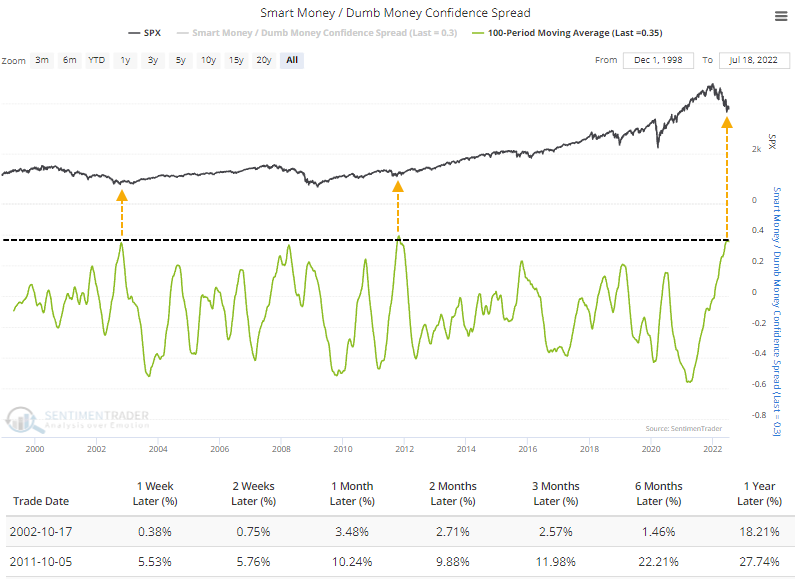
- Smart Money Confidence has remained high, however, so the spread between them is close to a 24-year extreme
- Fund managers have given up along with the Dumb Money, now excessively underweight stocks
Nearing record levels of pessimism
We know now that options traders have been paying up to protect against a crash. The smallest traders have been even more aggressive, on par with the end games of the last two major bear markets.
Sentiment toward stocks needs to be pervasively negative for an extended time to make options traders so confident in buying leveraged, expiring contracts on even more of a decline.
And indeed, it has. The 100-day average of Dumb Money Confidence has dropped to the 2nd-lowest level since we began calculating this in 1998.
Since there are two sides to every coin, there are investors who tend to take the opposite positions of the pure trend-followers in the Dumb Money group. So, Smart Money Confidence is also nearing a record high over the past 100 days. The "smart money" wasn't so smart in late 2007 / early 2008. That's partly due to some of the options and futures market positioning data we watch, which became kind of screwy during the financial crisis. Regardless of the excuse, it was a major failure.
With both indicators at extremes, it stands to reason that the spread between them is also near record territory. The only times in almost 25 years when the 100-day average spread reached this level were October 2002 and October 2011. Long-term returns were excellent after both.
The Dumb Money isn't alone
The pervasive negativity has spread from buyers of money-losing crap and frauds to late adopters of growth stocks to bullish trend-followers to pretty much everyone.
The latest survey of professional money managers by Bank of America showed a stunning drop in sentiment in July. The net percentage of managers who stated they were overweight equities plunged to -44%, the 2nd-lowest level in 20 years. The only time these managers felt more pessimistic about stocks was when the global financial system was on the verge of collapse.
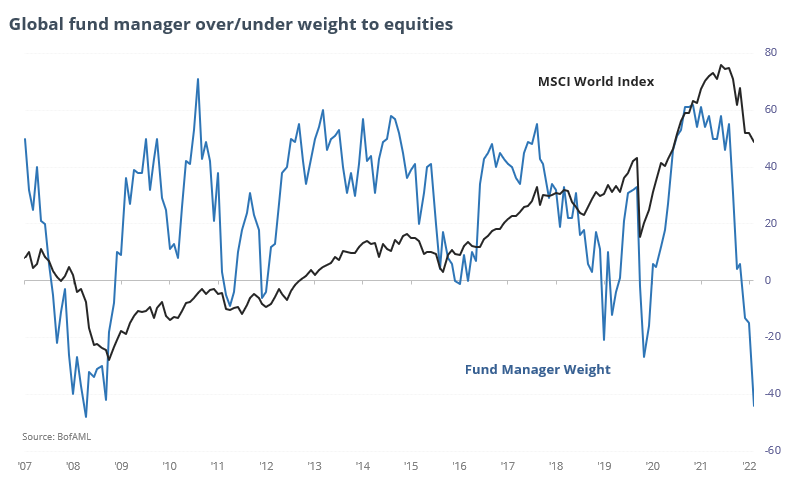
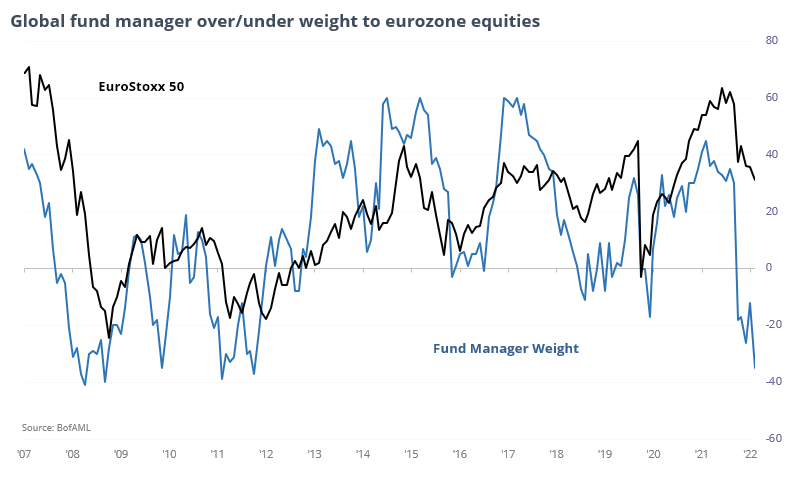
Their exposure to U.S. stocks is underweight but off the worst levels. Thanks to all the well-covered issues, though, that's not the case in the eurozone exposure. Fund manager sentiment is almost the mirror image of a year ago when optimism about easing pandemic restrictions and renewed economic vitality was at the forefront. Now, fund managers are as negative as they were during the near-collapse of financial institutions (2008) and sovereign debt (2011).
What the research tells us...
None of the indicators above are precise timing instruments. Instead, they give a medium- to long-term look at the devastation investors of all stripes feel toward stocks (and most other markets). While some investors feel optimistic, like corporate insiders, nearly all others, across all types of strategies, are despondent. Volatility is almost a given in an environment like this, which means stocks can, and often do, suffer quick and severe bouts of selling pressure. When negativity becomes ingrained, liquidity and trust in rallies are almost non-existent. That makes for a scary and frustrating time for longer-term investors, but the bright side is that when things have gotten this bad, we've been in the final stages of the decline with the worst of the selling pressure behind us.