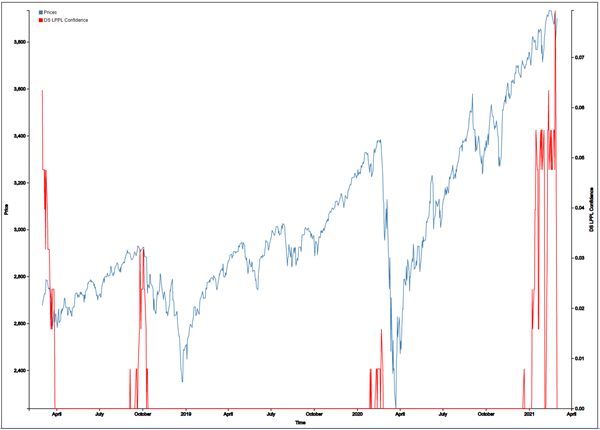
Dumb money has never been so smart
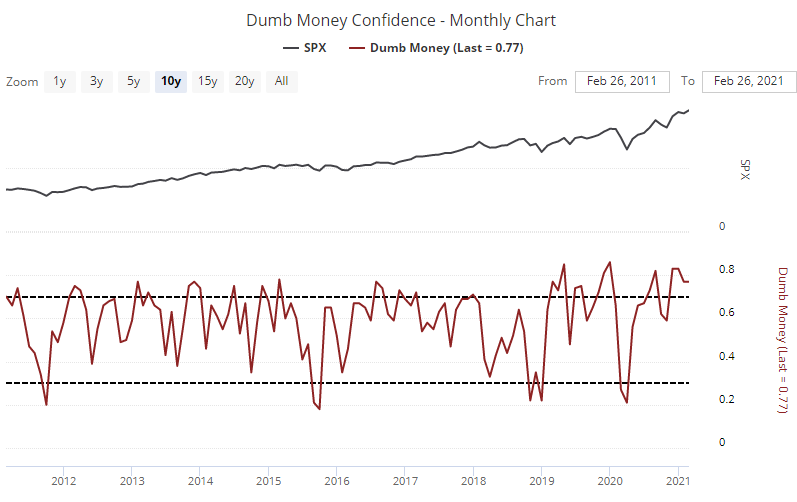
The "dumb money" has been pretty smart lately. To a record degree, actually.
Dumb Money Confidence is a model that incorporates more than a dozen indicators that have a track record of cycling to extremes, and equating with ebbs and flows in sentiment among broad categories of investors.
We update this publicly every month, and the chart shows that it closed February at a very high level.
The term "dumb money" is pejorative and we never intended it that way. It just kind of stuck when we started computing it more than 20 years ago. For the most part, these indicators reflect retail, mom-and-pop types of traders, but certainly not exclusively. Sophisticated institutional investors have just as much propensity to suffer from group-think as everyone else, so determining "smart" and "dumb" is not necessarily straightforward.
The term "dumb" itself needs to be clarified. A more accurate description would simply be "trend-following." Most trend-followers are not dumb - they're positioned correctly during the meats of most major trends. That sounds pretty smart.
Where this term gets its meaning is that because trend-followers use different methodologies, some waiting until trends are well-established, by the time most trend-followers hop on a trend, and most aggressively, is about the time the trend is becoming exhausted. So these traders tend to be the most net long near peaks and least net long (or most net short) near bottoms. Because most investors follow trends to some degree, these indicators tend to capture the behavior of most of the money flowing into and out of markets.
At the same time that these traders are showing aggressively optimistic behavior, Smart Money Confidence in a rally has plunged.
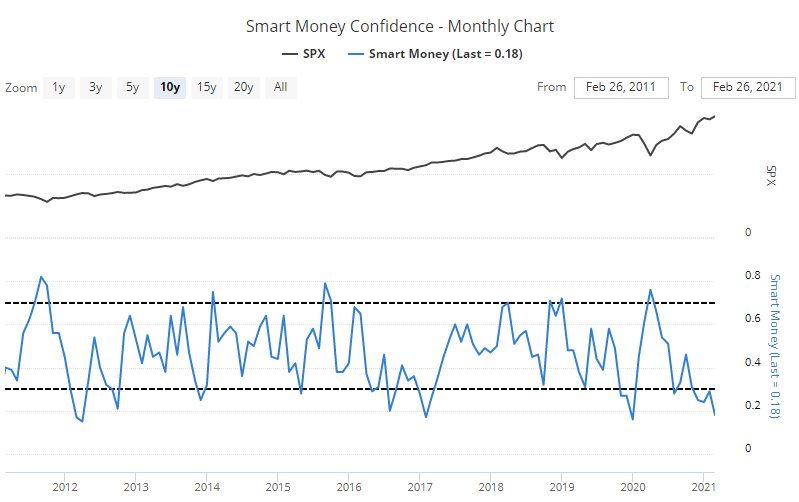
It has been a struggle for stocks to sustain large gains when we see a Smart Money / Dumb Money spread like this.
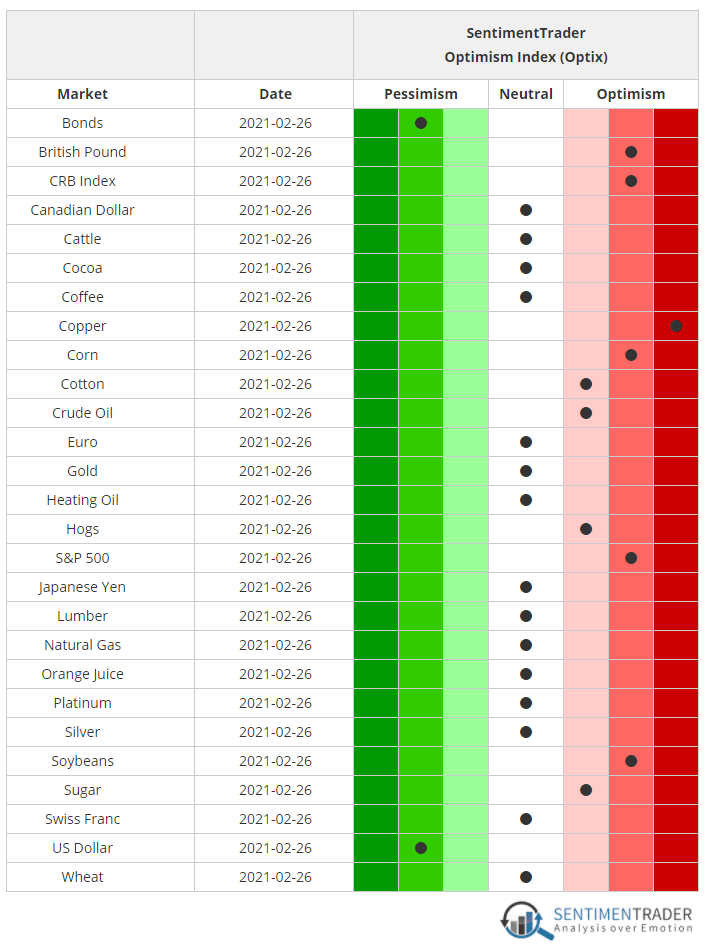
We also update a Market Sentiment overview publicly each month, showing how investors are positioned across various markets. This is showing that as of the end of February, investors were heavily optimistic about stocks and several commodities. That is highly correlated to their pessimism in bonds and the U.S. dollar.
What else we're looking at
- What happens when the S&P hits a new monthly high but closes in the lower part of its range
- Especially when it happens on consecutive months
- A look at the number of stocks with buying climaxes in the S&P 500 and Nasdaq 100
- Why the British pound is looking interesting this month
| Stat Box The S&P 500 enjoyed its largest one-day gain in 9 months on Monday, climbing to within 1% of a record high. Of the 15 other times it did this since 1928, it never failed to make a new high, taking an average of only 2 trading days. |
Sentiment from other perspectives
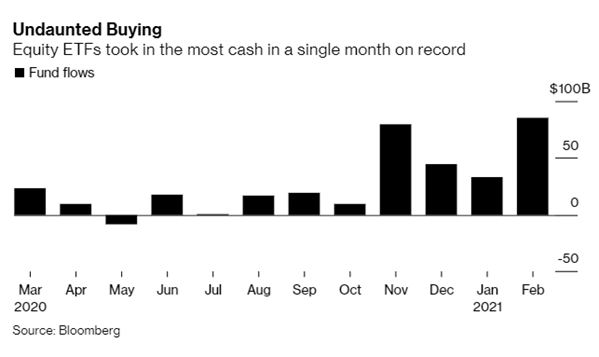
Just keep buying. In the month of February alone, investors added $86 billion to ETFs that track stocks. That's a record amount for any month, and comes on the heels of what had already been 3 months of heavy inflows. Source: Bloomberg
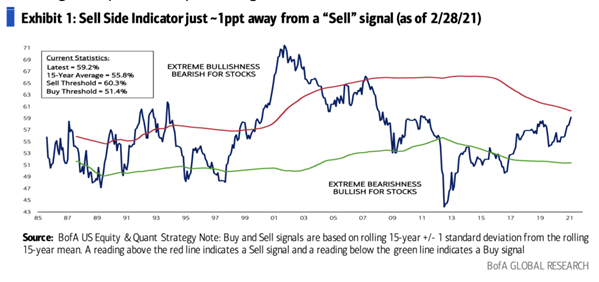
Wall Street is joining them. Strategists on the Street are now recommending the largest equity allocation in a decade, bringing it oh-so-close to the first sell signal since June 2007. Source: Reformed Broker
Bubble go pop? According to one set of models, the S&P 500's probability of being near the end of a bubble is the highest since early 2018. Source: Financial Crisis Observatory
