Data &
Technology
Research
Reports
Report Solutions
Reports Library
Actionable
Strategies
Free
Resources
Simple Backtest Calculator
Simple Seasonality Calculator
The Kelly Criterion Calculator
Sentiment Geo Map
Public Research Reports
Free Webinar
Pricing
Company
About
Meet Our Team
In the News
Testimonials
Client Success Stories
Contact
Log inLoginSign up
< BACK TO ALL REPORTS

Double Trouble

Jason Goepfert
2019-11-15
null

This is an abridged version of our recent reports and notes. For immediate access with no obligation, sign up for a 30-day free trial now.


Double trouble

For the first time in several months, two technical warning signs triggered on the Nasdaq exchange. There hasn’t been a cluster, and they haven’t triggered on the NYSE, but even a single day with both warnings triggering has preceded consistently poor returns for the Nasdaq Composite.

The basic guidelines for the Hindenburg Omen are that the market:

1) must be in an uptrend

2) show a large number of stocks hitting 52-week highs AND 52-week lows and

3) show negatively diverging breadth momentum

The Titanic Syndrome adds that the market must have hit a new high in the past 7 sessions, then all of a sudden there were more stocks hitting 52-week lows than 52-week highs. Both are simply trying to capture times when an index was doing well, but there was strife under the surface.

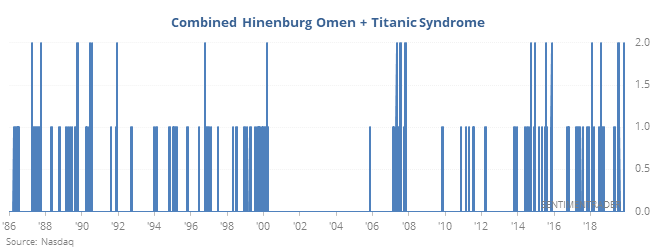
These are not "market crash" indicators. They are only meant to identify times when the risk/reward for stocks over a medium-term time frame is poor. In their decades of real-time use (not cherry-picked, optimized, back-tested data), they have proven to be effective. Not perfect, but nothing is.

What makes it even more rare (and worse) is that both of them triggered on consecutive days. When that happened other times in the past 33 years, the Nasdaq had great difficulty holding any upside momentum.


Bulls are back

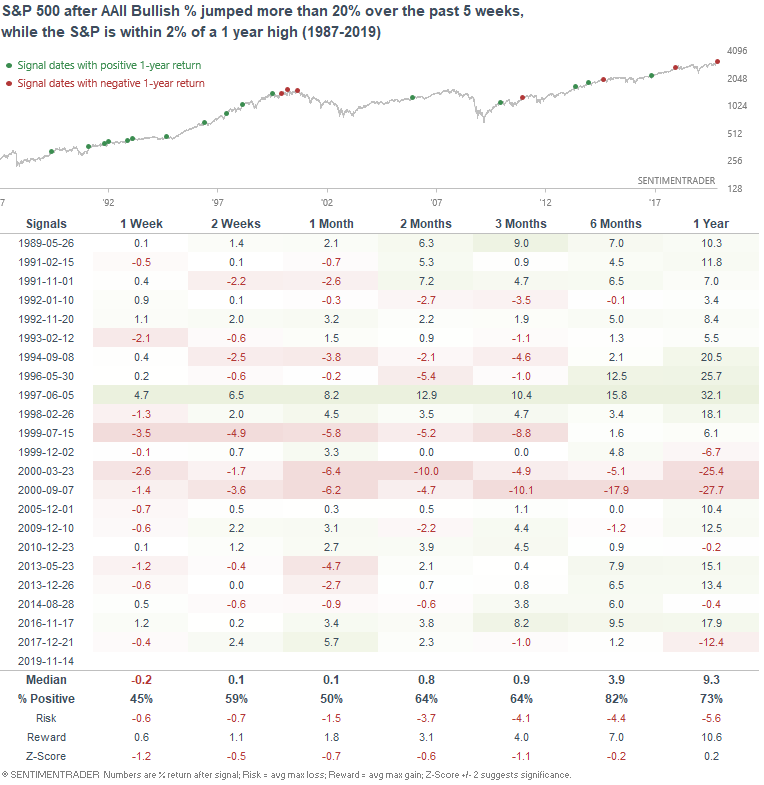
The AAII Bullish % has jumped more than 20% over the past 5 weeks, showing a big reversal in sentiment among individual investors.

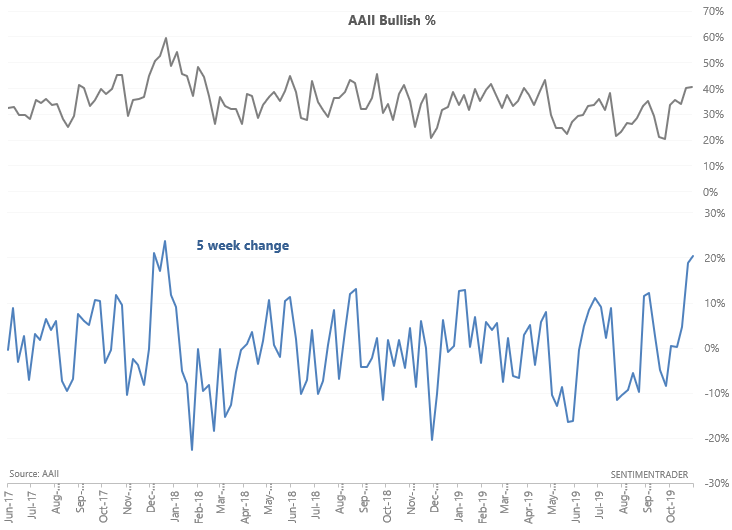
Such jumps in sentiment while the S&P is at or close to a 1 year high saw the S&P experience worse-than-average returns over the next few weeks and months.

We also looked at:

  • S&P is up over 7 days while breadth was negative almost every day
  • The equal-weighted S&P is "undervalued" relative to the cap-weighted index
  • The HiLo Logic Index is very high
  • The put/call ratio is very low
  • A Golden Cross in the yield curve
  • Realized volatility in stocks is plunging
  • Consumer comfort is rolling over
DATA &
TECHnologies
IndicatorEdge
‍
BackTestEdge
‍
Other Tools
‍
DataEdge API
RESEARCH
reports
Research Solution
‍
Reports Library
‍
actionable
Strategies
Trading Strategies
‍
Smart Stock Scanner
‍
FREE
RESOUrCES
Simple Backtest
Calculator
Simple Seasonality
Calculator
The Kelly Criterion
Calculator
Sentiment Geo Map
‍
Public Research Reports
‍
Free Webinar
COMPANY
‍
About
‍
Meet our Team
‍
In the News
‍
Testimonials
‍
Client Success Stories
Pricing
Bundle pricing
‍
Announcements
‍
FAQ
© 2024 Sundial Capital Research Inc. All rights reserved.
Setsail Marketing
TermsPrivacyAffiliate Program
Risk Disclosure: Futures and forex trading contains substantial risk and is not for every investor. An investor could potentially lose all or more than the initial investment. Risk capital is money that can be lost without jeopardizing ones’ financial security or life style. Only risk capital should be used for trading and only those with sufficient risk capital should consider trading. Past performance is not necessarily indicative of future results.

Hypothetical Performance Disclosure: Hypothetical performance results have many inherent limitations, some of which are described below. No representation is being made that any account will or is likely to achieve profits or losses similar to those shown; in fact, there are frequently sharp differences between hypothetical performance results and the actual results subsequently achieved by any particular trading program. One of the limitations of hypothetical performance results is that they are generally prepared with the benefit of hindsight. In addition, hypothetical trading does not involve financial risk, and no hypothetical trading record can completely account for the impact of financial risk of actual trading. for example, the ability to withstand losses or to adhere to a particular trading program in spite of trading losses are material points which can also adversely affect actual trading results. There are numerous other factors related to the markets in general or to the implementation of any specific trading program which cannot be fully accounted for in the preparation of hypothetical performance results and all which can adversely affect trading results.

Testimonial Disclosure: Testimonials appearing on this website may not be representative of other clients or customers and is not a guarantee of future performance or success.