Data &
Technology
Research
Reports
Report Solutions
Reports Library
Actionable
Strategies
Free
Resources
Simple Backtest Calculator
Simple Seasonality Calculator
The Kelly Criterion Calculator
Sentiment Geo Map
Public Research Reports
Free Webinar
Pricing
Company
About
Meet Our Team
In the News
Testimonials
Client Success Stories
Contact
Log inLoginSign up
< BACK TO ALL REPORTS

Don't Sell Just Because the Defense Is on the Field

Jason Goepfert
2021-09-03
On the latest run to new highs, defensive sectors like Utilities and Health Care have outpaced gains in the S&P 500.

Since the start of the quarter, an odd thing has happened. A couple of the most defensive sectors in the market have far outpaced the momentum run in the S&P 500. 

As noted in the Wall Street Journal:

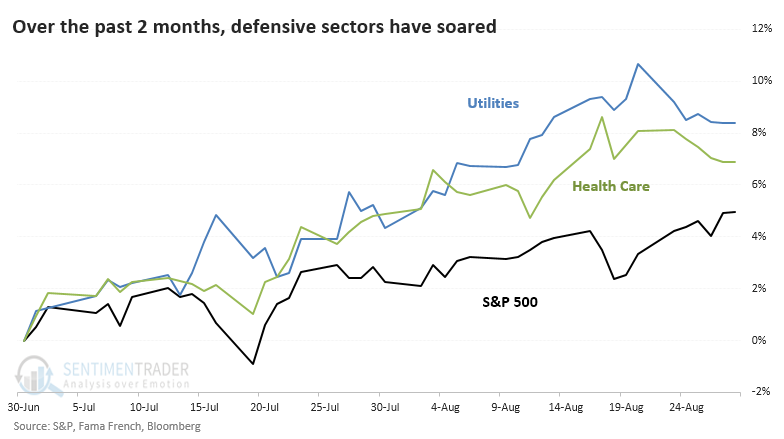
"Some of the hottest stocks in the U.S. are pointing to an economic cool-down. Utilities and healthcare are among the best-performing groups in the S&P 500 so far this quarter, with gains of 7.8% and 6.6%, respectively, compared with a 4.9% rise in the broad stock index."

This can be an issue for some investors because:

"The gains are noteworthy because investors typically pile into those types of stocks when they are expecting the outlook to darken. Visits to the doctor and electricity use are less apt to decline in a pinch than spending on vacations or new furniture.

But rallies in these so-called defensive sectors can presage broader market retreats, investors say, potentially spelling out a fresh test for a market whose post-pandemic rise has surprised many stock-market bulls."

We can see the relatively impressive rise in those two sectors versus the S&P in the chart below.

Utilities and Health Care versus S&P 500

So, should we worry? Is this really a sign that investors are doubting the recovery and stocks are about to tumble?

Meh.

We looked at every time since 1928 when the S&P 500 closed at an all-time high, with more than a 4% gain over the past two months. But during those two-month stretches, both Utilities and Health Care outpaced the gains in the S&P by at least +2%. Over the following year, the S&P rose 9 out of 12 times, averaging a return of +12.0%.


What else we're looking at

  • Full details on defensive-led new highs in the S&P
  • How these signals compared to the opposite condition, and how sectors and factors performed
  • Copper declined right on cue
  • A thrust concept using composite breadth metrics

Stat box

For the 1st time in its history, the ETHE Ethereum Trust is working on its 7th consecutive week of rising prices.

Etcetera

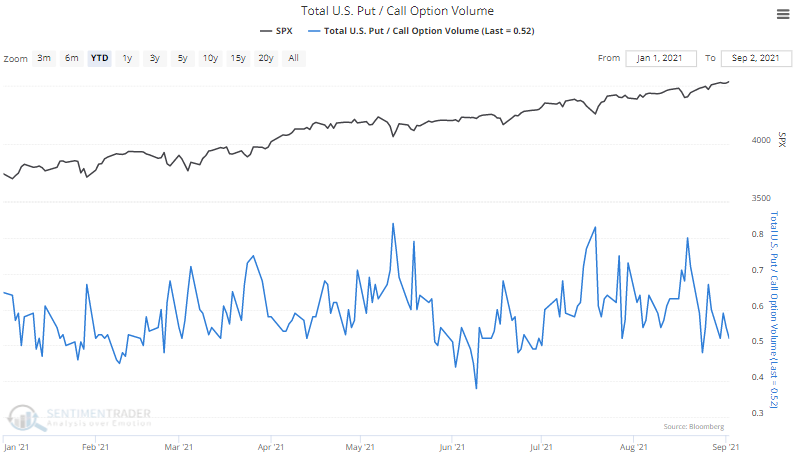
Hedging pullback. Put option volume in the U.S. has dwindled relative to call volume in recent days as traders see the futility of hedging against the risk of what has been a record-setting uptrend in stocks.

total us put call ratio

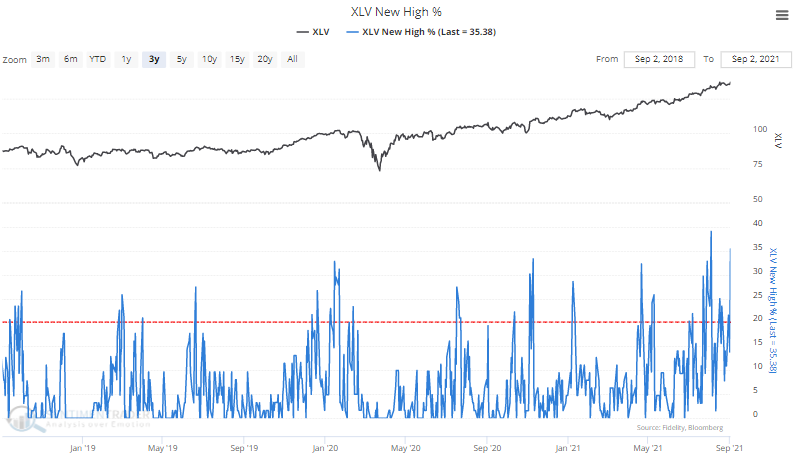
A healthy uptrend. More than a third of Health Care stocks have soared to 52-week highs in recent days, nearly the most in 3 years.

health care xlv members at 52 week high

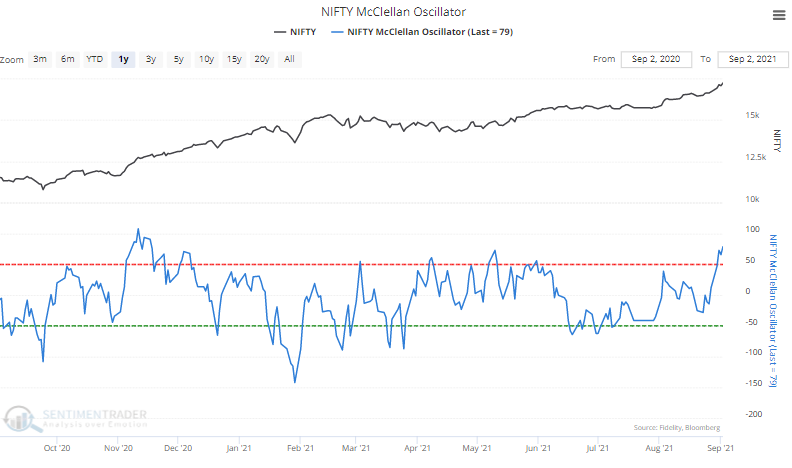
Nifty rally. The Nifty 50 index of Indian stocks has shown incredible momentum of late, and the McClellan Oscillator - a measure of internal breadth momentum - is at its 2nd-highest level in a year.

nifty 50 indian stocks mcclellan oscillator

DATA &
TECHnologies
IndicatorEdge
‍
BackTestEdge
‍
Other Tools
‍
DataEdge API
RESEARCH
reports
Research Solution
‍
Reports Library
‍
actionable
Strategies
Trading Strategies
‍
Smart Stock Scanner
‍
FREE
RESOUrCES
Simple Backtest
Calculator
Simple Seasonality
Calculator
The Kelly Criterion
Calculator
Sentiment Geo Map
‍
Public Research Reports
‍
Free Webinar
COMPANY
‍
About
‍
Meet our Team
‍
In the News
‍
Testimonials
‍
Client Success Stories
Pricing
Bundle pricing
‍
Announcements
‍
FAQ
© 2024 Sundial Capital Research Inc. All rights reserved.
Setsail Marketing
TermsPrivacyAffiliate Program
Risk Disclosure: Futures and forex trading contains substantial risk and is not for every investor. An investor could potentially lose all or more than the initial investment. Risk capital is money that can be lost without jeopardizing ones’ financial security or life style. Only risk capital should be used for trading and only those with sufficient risk capital should consider trading. Past performance is not necessarily indicative of future results.

Hypothetical Performance Disclosure: Hypothetical performance results have many inherent limitations, some of which are described below. No representation is being made that any account will or is likely to achieve profits or losses similar to those shown; in fact, there are frequently sharp differences between hypothetical performance results and the actual results subsequently achieved by any particular trading program. One of the limitations of hypothetical performance results is that they are generally prepared with the benefit of hindsight. In addition, hypothetical trading does not involve financial risk, and no hypothetical trading record can completely account for the impact of financial risk of actual trading. for example, the ability to withstand losses or to adhere to a particular trading program in spite of trading losses are material points which can also adversely affect actual trading results. There are numerous other factors related to the markets in general or to the implementation of any specific trading program which cannot be fully accounted for in the preparation of hypothetical performance results and all which can adversely affect trading results.

Testimonial Disclosure: Testimonials appearing on this website may not be representative of other clients or customers and is not a guarantee of future performance or success.