
Don't give up on Santa just yet

Key Points
- The end of the year tends to be bullish for stocks
- The strength often last into the first several trading days of the following year
- Despite tendencies, the fact remains that there are no "sure things" in the market
Defining the Santa Claus Rally period
The late, great Yale Hirsch, the founder of Stock Trader's Almanac, first coined the "Santa Claus rally" as seven days comprised of the last five trading days of the calendar year PLUS the first two trading days of the following year, using the S&P 500 Index.
A gentleman I worked with for several years - the late, great Jerry Minton - developed his own period that involved the last seven calendar days of the year using the S&P Midcap 400 Index.
For our test, we will sort of mash these two together and look at the results for holding the S&P 500 Index for nine trading days, comprised of the last seven trading days of the calendar year and the first two days of the following year. The 2021-2022 period involves buying an S&P 500 Index fund at the close on 12/21 and selling at the close on 1/5/2022.
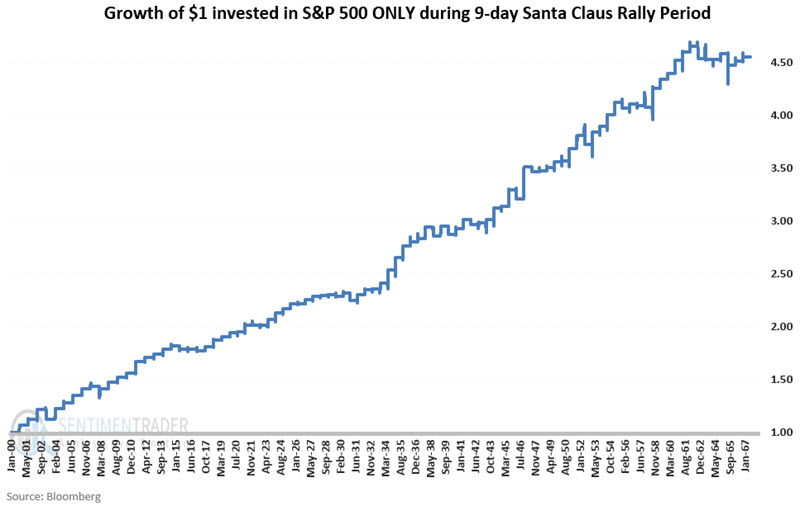
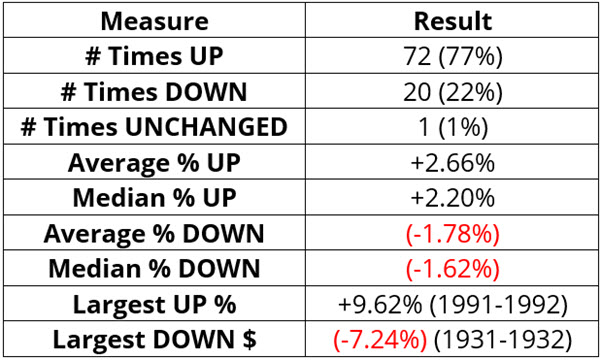
A history of consistent gains with only periodic, small losses
The chart below displays the growth of $1 invested in the S&P 500 Index each year ONLY during the nine days identified above, starting in December 1928.
When we look at returns for the individual years, we can see that losses were rare, and large losses were almost unheard of.
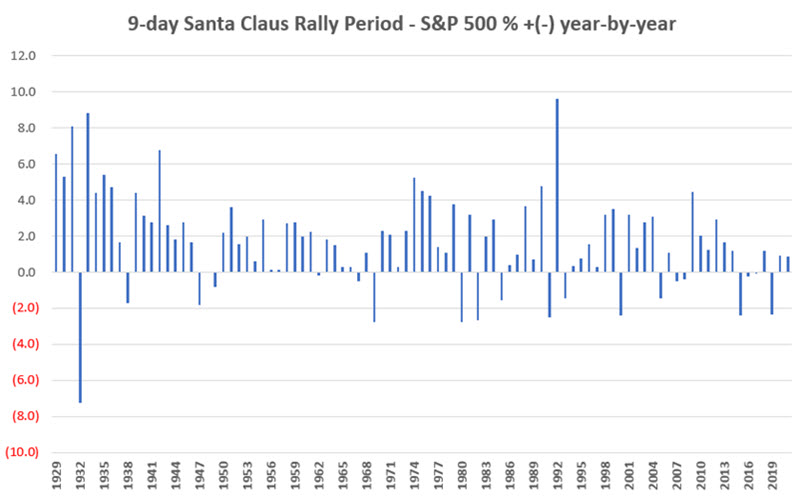
Over the past 92 years, 72 of them showed a gain, with a median gain well above the median loss.
What the research tells us:
The S&P 500 Index has displayed a tendency to rally at the end of the year and into the new year. That said, a 77% Win Rate should not be confused with a 100% Win Rate, and traders considering playing the Santa Claus Rally must be aware of the risk of loss. On the more optimistic side, beyond the -7.24% loss during 1931-1932, the worst loss was just -2.78% in 1968-1969.