Data &
Technology
Research
Reports
Report Solutions
Reports Library
Actionable
Strategies
Free
Resources
Simple Backtest Calculator
Simple Seasonality Calculator
The Kelly Criterion Calculator
Sentiment Geo Map
Public Research Reports
Free Webinar
Pricing
Company
About
Meet Our Team
In the News
Testimonials
Client Success Stories
Contact
Log inLoginSign up
< BACK TO ALL REPORTS

Dollar Index (DXY) Surge on Fed Decision Day - Part 2

Dean Christians
2021-06-18
Let's assess the forward return outlook for stocks, commodities, and bonds when the Dollar Index (DXY) surges on an FOMC decision day.

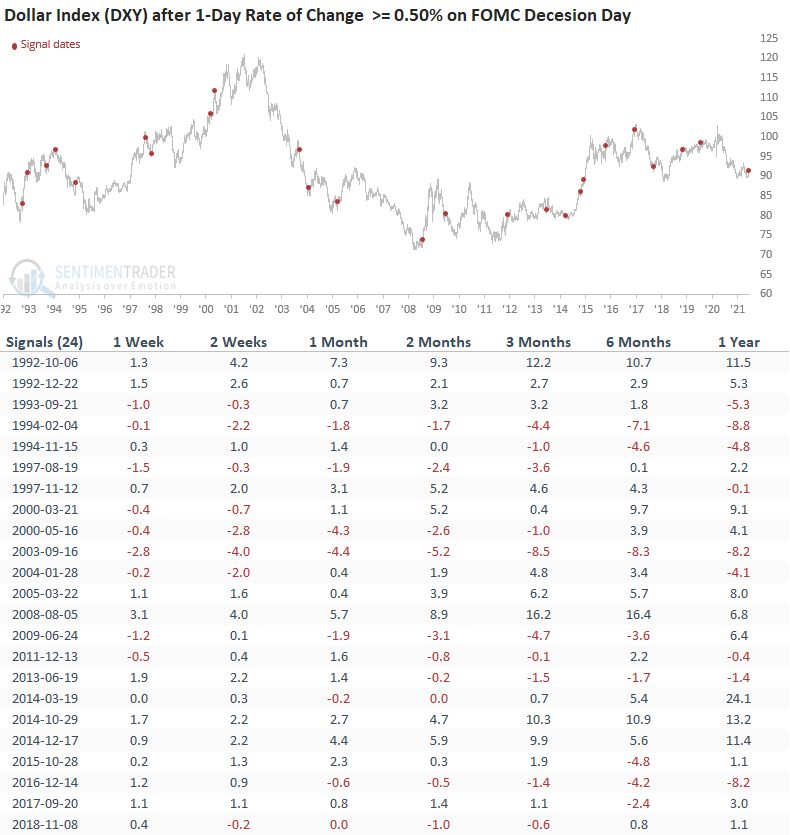
In an intraday update on Thursday, I shared a study to assess the Dollar Index (DXY) outlook when it surged by 90 bps or more on an FOMC decision day. The results returned a minimal sample size, so I relaxed the 1-day rate of change level from 90 to 50 bps to capture more instances.

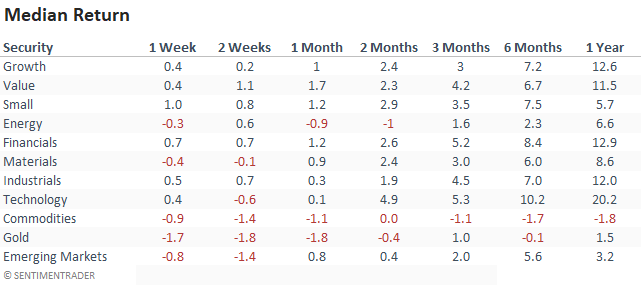
Let's continue with the same study and assess the potential outlook for stocks, commodities, and bonds when the DXY surges by 50 bps or more on an FOMC decision day.

While one day does not make a trend, the potential implications of a continuation from the FOMC decision day surge could be meaningful, as the data will show.

HOW THE SIGNALS PERFORMED

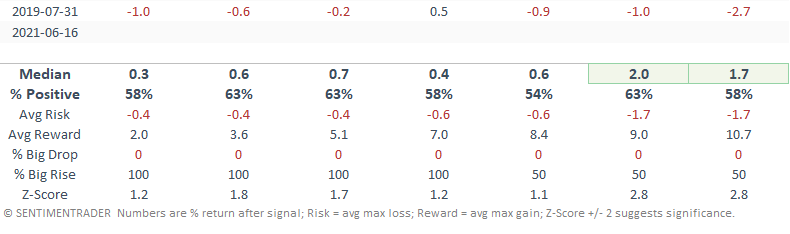
The results suggest that the Dollar Index (DXY) could be on the cusp of a potential trend change.

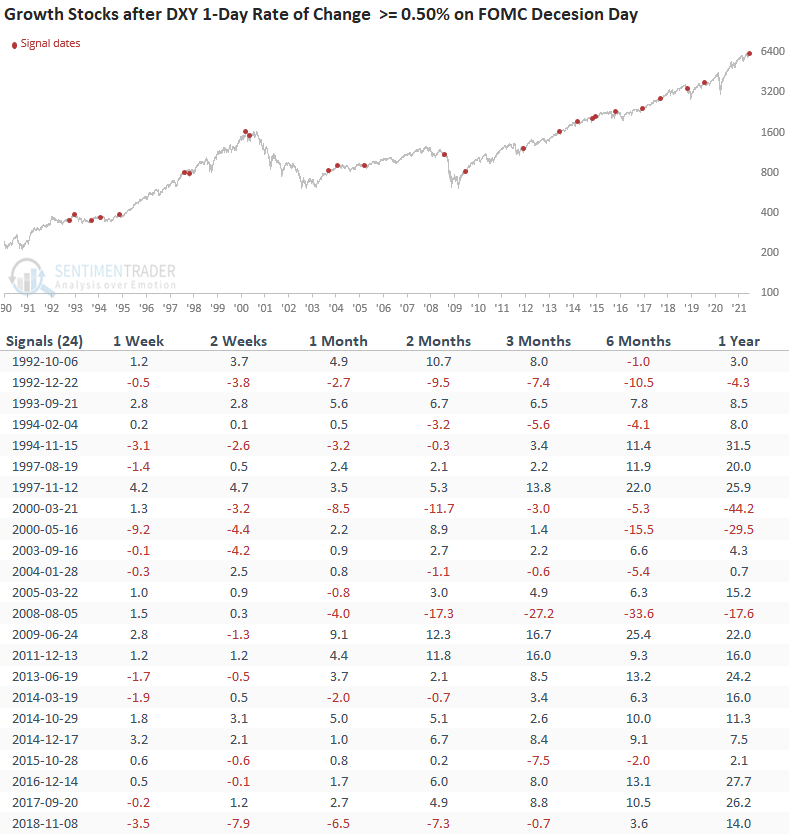
HOW THE SIGNALS PERFORMED - GROWTH

Growth stocks look slightly weak in the short term, with results that get a little better in the 3-12 month timeframe. 

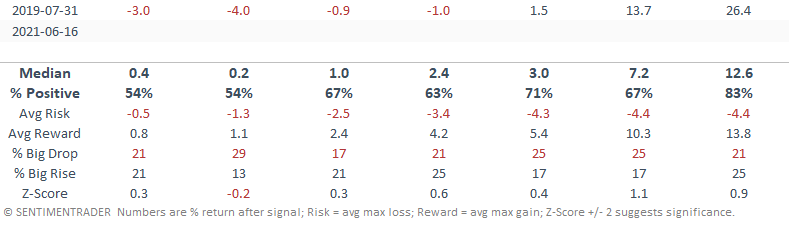
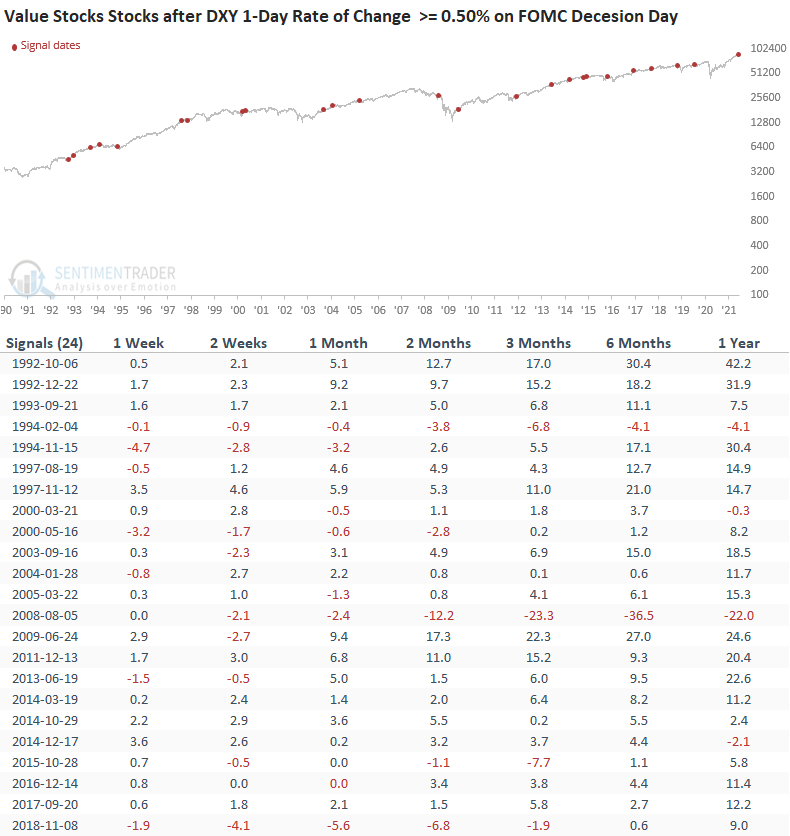
HOW THE SIGNALS PERFORMED - VALUE

Value stocks look solid across all timeframes. I would also note the consistency in the 6-month forward returns.

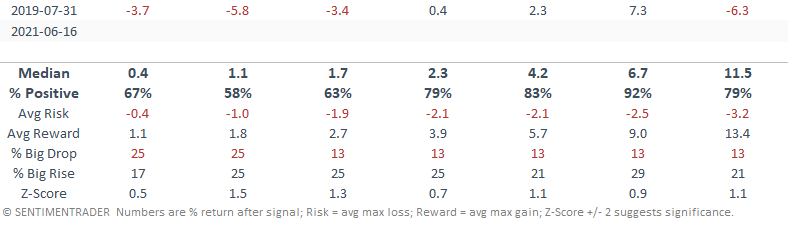
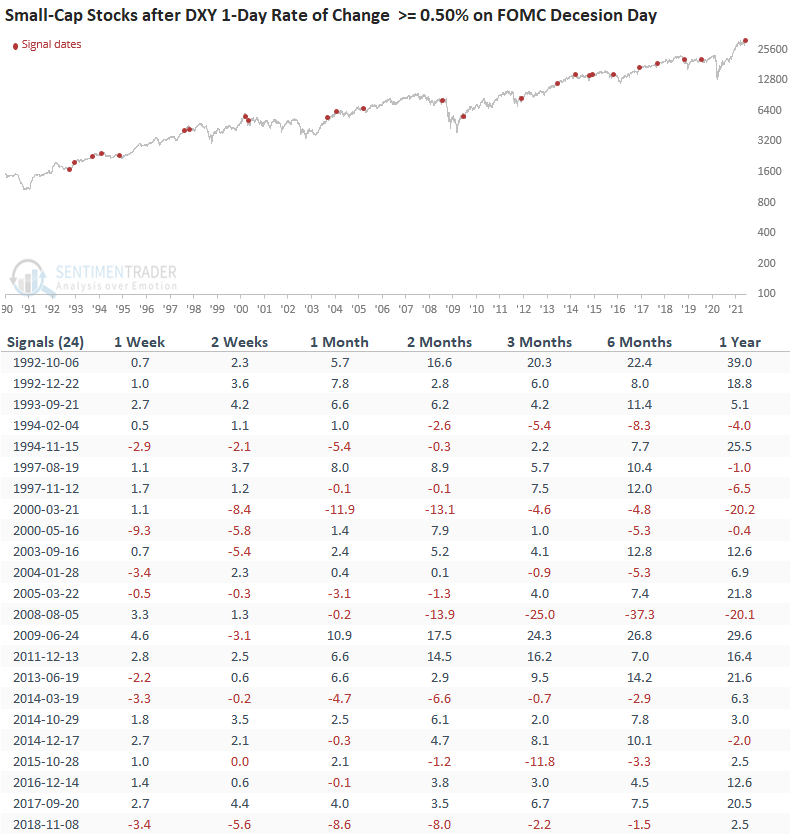
HOW THE SIGNALS PERFORMED - SMALL-CAP

Small-cap stocks are somewhat of a mixed bag. I don't see anything that stands out.

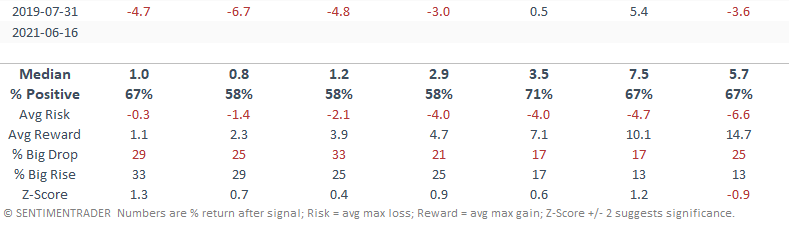
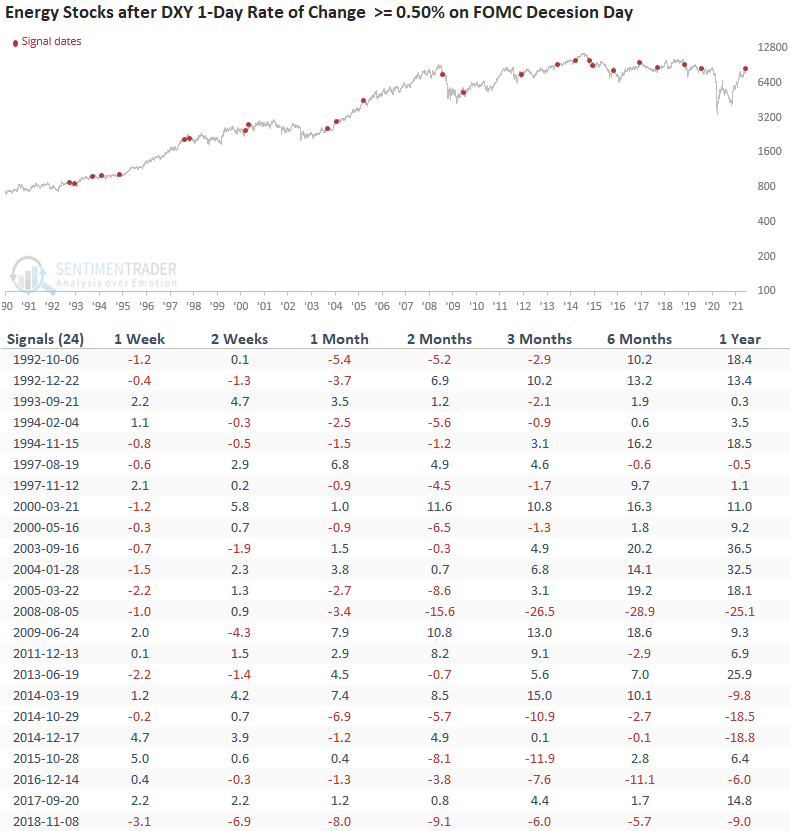
HOW THE SIGNALS PERFORMED - ENERGY

Energy is consistently weak across all timeframes. If the dollar is transitioning to a bullish trend, energy stocks could struggle.

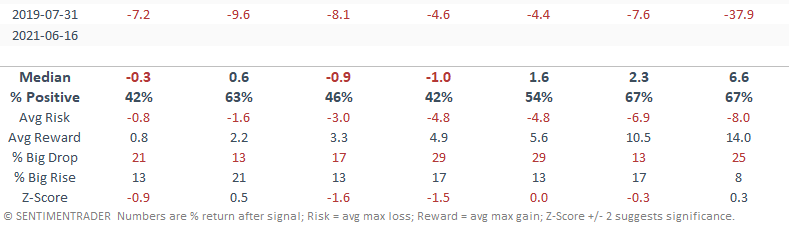
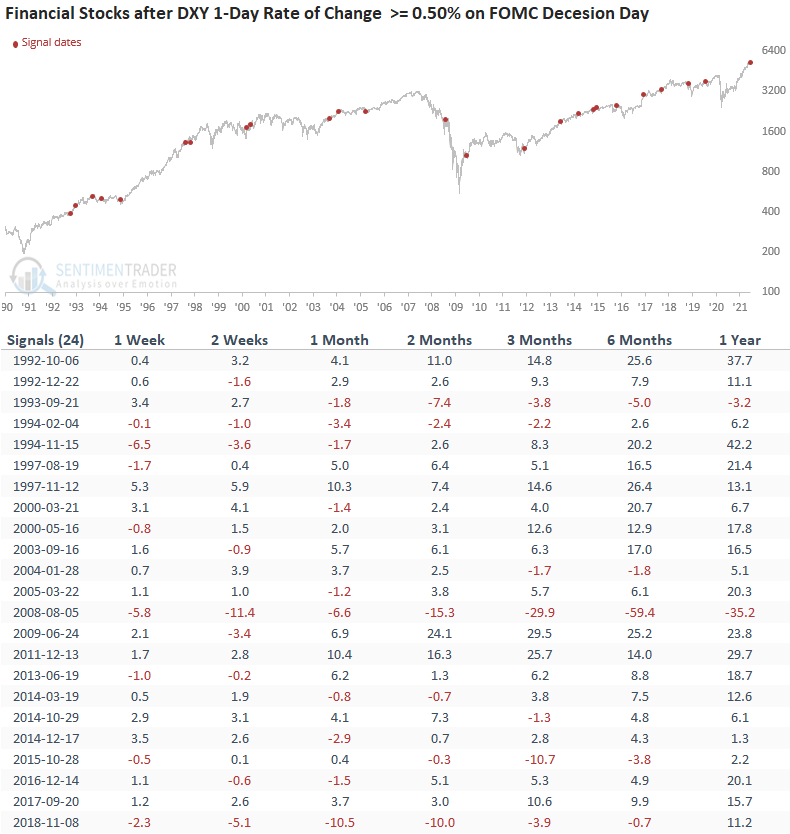
HOW THE SIGNALS PERFORMED - Financials

Financials look pretty good, especially in the 3-12 month timeframes.

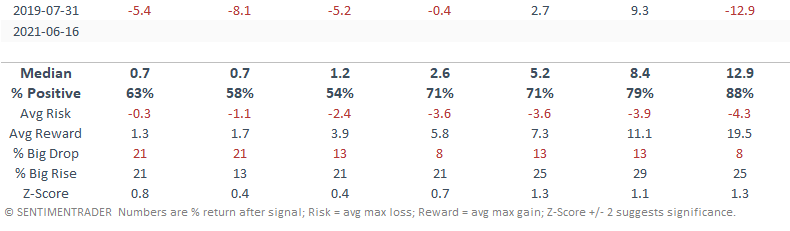
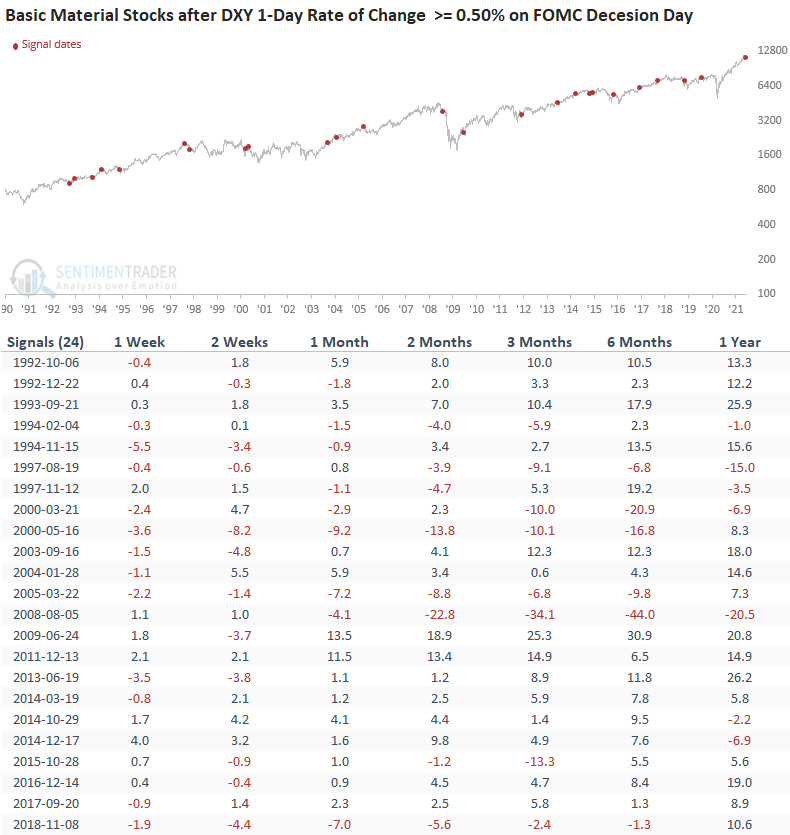
HOW THE SIGNALS PERFORMED - BASIC MATERIALS

Materials look slightly weak in the short term, with results that get a little better in the 2-12 month timeframe.

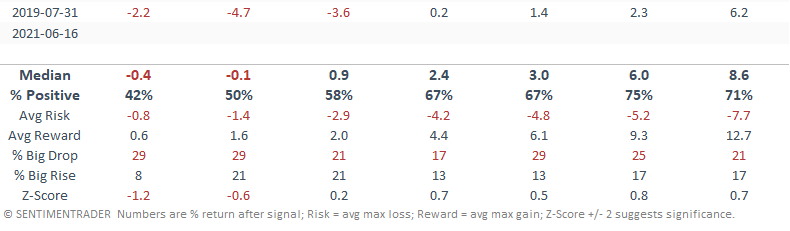
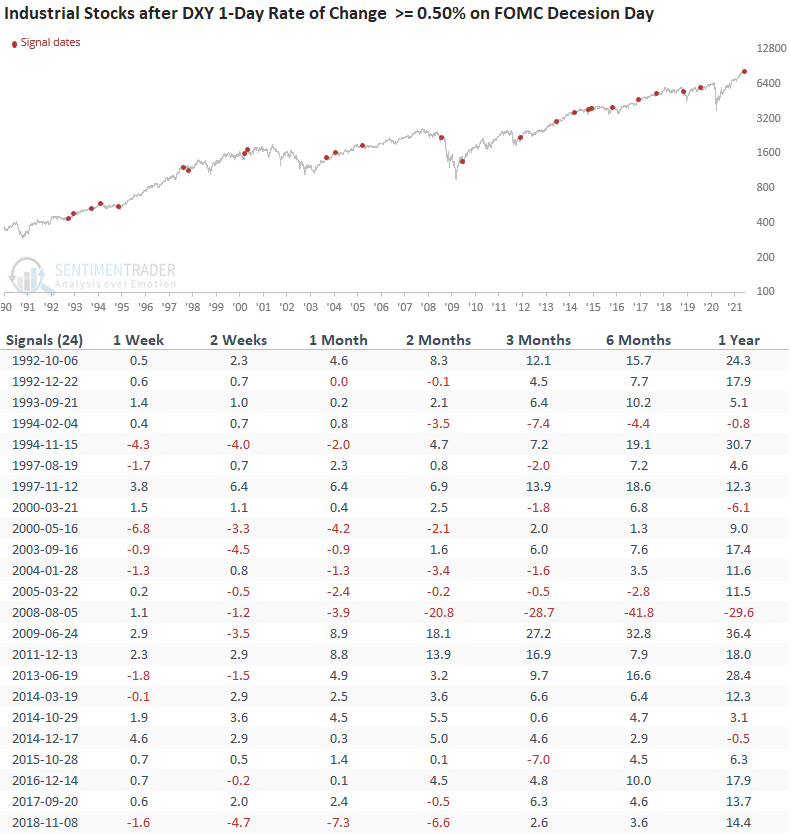
HOW THE SIGNALS PERFORMED - Industrial

Industrials look slightly better to inline in the short term with much better results in the 3-12 timeframe.

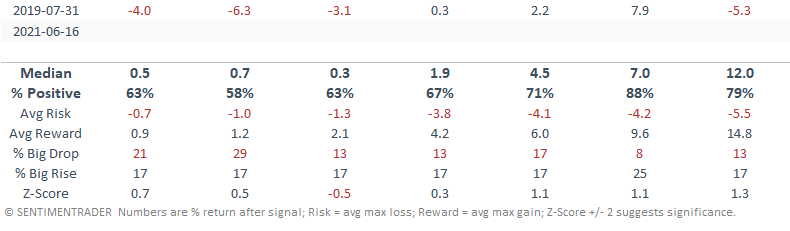
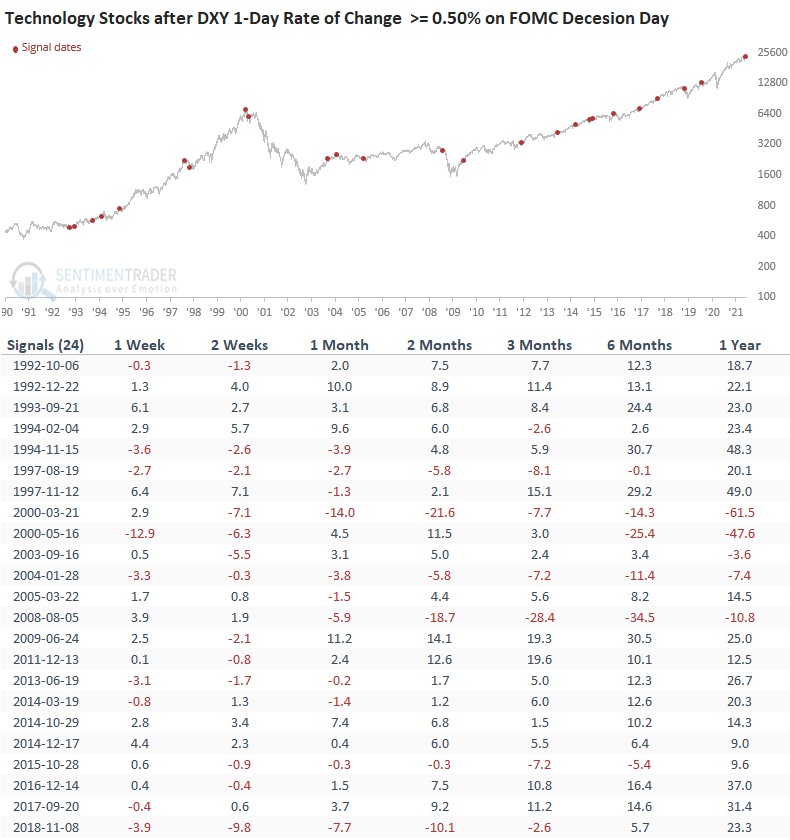
HOW THE SIGNALS PERFORMED - Technology

Technology looks weak in the short term, with much better results in the 2-12 timeframe.

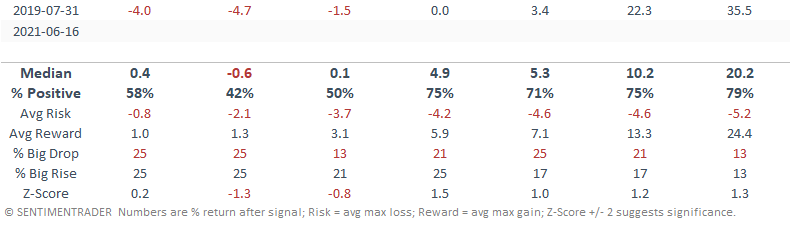
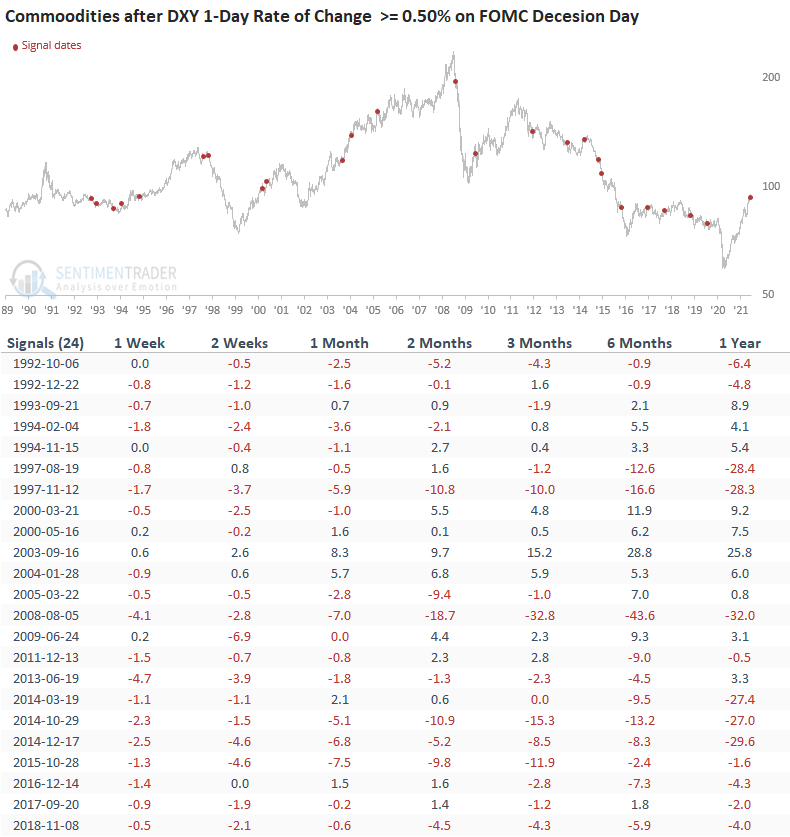
HOW THE SIGNALS PERFORMED - COMMODITIES

Commodities look weak across all timeframes as a strong dollar is unfriendly to the asset class.

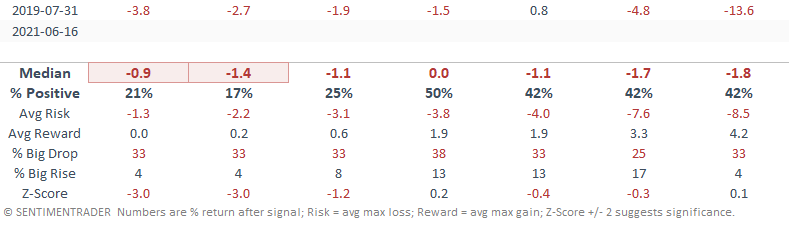
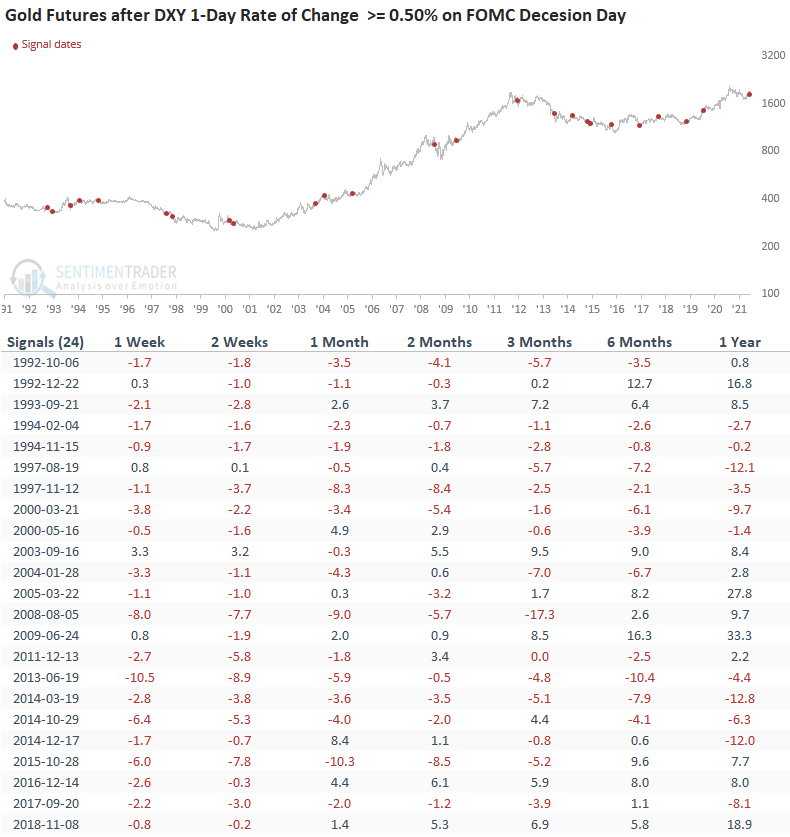
HOW THE SIGNALS PERFORMED - GOLD

As expected, Gold's results are abysmal. 

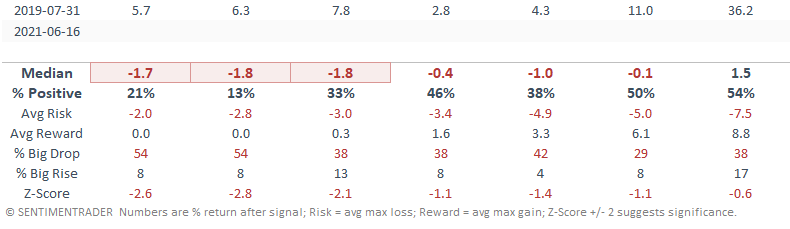
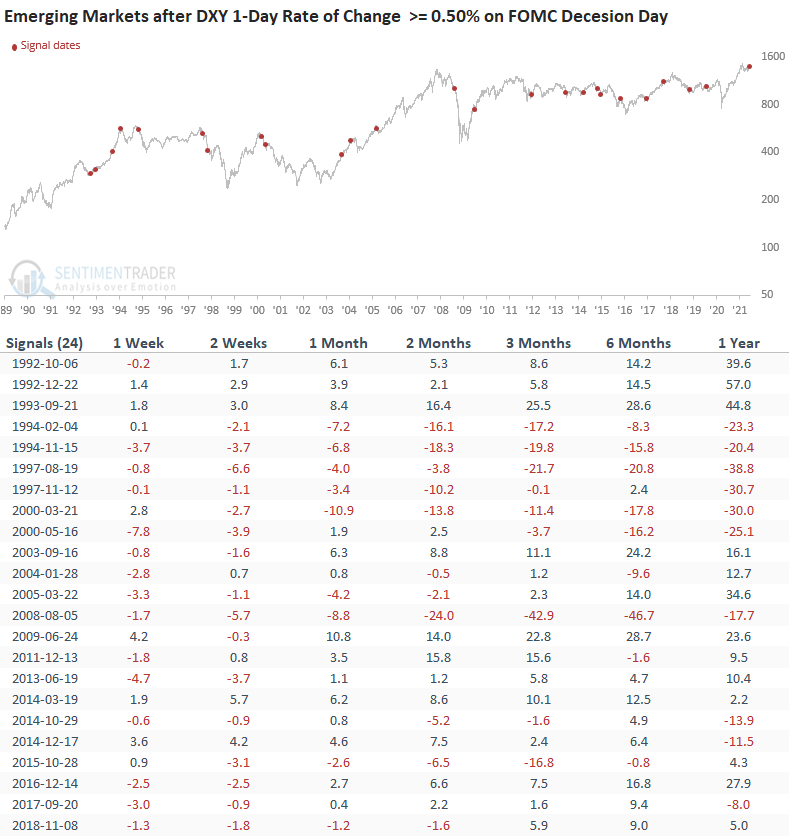
HOW THE SIGNALS PERFORMED - EMERGING MARKETS

Emerging markets look weak across all timeframes, especially in the short term. A strong dollar is a problem for EM.

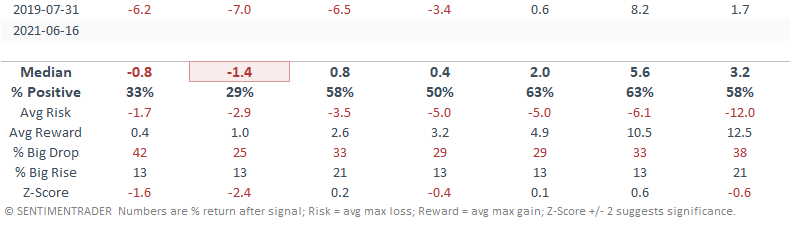
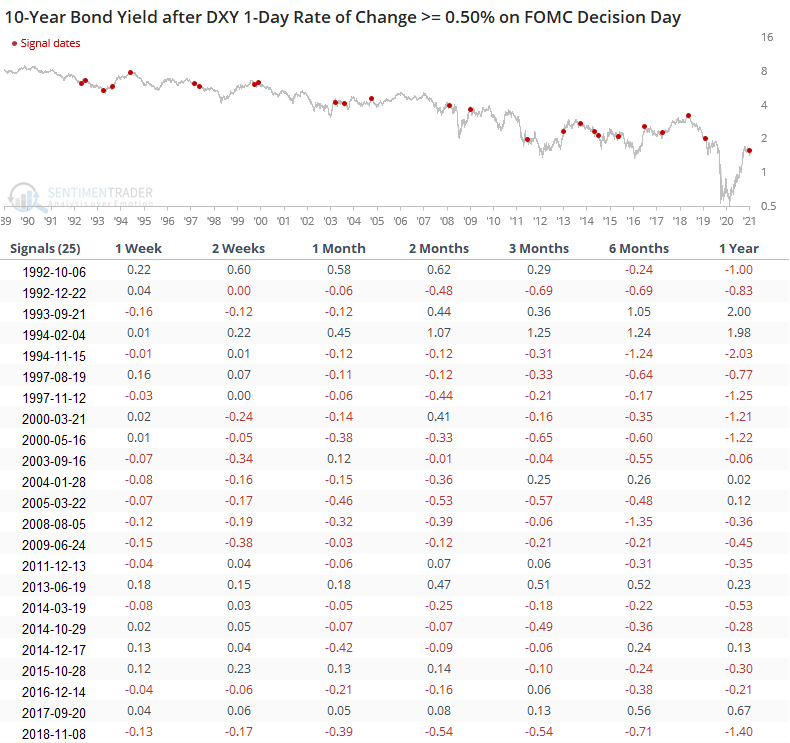
HOW THE SIGNALS PERFORMED - 10-YEAR BOND YIELD
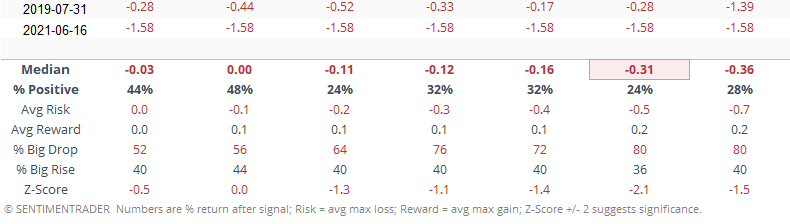
PERFORMANCE SUMMARY

The 1-4 week results suggest that the market could struggle a little in the short term as investors grapple with the potential of a stronger dollar. I would keep an eye on the DXY and the critical resistance area just above $93. A break above that level would suggest that a new uptrend is unfolding.


Sorry, you don't have access to this report

Upgrade your subscription plan to get access
Go to Dasboard
DATA &
TECHnologies
IndicatorEdge
‍
BackTestEdge
‍
Other Tools
‍
DataEdge API
RESEARCH
reports
Research Solution
‍
Reports Library
‍
actionable
Strategies
Trading Strategies
‍
Smart Stock Scanner
‍
FREE
RESOUrCES
Simple Backtest
Calculator
Simple Seasonality
Calculator
The Kelly Criterion
Calculator
Sentiment Geo Map
‍
Public Research Reports
‍
Free Webinar
COMPANY
‍
About
‍
Meet our Team
‍
In the News
‍
Testimonials
‍
Client Success Stories
Pricing
Bundle pricing
‍
Announcements
‍
FAQ
© 2024 Sundial Capital Research Inc. All rights reserved.
Setsail Marketing
TermsPrivacyAffiliate Program
Risk Disclosure: Futures and forex trading contains substantial risk and is not for every investor. An investor could potentially lose all or more than the initial investment. Risk capital is money that can be lost without jeopardizing ones’ financial security or life style. Only risk capital should be used for trading and only those with sufficient risk capital should consider trading. Past performance is not necessarily indicative of future results.

Hypothetical Performance Disclosure: Hypothetical performance results have many inherent limitations, some of which are described below. No representation is being made that any account will or is likely to achieve profits or losses similar to those shown; in fact, there are frequently sharp differences between hypothetical performance results and the actual results subsequently achieved by any particular trading program. One of the limitations of hypothetical performance results is that they are generally prepared with the benefit of hindsight. In addition, hypothetical trading does not involve financial risk, and no hypothetical trading record can completely account for the impact of financial risk of actual trading. for example, the ability to withstand losses or to adhere to a particular trading program in spite of trading losses are material points which can also adversely affect actual trading results. There are numerous other factors related to the markets in general or to the implementation of any specific trading program which cannot be fully accounted for in the preparation of hypothetical performance results and all which can adversely affect trading results.

Testimonial Disclosure: Testimonials appearing on this website may not be representative of other clients or customers and is not a guarantee of future performance or success.