Data &
Technology
Research
Reports
Report Solutions
Reports Library
Actionable
Strategies
Free
Resources
Simple Backtest Calculator
Simple Seasonality Calculator
The Kelly Criterion Calculator
Sentiment Geo Map
Public Research Reports
Free Webinar
Pricing
Company
About
Meet Our Team
In the News
Testimonials
Client Success Stories
Contact
Log inLoginSign up
< BACK TO ALL REPORTS

Do new lows suggest capitulation

Dean Christians
2022-01-25
New lows are surging, suggesting market capitulation that sets the stage for a potential bottom.

Key points:

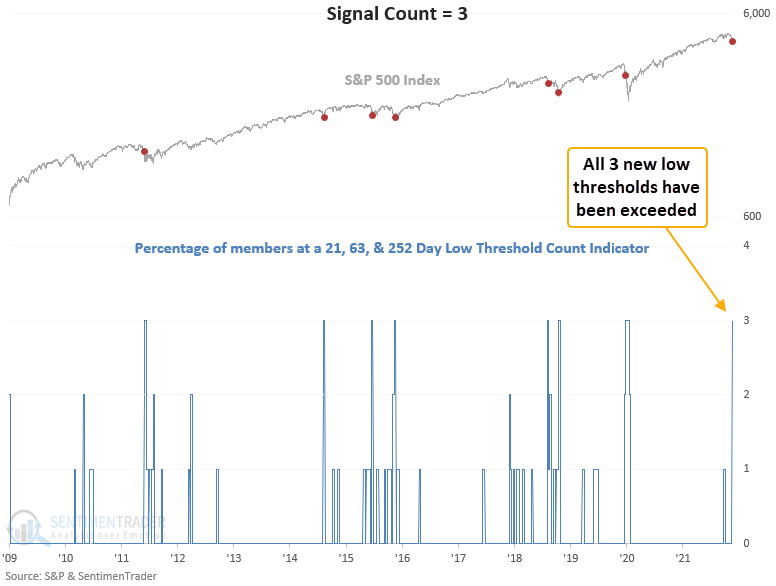
  • The percentage of 21, 63, & 252-day lows for S&P 500 members surged on Monday
  • Our data shows 73.51%, 38.45%, and 5.38%, respectively, for the 3 duration lengths
  • The S&P 500 index has rallied 68% of the time over the next 2 months after other signals

Measuring capitulation with new lows

Let's conduct a study to assess the outlook for the S&P 500 when the percentage of 21, 63 & 252-day lows exceed similar threshold levels to Monday's session. New lows must exceed 73%, 38%, and 5%. I will use a composite indicator that uses a 5-day lookback to count when each series achieves its respective threshold. The study will include a condition that requires the composite to return to zero before a new signal can trigger again to screen out repeats.

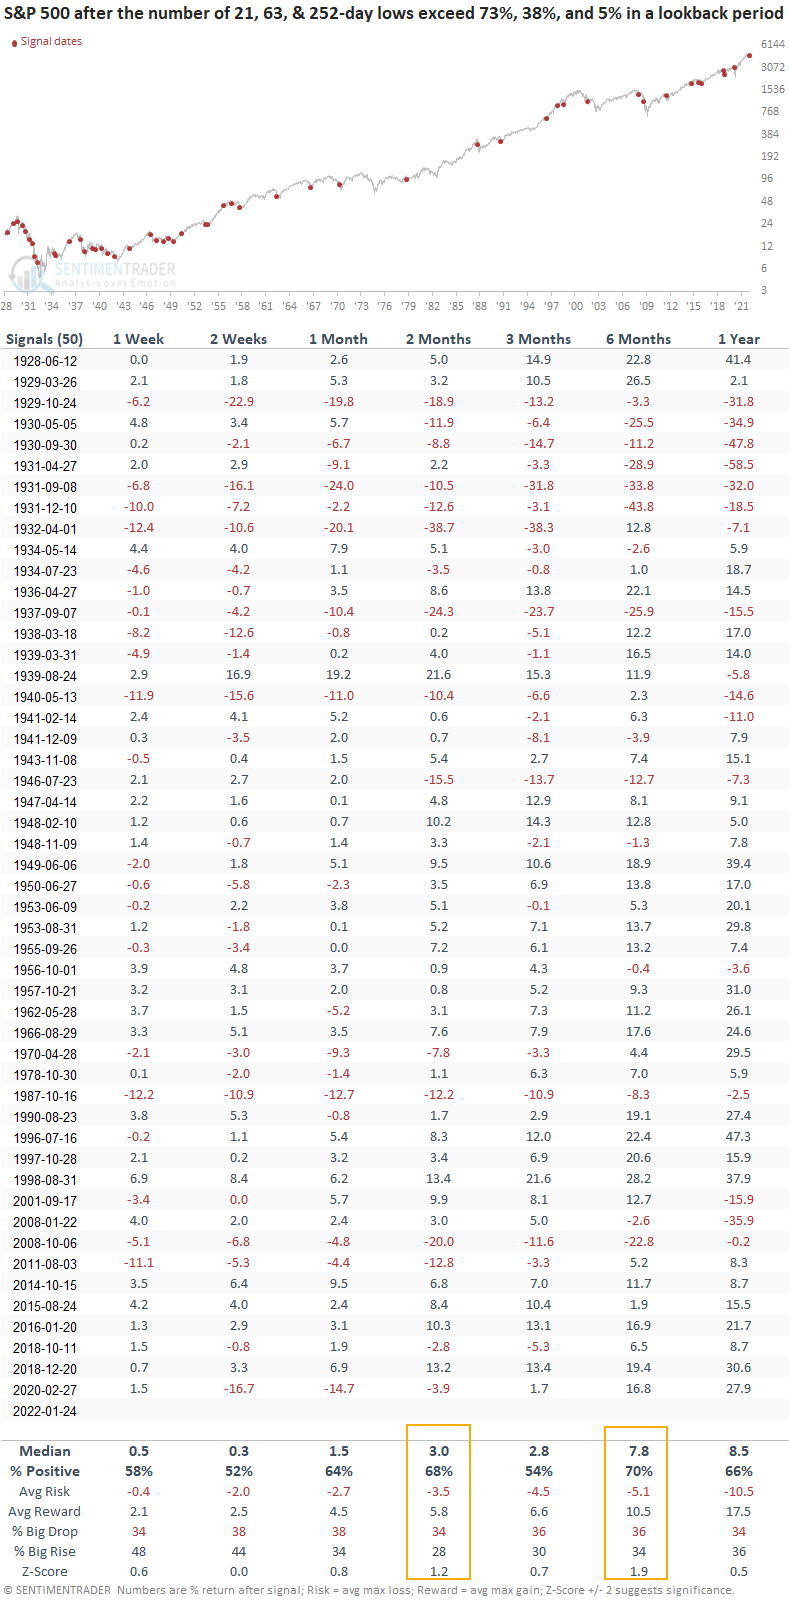
The S&P 500 rallied 68% of the time after other signals

This signal has triggered 50 other times over the past 94 years. After the others, S&P 500 future returns were positive across all time frames, with the best risk/reward profiles coming in the 2 & 6-month windows. However, none of the time frames show a risk/reward profile that looks overwhelmingly appealing, especially given the current level of market volatility.

Signals since 1950

When we exclude the volatile 1929-49 period, results look better across the board except for the 2-week window. It looks about the same, which suggests we need to be mindful that the market might not respond to the spike in new lows in the near term. And, I would also be aware of potential failures like 2011, 2018, and 2020.  
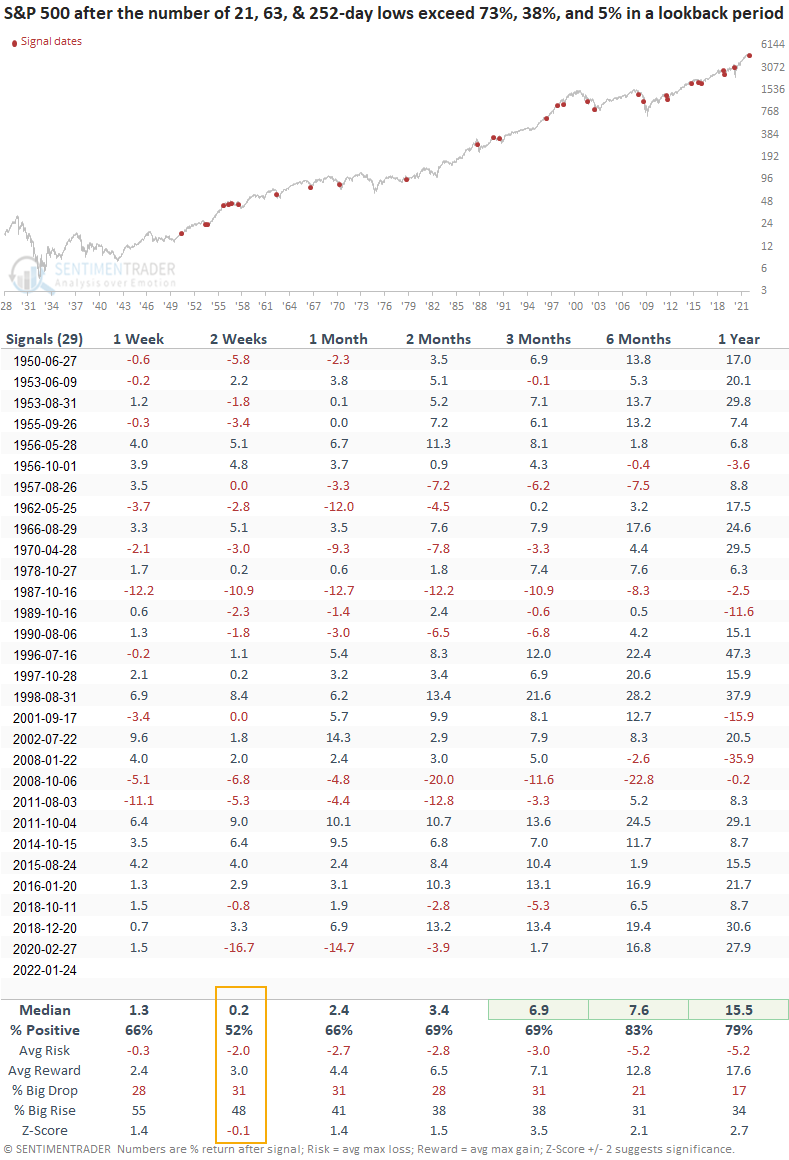
What the research tells us...

When news lows surge to a high level, a market capitulation event can set the stage for a potential market bottom. Similar setups to what we're seeing now have preceded rising stock prices with okay, but not eye-opening risk-reward profiles in the 2 and 6-month time frames. If we assess more recent history, the returns, win rates, and risk/reward profiles look better, especially in the 3-12 month windows. The 2-week time frame suggests that the market may not respond in the near term.

Sorry, you don't have access to this report

Upgrade your subscription plan to get access
Go to Dasboard
DATA &
TECHnologies
IndicatorEdge
‍
BackTestEdge
‍
Other Tools
‍
DataEdge API
RESEARCH
reports
Research Solution
‍
Reports Library
‍
actionable
Strategies
Trading Strategies
‍
Smart Stock Scanner
‍
FREE
RESOUrCES
Simple Backtest
Calculator
Simple Seasonality
Calculator
The Kelly Criterion
Calculator
Sentiment Geo Map
‍
Public Research Reports
‍
Free Webinar
COMPANY
‍
About
‍
Meet our Team
‍
In the News
‍
Testimonials
‍
Client Success Stories
Pricing
Bundle pricing
‍
Announcements
‍
FAQ
© 2024 Sundial Capital Research Inc. All rights reserved.
Setsail Marketing
TermsPrivacyAffiliate Program
Risk Disclosure: Futures and forex trading contains substantial risk and is not for every investor. An investor could potentially lose all or more than the initial investment. Risk capital is money that can be lost without jeopardizing ones’ financial security or life style. Only risk capital should be used for trading and only those with sufficient risk capital should consider trading. Past performance is not necessarily indicative of future results.

Hypothetical Performance Disclosure: Hypothetical performance results have many inherent limitations, some of which are described below. No representation is being made that any account will or is likely to achieve profits or losses similar to those shown; in fact, there are frequently sharp differences between hypothetical performance results and the actual results subsequently achieved by any particular trading program. One of the limitations of hypothetical performance results is that they are generally prepared with the benefit of hindsight. In addition, hypothetical trading does not involve financial risk, and no hypothetical trading record can completely account for the impact of financial risk of actual trading. for example, the ability to withstand losses or to adhere to a particular trading program in spite of trading losses are material points which can also adversely affect actual trading results. There are numerous other factors related to the markets in general or to the implementation of any specific trading program which cannot be fully accounted for in the preparation of hypothetical performance results and all which can adversely affect trading results.

Testimonial Disclosure: Testimonials appearing on this website may not be representative of other clients or customers and is not a guarantee of future performance or success.