Products
SentimenTrader Trading Tools
‍
Backtest Engine
My Trading Toolkit
Correlation Analysis
Seasonality
Market Prediction
Indicators & Data API
‍
Proprietary Indicators & Charts
Market Data API
Strategies & Scanner
‍
50+ Trading Strategies
Smart Stock Scanner
Smart Option Scanner
Research Reports
‍
Research Solutions
Reports Library
Free Resources
Simple Backtest Calculator
Simple Seasonality Calculator
The Kelly Criterion Calculator
Sentiment Geo Map
Public Research Reports
Education
Sentiment Indicators
Technical Indicators
Pricing
Company
About
In the News
Testimonials
Client Success Stories
Contact
Log inLoginSign up
< BACK TO ALL REPORTS

Discounts On MLP Funds; Wall Street Looks To 2019

Jason Goepfert
2018-12-04
null

This is an abridged version of our Daily Report.

Partnership pessimism

One of the better ways to gain exposure to master limited partnerships (MLPs) is through closed-end funds (CEFs), which often swing to premiums or discounts to the value of their underlying holdings based almost purely on change in investor sentiment.

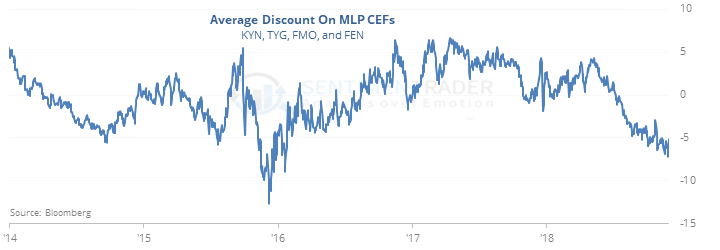
The average discount on over a dozen MLP closed-end funds is now large and suggests that investors are showing excessive pessimism toward the sector. It’s not perfect, but it does tend to lead to rebounds.

Wall Street looks to 2019

Strategists surveyed by Bloomberg are estimating a gain of about 9% in the S&P for 2019.

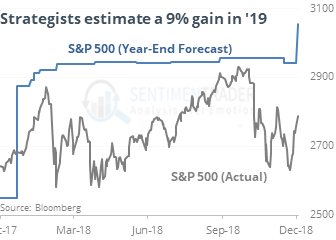
That’s right in line with their usual forecast. Over the past 20 years, their yearly forecast has been wildly off the mark more often than not, so their aggregate estimate for next year should be taken with a grain of salt.

Sentiment and seasonality

The Commodity Sentiment & Seasonality Screen shows that lumber, coffee, and heating oil all having an Optimism Index below 30 while averaging a gain of at least 1% in December. The dollar and natural gas show high optimism and negative average return. The screen for ETFs shows a smattering of country funds with low optimism and good December returns.

New trend?

The S&P just closed above its 50-day average for the first time in more than 30 days and is also above its 200-day average. There have been 7 times this happened in the past 40 years, all leading to gains over the next 3 months, averaging 8.0%. Prior to the last 40 years, it had a mostly negative bias.

PRODUCTS
SentimenTrader
Trading Tools
Indicators & Data API
‍
Strategies & Scanner
‍
Research Reports
FREE
RESOUrCES
Simple Backtest
Calculator
Simple Seasonality
Calculator
The Kelly Criterion
Calculator
Sentiment Geo Map
‍
Public Research Reports
‍
Education
Sentiment Indicators
‍
Technical Indicators
‍
Pricing
Bundle pricing
‍
FAQ
‍
Announcements
‍
COMPANY
‍
About
‍
In the News
‍
Testimonials
‍
Client Success Stories
CONTACT
‍
General Inquiries
‍
Media Inquiries
‍
Financial Professionals Inquiries
‍
© 2026 Sundial Capital Research Inc. All rights reserved.
Setsail Marketing
TermsPrivacyAffiliate Program
Risk Disclosure: The information and tools provided are for research and analytical purposes only and are not intended as investment advice. Market analysis involves uncertainty, and outcomes may differ from expectations. Users should conduct their own due diligence and consider their individual circumstances before making any financial decisions. Past performance is not necessarily indicative of future results.

Hypothetical Performance Disclosure: Hypothetical performance results have many inherent limitations, some of which are described below. No representation is being made that any account will or is likely to achieve profits or losses similar to those shown; in fact, there are frequently sharp differences between hypothetical performance results and the actual results subsequently achieved by any particular trading program. One of the limitations of hypothetical performance results is that they are generally prepared with the benefit of hindsight. In addition, hypothetical trading does not involve financial risk, and no hypothetical trading record can completely account for the impact of financial risk of actual trading. for example, the ability to withstand losses or to adhere to a particular trading program in spite of trading losses are material points which can also adversely affect actual trading results. There are numerous other factors related to the markets in general or to the implementation of any specific trading program which cannot be fully accounted for in the preparation of hypothetical performance results and all which can adversely affect trading results.

Testimonial Disclosure: Testimonials appearing on this website may not be representative of other clients or customers and is not a guarantee of future performance or success.