Data &
Technology
Research
Reports
Report Solutions
Reports Library
Actionable
Strategies
Free
Resources
Simple Backtest Calculator
Simple Seasonality Calculator
The Kelly Criterion Calculator
Sentiment Geo Map
Public Research Reports
Free Webinar
Pricing
Company
About
Meet Our Team
In the News
Testimonials
Client Success Stories
Contact
Log inLoginSign up
< BACK TO ALL REPORTS

Did the utility sector signal too much pessimism

Dean Christians
2021-12-14
Utility stock participation is robust, signaling that investors moved to a more defensive portfolio allocation. The pessimistic outlook just triggered a signal with a 91% win rate for the S&P 500.

Key points:

  • A breadth composite shows utility stocks are surging
  • The composite crossed above 71% on Monday
  • The S&P 500 rallied 91% of the time over the next 12 months after other signals

Utility stocks as a contrary sentiment indicator

Does a surge in utility stocks, a traditionally defensive sector, signal too much pessimism and therefore provide a bullish market message for the S&P 500?

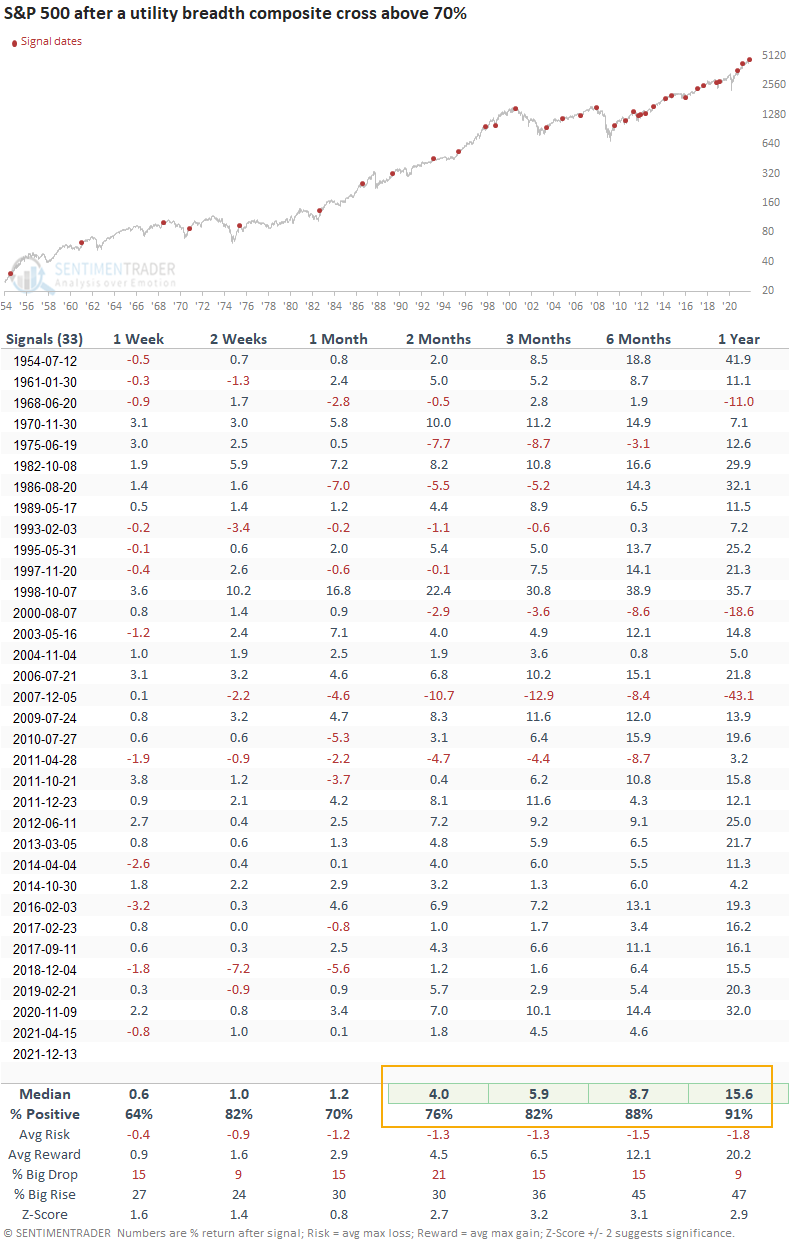
Let's conduct a study to assess the outlook for the S&P 500 after a composite breadth indicator for the utility sector surges above 70%. I used a reset condition of 0% for the signal generation to screen out repeats and identify the first instance.

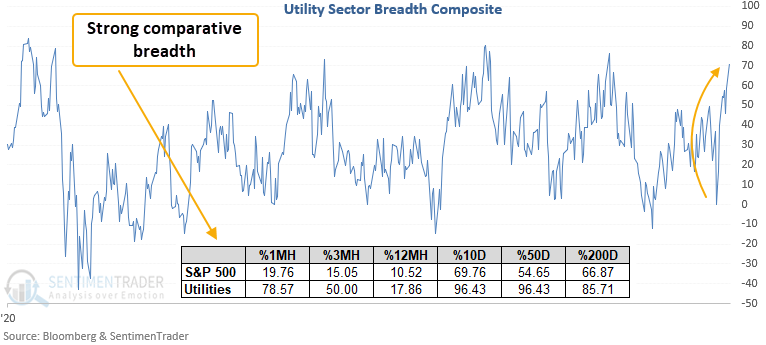
Utility breadth is surging and looks strong on a comparative basis

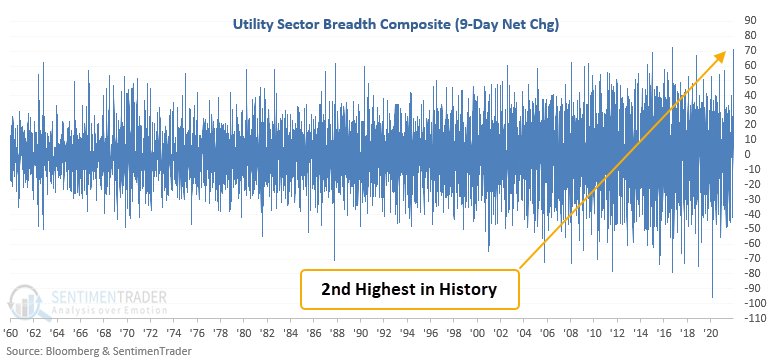
Suppose I apply a 9-day net change to the utility sector composite. In that case, we see that participation over the trailing 9 sessions has surged to the second-highest level in history.

Similar signals preceded strong gains across all time frames

This signal has triggered 33 other times over the past 68 years. After the others, future returns were strong, with several significant risk/reward profiles. A year later, the S&P 500 was higher 91% of the time, with 2 out of 3 untimely signals occurring during bear markets.

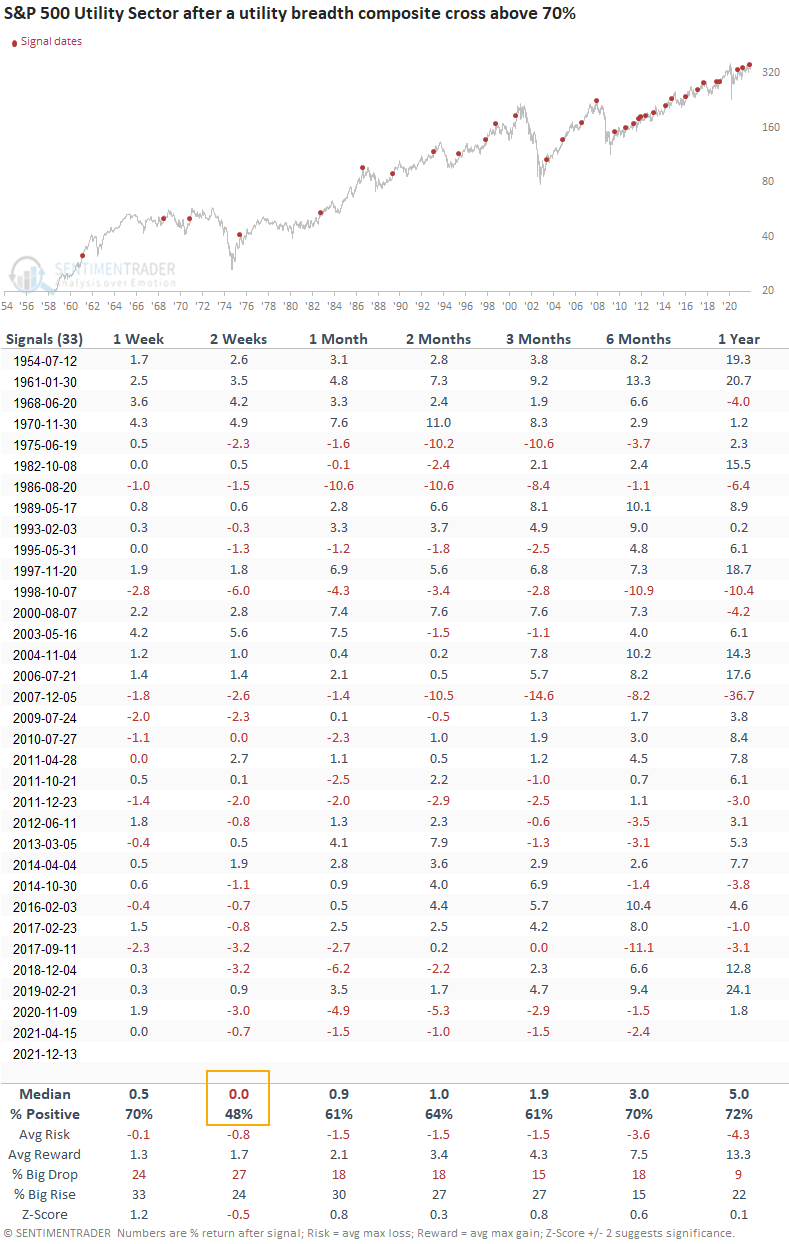
The utility sector shows above-average gains, but significantly underperforms the S&P 500

While win rates and gains are favorable across almost all time frames, the surge in utility participation suggests one would be better off with an allocation to the S&P 500. The 2-week window suggests that utilities pause after the initial strength.

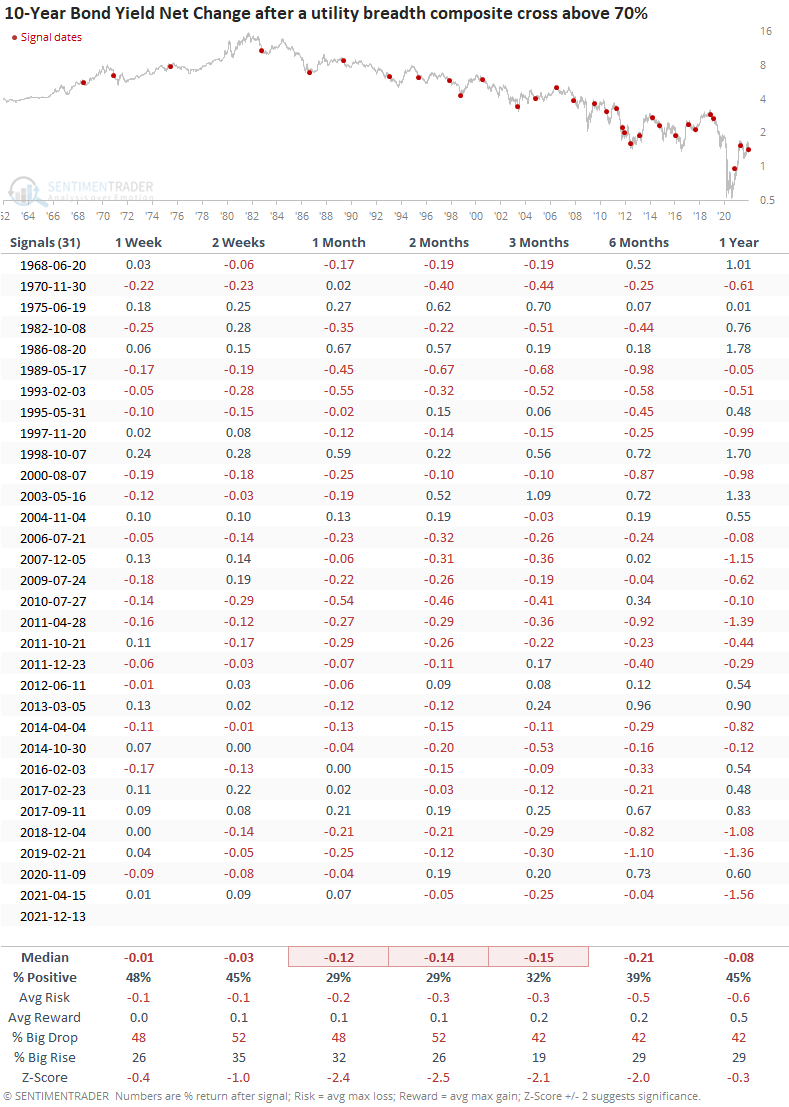
Bond yields showed a tendency to decline

The surge in utility participation suggests bond yields will move lower. However, most signals occurred during a structural bull market for bond prices. i.e., a falling yield environment.

What the research tells us...

When the traditionally defensive utility sector sees a surge in participation, market participants may have become too pessimistic on the outlook for the stock market. Similar setups to what we're seeing now have preceded solid returns and win rates for the S&P 500, especially on a medium and long-term basis.

The surge in participation also suggests that the 10-year bond yield could move lower. 

Sorry, you don't have access to this report

Upgrade your subscription plan to get access
Go to Dasboard
DATA &
TECHnologies
IndicatorEdge
‍
BackTestEdge
‍
Other Tools
‍
DataEdge API
RESEARCH
reports
Research Solution
‍
Reports Library
‍
actionable
Strategies
Trading Strategies
‍
Smart Stock Scanner
‍
FREE
RESOUrCES
Simple Backtest
Calculator
Simple Seasonality
Calculator
The Kelly Criterion
Calculator
Sentiment Geo Map
‍
Public Research Reports
‍
Free Webinar
COMPANY
‍
About
‍
Meet our Team
‍
In the News
‍
Testimonials
‍
Client Success Stories
Pricing
Bundle pricing
‍
Announcements
‍
FAQ
© 2024 Sundial Capital Research Inc. All rights reserved.
Setsail Marketing
TermsPrivacyAffiliate Program
Risk Disclosure: Futures and forex trading contains substantial risk and is not for every investor. An investor could potentially lose all or more than the initial investment. Risk capital is money that can be lost without jeopardizing ones’ financial security or life style. Only risk capital should be used for trading and only those with sufficient risk capital should consider trading. Past performance is not necessarily indicative of future results.

Hypothetical Performance Disclosure: Hypothetical performance results have many inherent limitations, some of which are described below. No representation is being made that any account will or is likely to achieve profits or losses similar to those shown; in fact, there are frequently sharp differences between hypothetical performance results and the actual results subsequently achieved by any particular trading program. One of the limitations of hypothetical performance results is that they are generally prepared with the benefit of hindsight. In addition, hypothetical trading does not involve financial risk, and no hypothetical trading record can completely account for the impact of financial risk of actual trading. for example, the ability to withstand losses or to adhere to a particular trading program in spite of trading losses are material points which can also adversely affect actual trading results. There are numerous other factors related to the markets in general or to the implementation of any specific trading program which cannot be fully accounted for in the preparation of hypothetical performance results and all which can adversely affect trading results.

Testimonial Disclosure: Testimonials appearing on this website may not be representative of other clients or customers and is not a guarantee of future performance or success.