Data &
Technology
Research
Reports
Report Solutions
Reports Library
Actionable
Strategies
Free
Resources
Simple Backtest Calculator
Simple Seasonality Calculator
The Kelly Criterion Calculator
Sentiment Geo Map
Public Research Reports
Free Webinar
Pricing
Company
About
Meet Our Team
In the News
Testimonials
Client Success Stories
Contact
Log inLoginSign up
< BACK TO ALL REPORTS

Did the utility sector just signal higher inflation for longer?

Dean Christians
2021-09-28
The interest rate-sensitive utility sector just recorded 13 consecutive lower closes, a streak last seen during the inflationary period of the 1970s. Let's assess the forward return outlook for stocks and bonds.

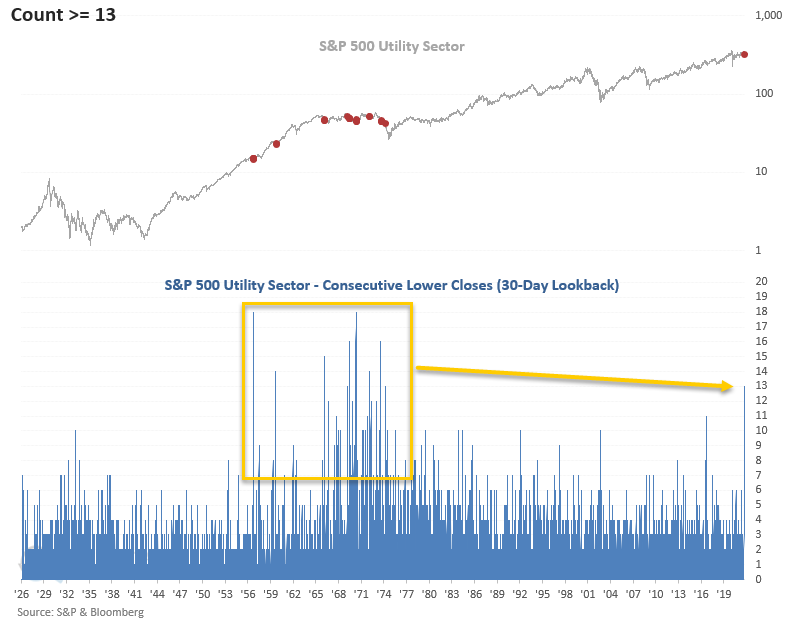
The S&P 500 Utility sector has now closed lower for 13 consecutive days in a 30-day lookback period. The last instance of the magnitude occurred over 48 years ago, in April 1974. We wonder if the interest-rate-sensitive utility sector is signaling that inflation will persist at a higher level for a much more extended period than most think. The surge in energy prices of late certainly helps the case.

Let's conduct a study to assess the outlook for stocks and bonds when utilities close lower for ten consecutive days in a 30-day lookback period. I lowered the threshold level to ten, so we could assess more historical instances.

HISTORICAL CHART

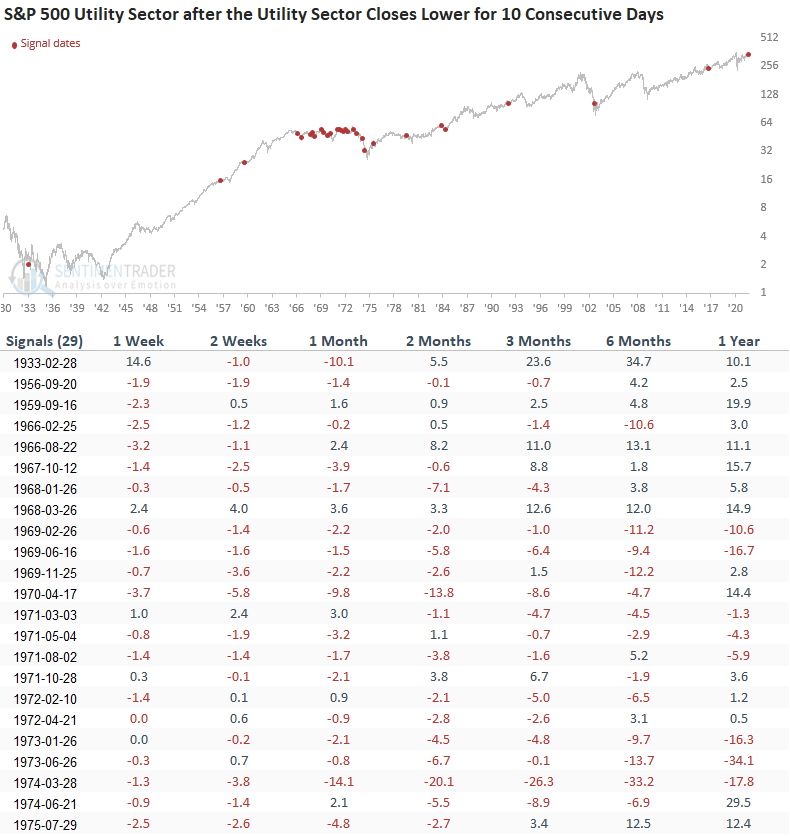
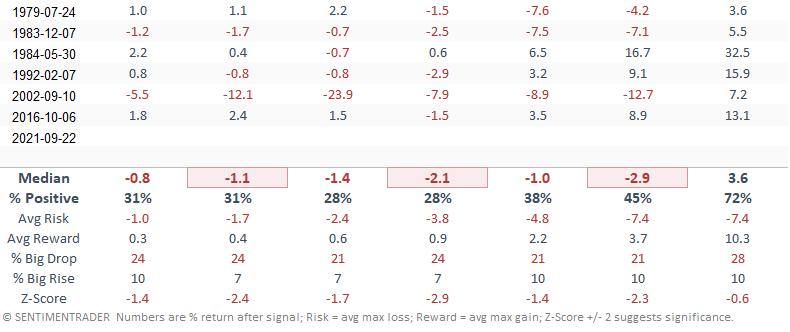
HOW THE SIGNALS PERFORMED - UTILITY SECTOR

The results for utilities look poor on almost all time frames. Interestingly, the 1-year time frame looks okay from a consistency point of view.

I would note that the study is heavily influenced by the 1966-1982 secular bear period when inflation impacted equities.

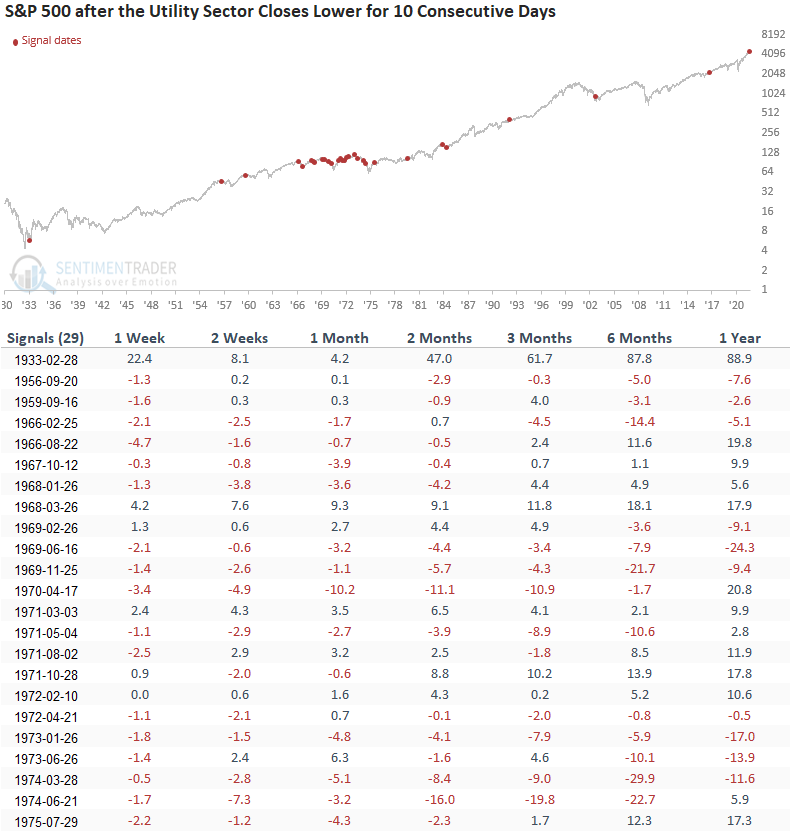
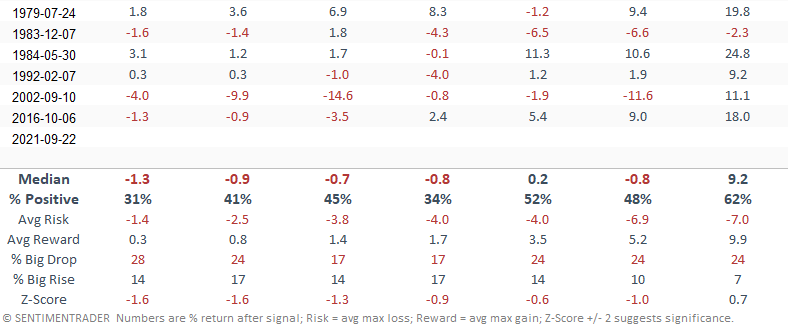
HOW THE SIGNALS PERFORMED - S&P 500

Results for the S&P 500 look weak across most time frames. If we look at the 2-month window, we see negative returns in 4/5 of the most recent instances.

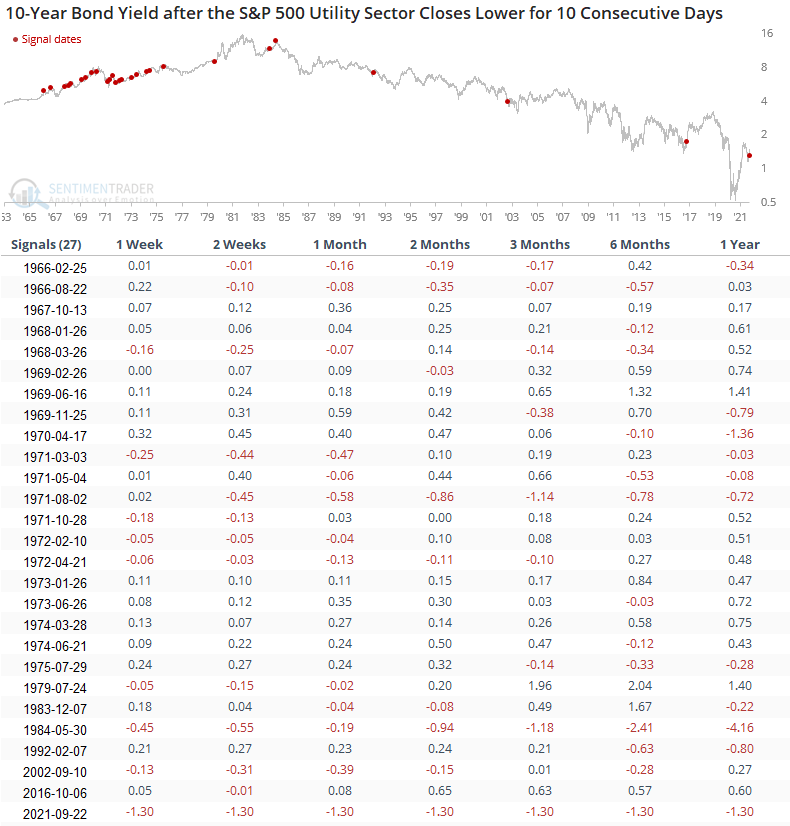
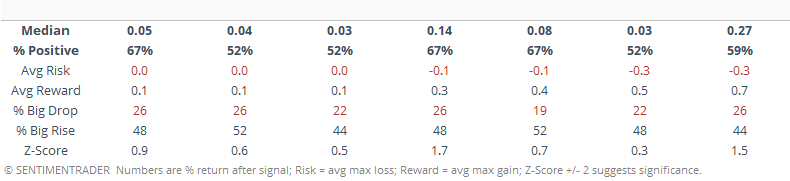
HOW THE SIGNALS PERFORMED - BOND YIELDS

Bonds yields clearly show an upward bias, especially in the 2-3 month time frame.

Please note the bond table reflects the net change in yields and contains fewer signals due to data limitations.

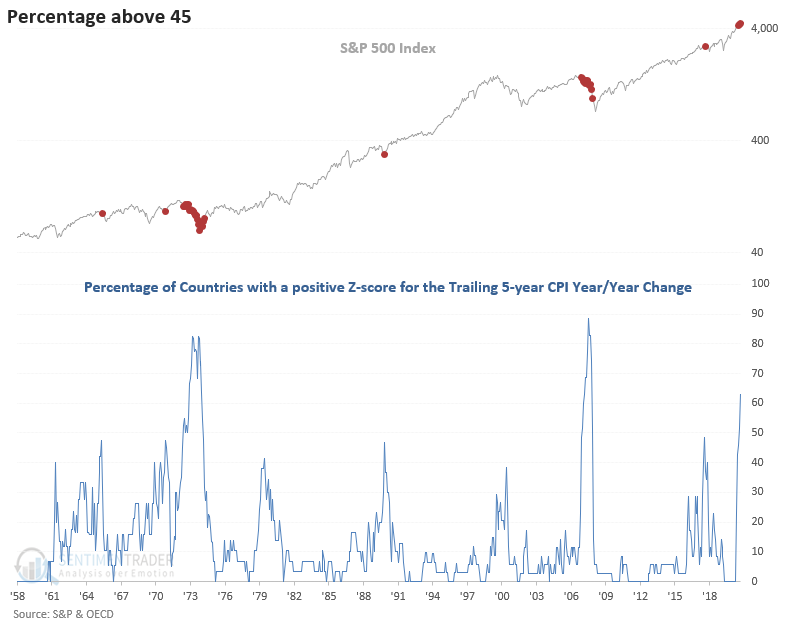
Inflation is a global phenomenon. The last significant spike in the following inflation indicator occurred in the summer of 2018. The market drifted higher for three more months before succumbing to an almost 20% decline in the fourth quarter.


I've read many reports over the last 25 years suggesting a coming inflation tsunami from all the central bank easy money. So far, technology and demographics have won, and inflation has been benign except for an occasional and short-lived spike. Did the covid pandemic ignite the spark that changed the course of history? Stay tuned.

Sorry, you don't have access to this report

Upgrade your subscription plan to get access
Go to Dasboard
DATA &
TECHnologies
IndicatorEdge
‍
BackTestEdge
‍
Other Tools
‍
DataEdge API
RESEARCH
reports
Research Solution
‍
Reports Library
‍
actionable
Strategies
Trading Strategies
‍
Smart Stock Scanner
‍
FREE
RESOUrCES
Simple Backtest
Calculator
Simple Seasonality
Calculator
The Kelly Criterion
Calculator
Sentiment Geo Map
‍
Public Research Reports
‍
Free Webinar
COMPANY
‍
About
‍
Meet our Team
‍
In the News
‍
Testimonials
‍
Client Success Stories
Pricing
Bundle pricing
‍
Announcements
‍
FAQ
© 2024 Sundial Capital Research Inc. All rights reserved.
Setsail Marketing
TermsPrivacyAffiliate Program
Risk Disclosure: Futures and forex trading contains substantial risk and is not for every investor. An investor could potentially lose all or more than the initial investment. Risk capital is money that can be lost without jeopardizing ones’ financial security or life style. Only risk capital should be used for trading and only those with sufficient risk capital should consider trading. Past performance is not necessarily indicative of future results.

Hypothetical Performance Disclosure: Hypothetical performance results have many inherent limitations, some of which are described below. No representation is being made that any account will or is likely to achieve profits or losses similar to those shown; in fact, there are frequently sharp differences between hypothetical performance results and the actual results subsequently achieved by any particular trading program. One of the limitations of hypothetical performance results is that they are generally prepared with the benefit of hindsight. In addition, hypothetical trading does not involve financial risk, and no hypothetical trading record can completely account for the impact of financial risk of actual trading. for example, the ability to withstand losses or to adhere to a particular trading program in spite of trading losses are material points which can also adversely affect actual trading results. There are numerous other factors related to the markets in general or to the implementation of any specific trading program which cannot be fully accounted for in the preparation of hypothetical performance results and all which can adversely affect trading results.

Testimonial Disclosure: Testimonials appearing on this website may not be representative of other clients or customers and is not a guarantee of future performance or success.