Did the Transports Momentum Just End

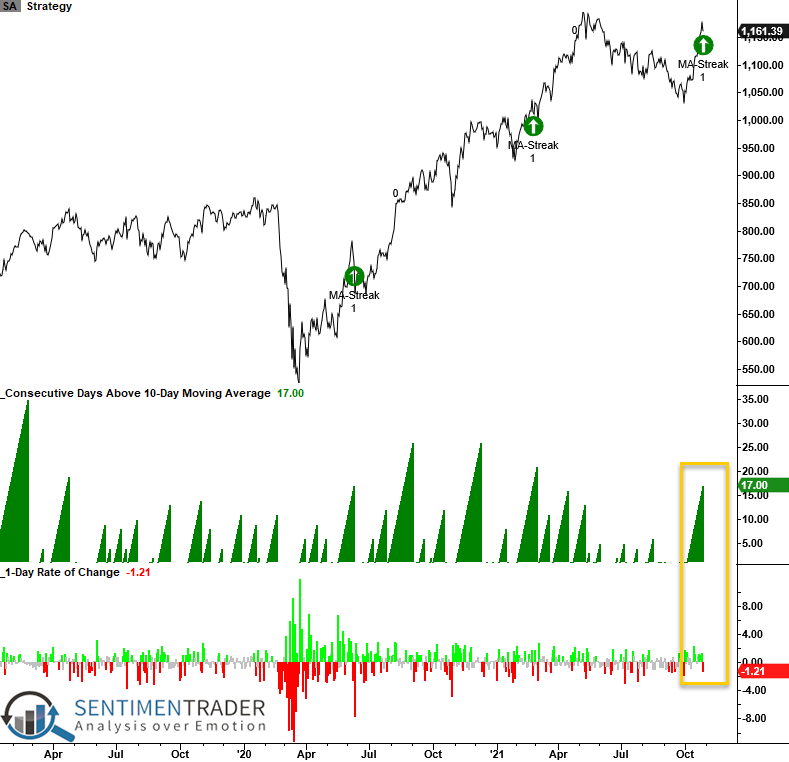
The S&P 1500 transportation group declined by 1.21% on Wednesday. At the same time, short-term momentum has been strong, with the industry closing above its 10-day moving average for 17 consecutive days.
Does the 1-day decline in the transportation sector signal a halt to the upward price momentum in the industry?
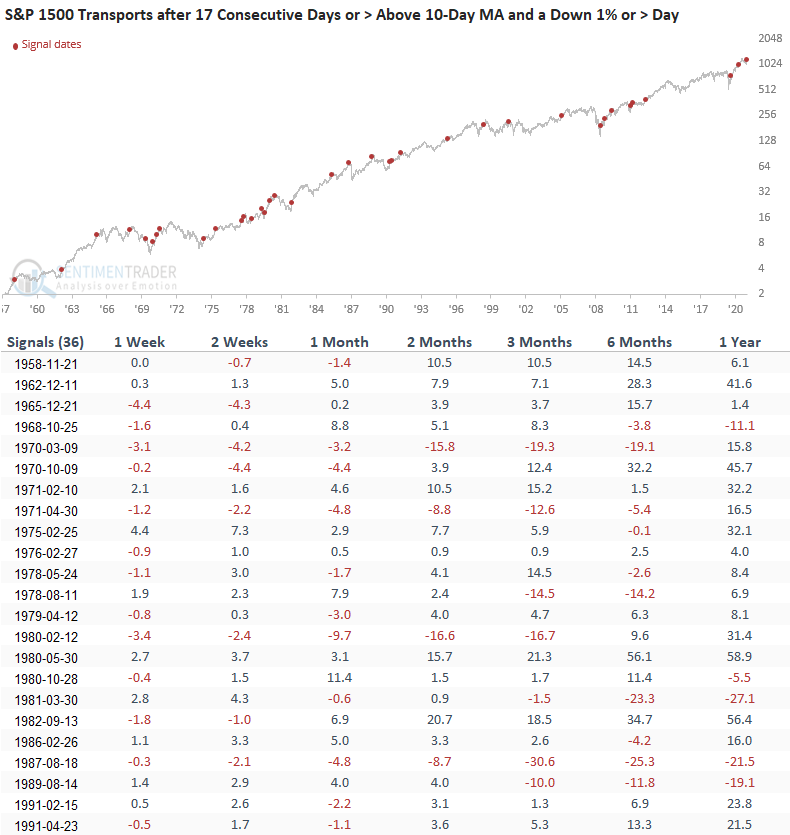
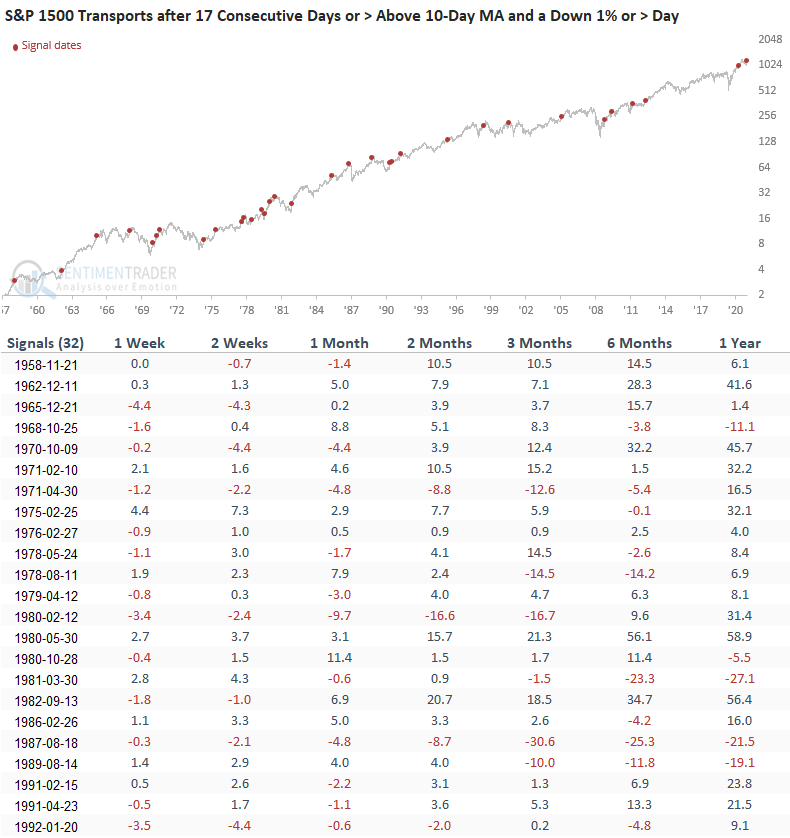
Let's conduct a study to assess the outlook for the transportation industry when the group closes above its respective 10-day moving average for 17 consecutive days or more and registers a 1% or greater decline.
CURRENT CHART
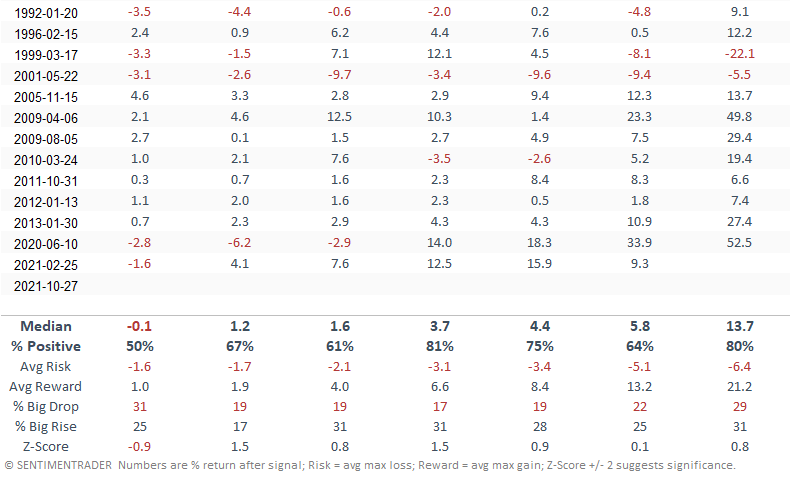
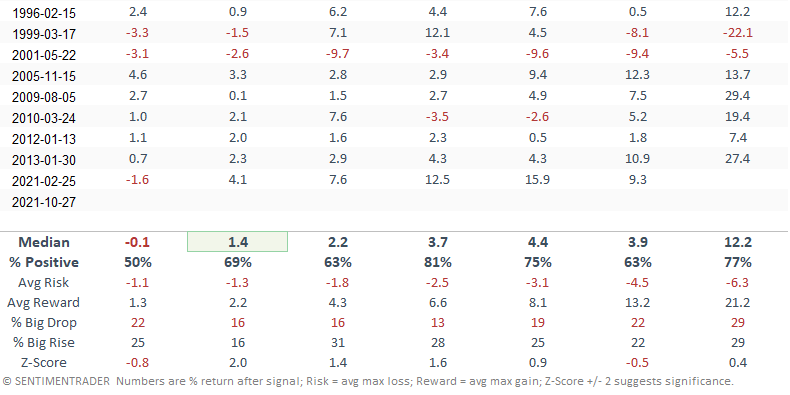
HOW THE SIGNALS PERFORMED
Besides the 1-week time frame, results look good, especially the 2-month window. I suspect the 1-week results are nothing more than a timeout in an uptrend.
Let's add some context to the study to isolate historical instances that look similar to the current environment. I will keep the original study parameters and add a long-term trend filter that requires the transportation industry to be trading above its 200-day moving average.
HOW THE SIGNALS PERFORMED WITH TREND FILTER
Results look fairly similar to the original study. However, I would that the 2-week time frame improved and now shows a significant risk/reward profile.
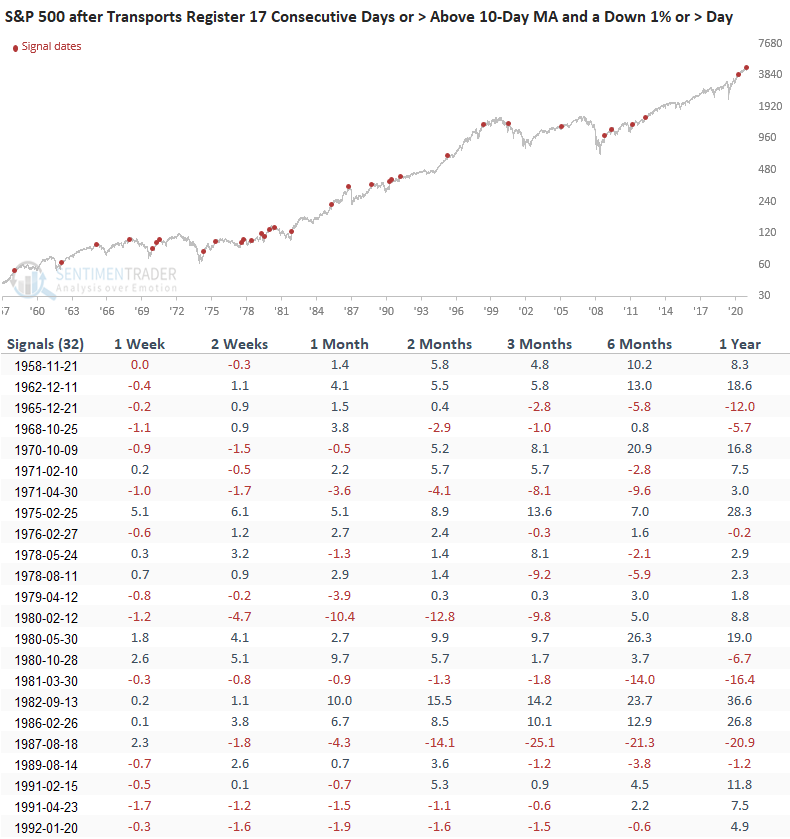
Let's apply the transportation signals to the S&P 500 to assess the outlook for large-cap stocks.
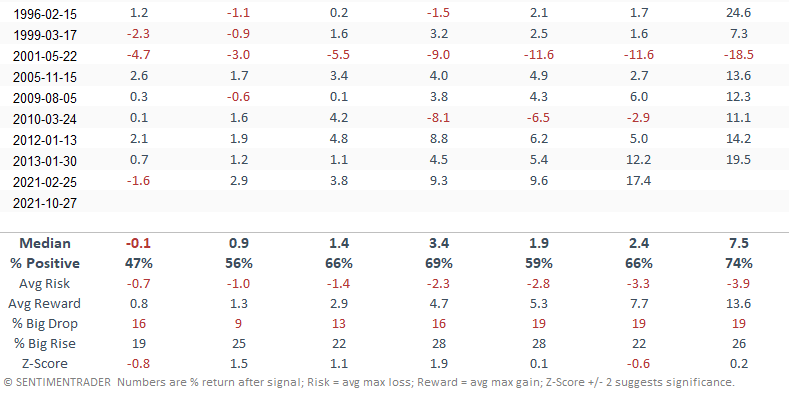
HOW THE SIGNALS PERFORMED
The S&P 500 results look better than historical averages, except for the 1-week time frame.
Suppose we compare the transportation industry to the S&P 500. In that case, we see slightly worse results and consistency for the S&P 500 across all time frames.
Based on today's study, one would be better off with an allocation to the transportation industry versus a broad-based allocation to large-cap stocks.
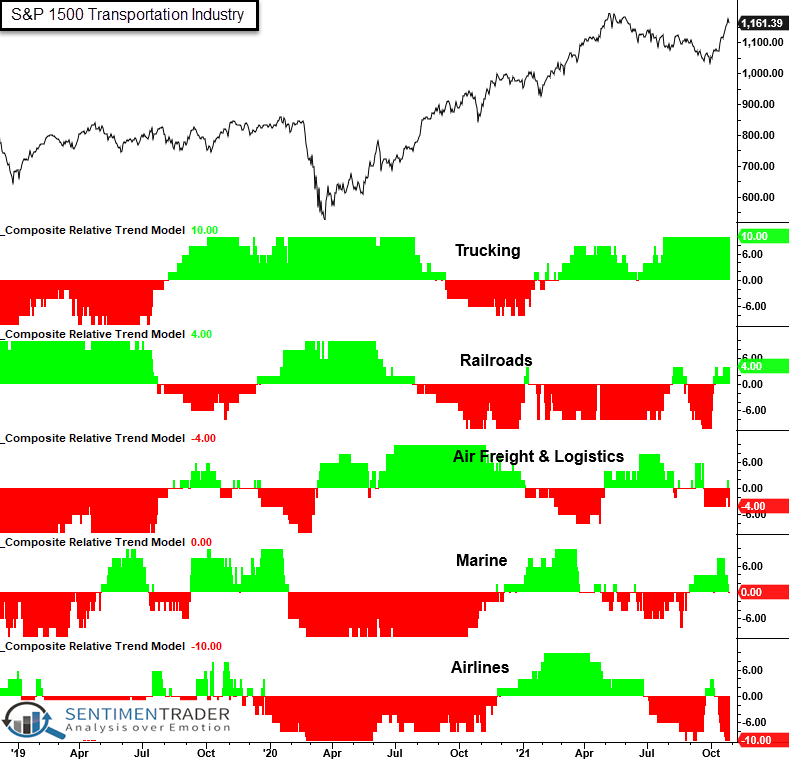
Let's identify which sub-components within the transportation industry exhibit the best relative strength. Suppose we utilize the composite relative trend model indicator that I feature in my Monday morning ETF update. In that case, we see trucking and railroads with the best scores.
As a reminder, a relative trend score of 10 = highest and -10 = lowest.