
Did Cyclicals Just Confirm the New Uptrend

In a note on 7/16/21, I shared a risk-off signal that identifies when a basket of cyclical industries fails to confirm a new high in the S&P 500. Typically, when economically-sensitive groups diverge from the broad market, forward returns fall below historical averages.
The S&P 500 index performed well after the non-confirmation signal from cyclical's as the federal reserve remained accommodative in the face of the latest Covid flare-up.
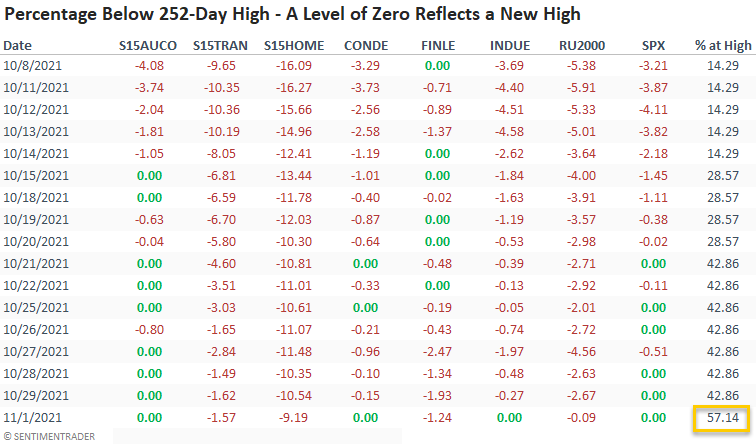
If we fast forward to the current day, participation from the same basket of cyclical industries looks solid. When I measured the percentage of cyclical groups registering a new 252-day in a 10-day lookback period, it returned a reading of 57% on 11/1/21. Please see below for the component list.
Let's assess the forward return outlook for the S&P 500 when the percentage of cyclical industries registering a 252-day high in a 10-day lookback period crosses above 50%. I screened out repeat signals by requiring the indicator to fall to 0% before a new instance could occur again.
CYCLICAL NEW HIGH COUNT COMPONENTS
- S&P 1500 Automobiles & Auto Components Industry Group
- S&P 1500 Transports Industry Group
- S&P 1500 Homebuilding Sub-Industry
- S&P 500 Consumer Discretionary Sector Equal-Weight
- S&P 500 Financials Sector Equal-Weight
- S&P 500 Industrials Sector Equal-Weight
- Russell 2000 Small Cap Index
As of 11/1/21, automobiles & auto components, consumer discretionary, financials, and industrials have closed at a new 252-day high within the last ten trading days. And, I would note that the Russell 2000 closed within ten basis points of registering its first new 252-day high since 3/15/21.
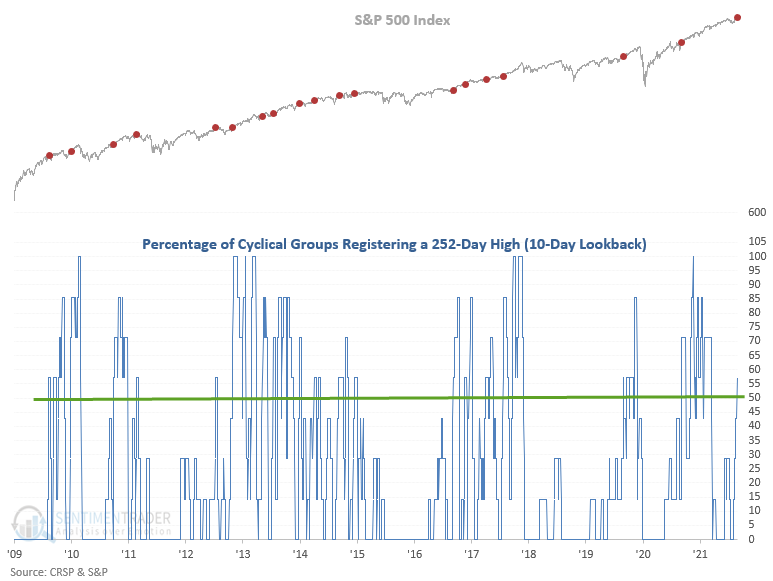
HISTORICAL CHART
If we focus our attention on the last two major uptrend periods between 2012-2015 and 2016-2017, we see several instances where cyclical industries confirmed the new highs in the S&P 500. I would also note the lack of signals during the 2018-2019 time frame when the federal reserve was tightening monetary policy.
HOW THE SIGNALS PERFORMED
Results look good across all time frames with several notable risk/reward profiles, especially in the 2-week window. Please remember the following. Returns and consistency will not show ultra bullish stats when a model uses a 252-day high as a requirement. I would focus more on the risk/reward profiles, which look solid.
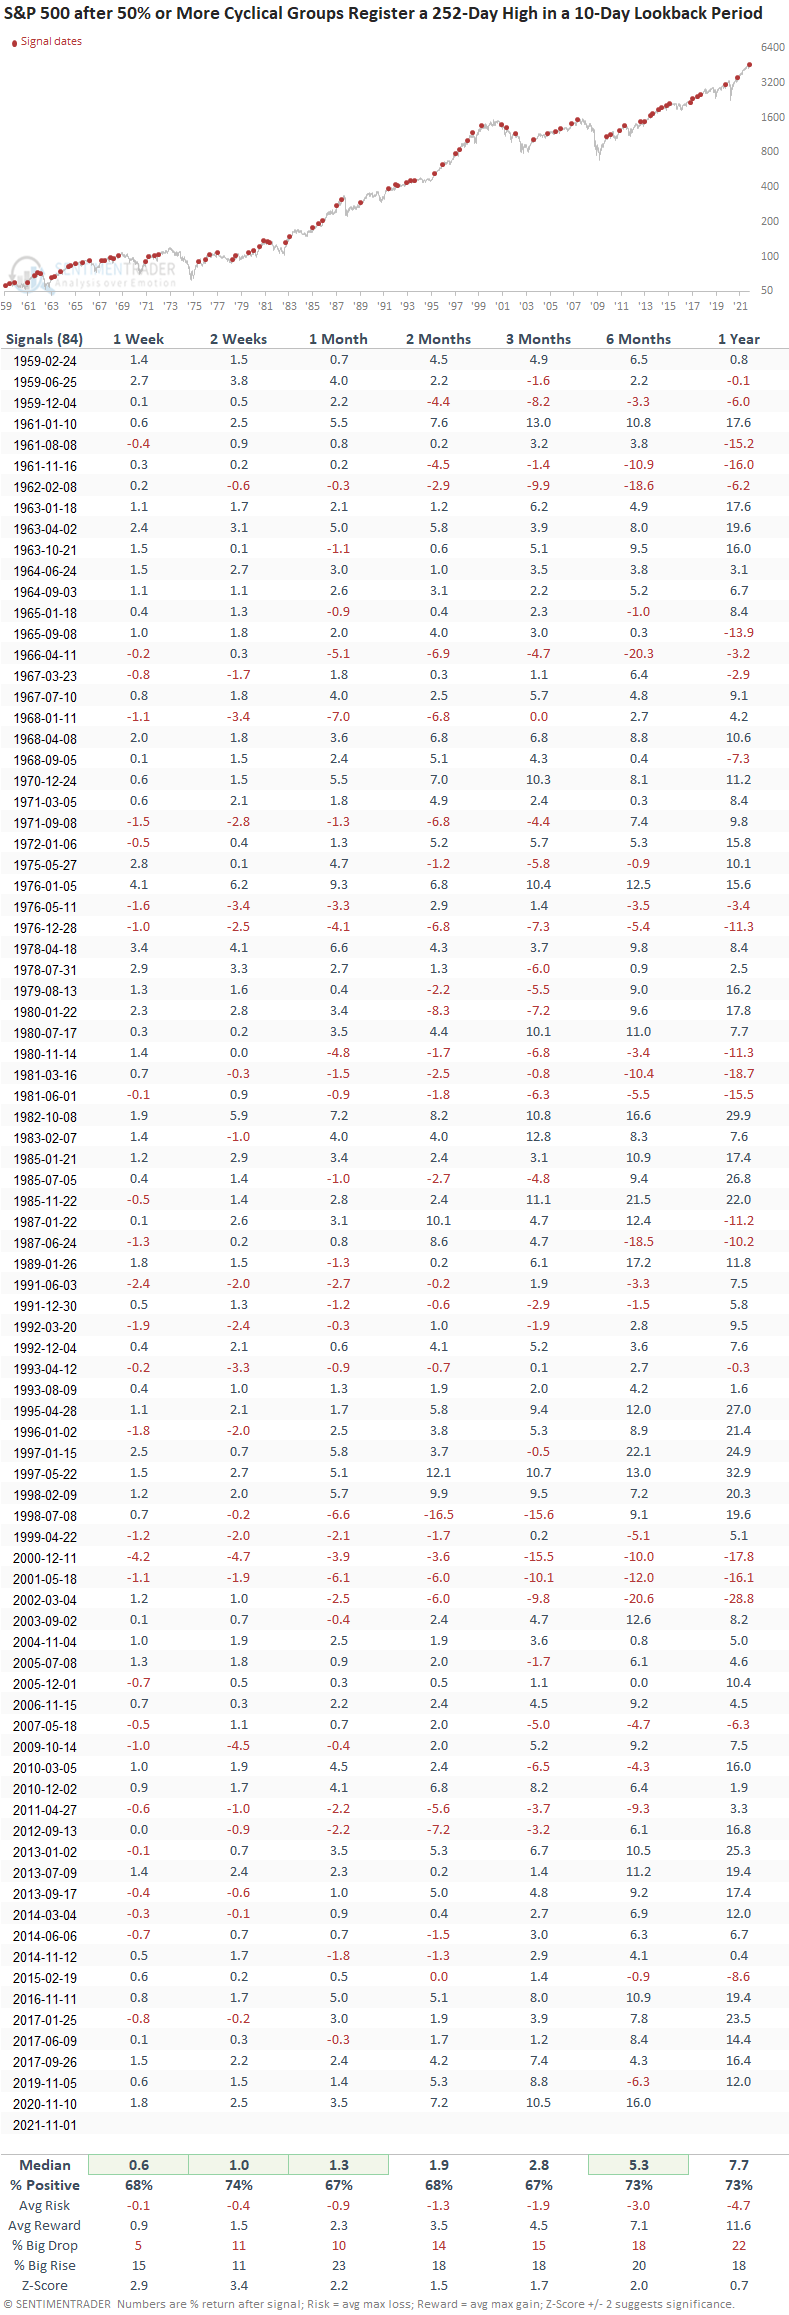
KEY TAKEAWAYS:
- A signal occurs when 50% or more cyclical industries register a 252-day high in a 10-day lookback period
- The model has a 74% win rate with a solid risk/reward profile over the next two weeks
- The signal suggests the year-end rally can continue