
Did 52-week lows signal capitulation

Key points:
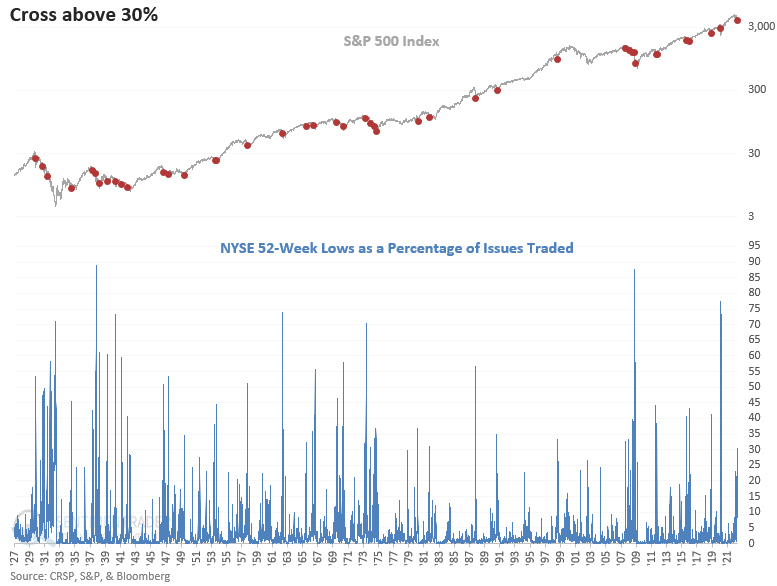
- 52-Week lows for NYSE issues surged above 30% on Monday
- After similar signals, the S&P 500 index shows positive returns, especially in the very short-term
- When the S&P 500 <= 20% from a multi-year high, the outlook improves
Does the spike in 52-week lows suggest capitulation
Let's assess the outlook for the S&P 500 after 52-week lows for NYSE issues surge above 30%. I will use a reset that requires new lows to fall below 1% before a new signal can trigger again.
The cross above 30% on Monday seems low compared to other significant corrections since the 2009 bottom. However, I would keep in mind that most stocks showed substantial gains over the trailing 1-year period. So, the strike price for a 52-week low resided at a much lower level than what typically occurs after a significant market top.
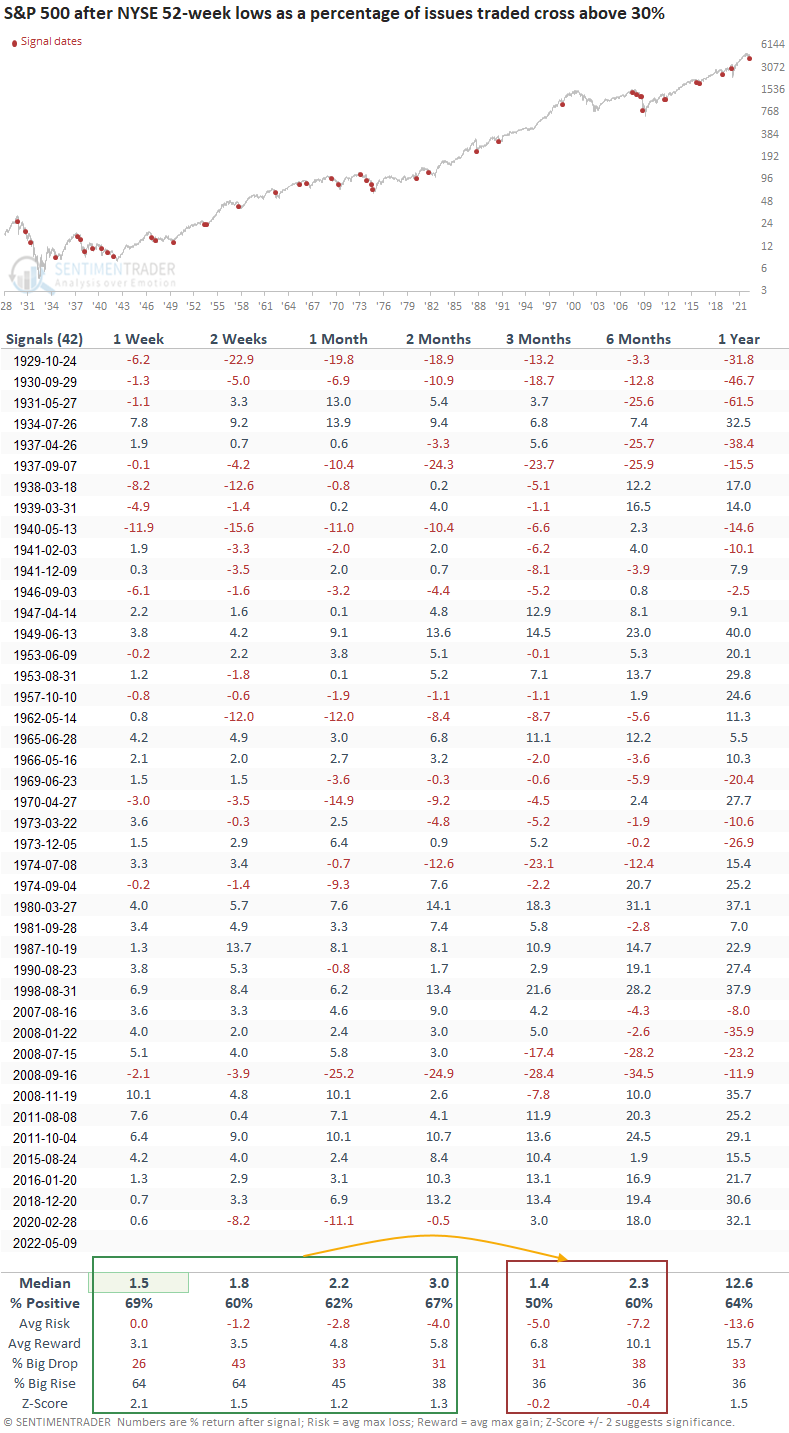
Similar spikes in new lows preceded positive returns for the S&P 500
This study generated a signal 42 other times over the past 93 years. After the others, S&P 500 future returns and win rates suggest the market can bounce in the next few months. The z-scores look constructive. However, the returns, win rates, and risk/reward profiles in the 3 and 6-month windows show a noticeable dropoff. That would suggest that one should be mindful of a potential retest after a bounce.
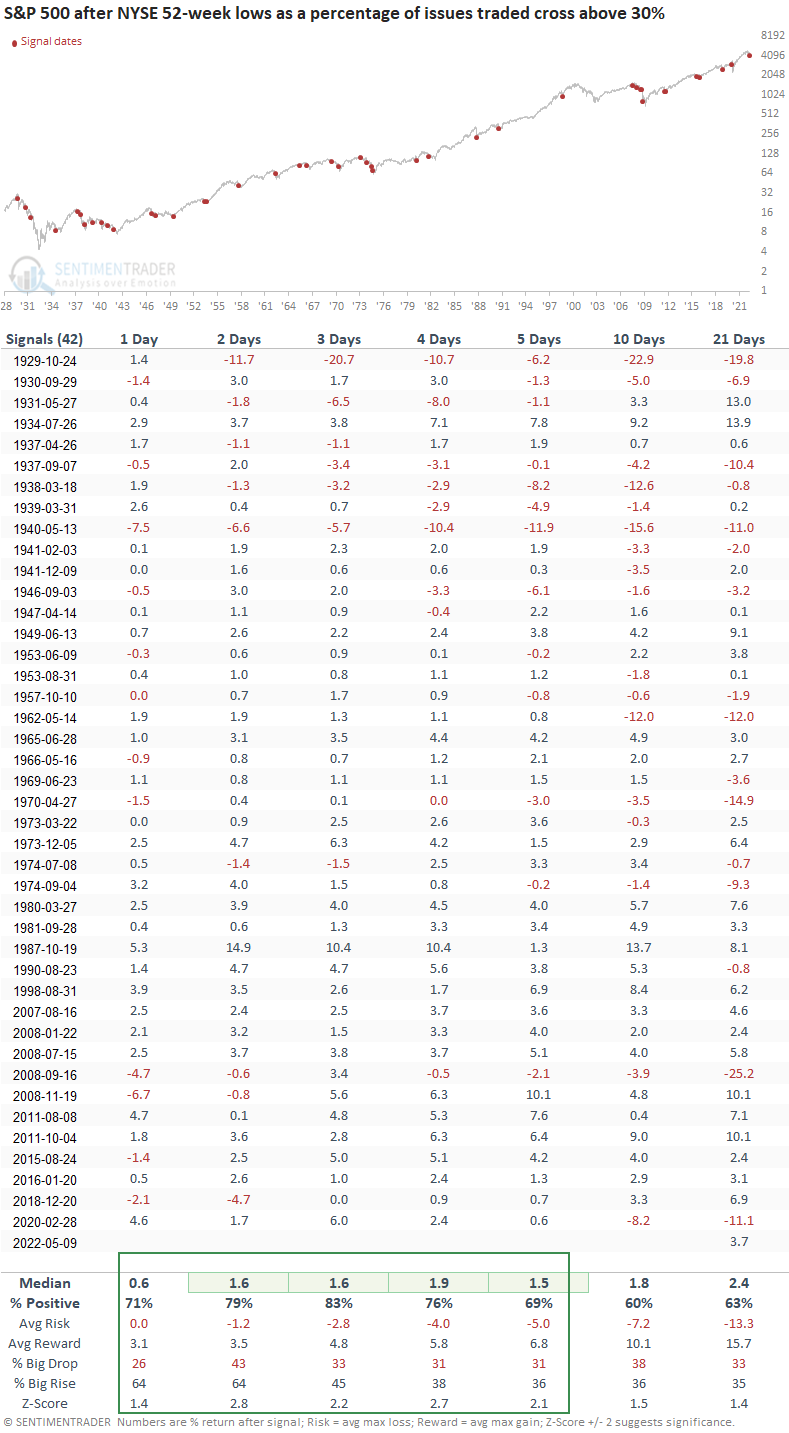
Given the strong performance in the 1-week time frame, let's review a short-term outlook table.
The market can bounce in the next few days
The short-term outlook table looks excellent in the first week, especially the 3-day window, which shows 31 out of 32 winners since 1940. I would also note that the pandemic crash signal shows a positive return in the first 5 days.
Similar spikes in new lows during a large correction
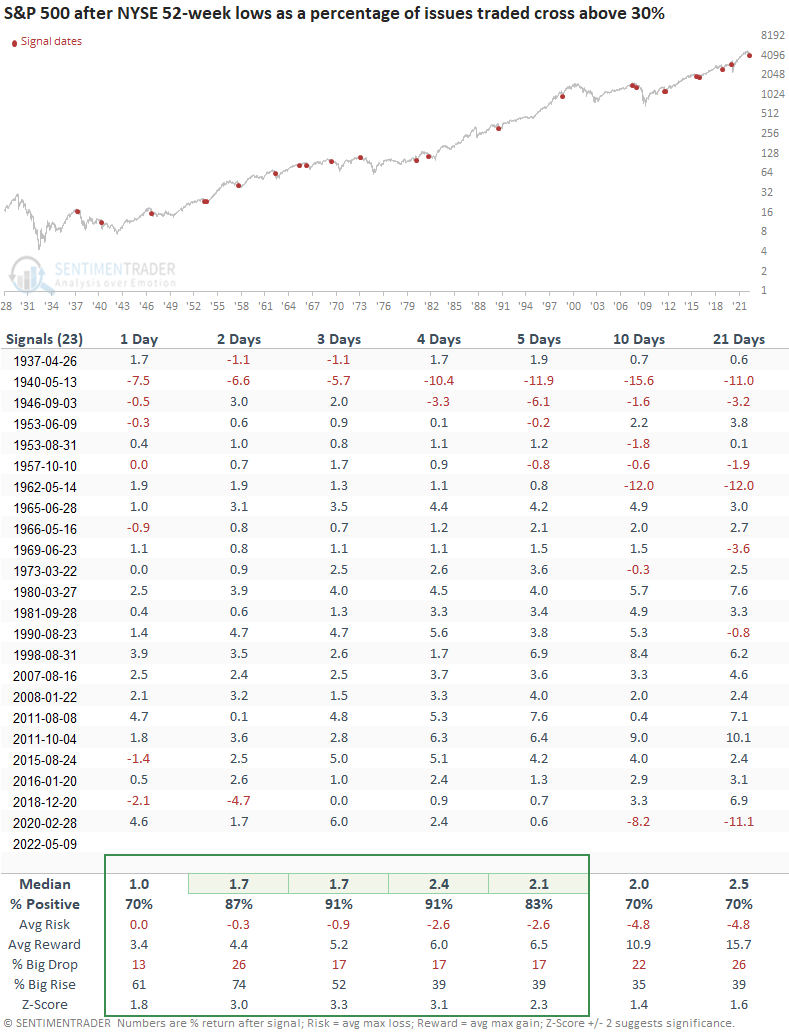
Let's add some context to the study. I will keep the original parameters but now require the S&P 500 to be within 20% of a multi-year, which is the case now.
This study generated a signal 23 other times over the past 85 years. After the others, S&P 500 future returns, win rates, and risk/reward profiles show a more favorable outlook in the next few months than our original study. The S&P 500 closed higher in the first week for 17 consecutive signals since 1962. Once again, the study shows a dropoff in performance in the 6-month time frame, which means we should keep an open mind about a potential retest if a bounce commences.
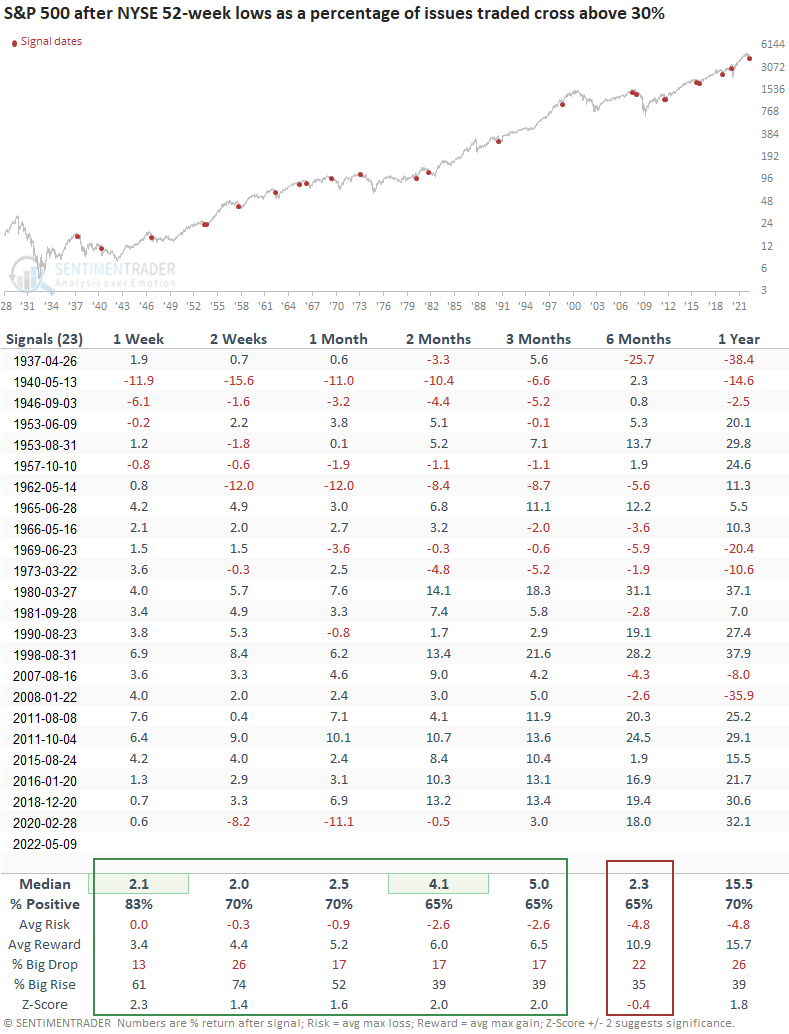
The bounce odds look even better when the S&P 500 is down less than 20%
When I apply the signals to the short-term outlook table, S&P 500 returns, win rates, and risk/reward profiles look excellent in the first week.
What the research tells us...
When the number of NYSE 52-week lows as a percentage of issues traded surges above 30%, stocks tend to stabilize and bounce in the near term. Similar setups to what we're seeing now have preceded positive returns in the next few months, with an even more compelling case for a trade opportunity in the first week. The outlook improves further if we isolate signals when the S&P 500 was down 20% or less from a multi-year high.
The spike in new lows provides us with a compelling case for a potential short-term bottom. However, we need to remember that the current market environment is somewhat unprecedented regarding interest rates, inflation, and Fed policy.