
Deviation from Trend Thrust Concept and Nikkei 225 Signal

The team at SentimenTrader.com is fond of using breadth-based indicators to measure a surge in participation that is typically associated with a bearish to a bullish reversal in trend for an index or ETF. However, due to index or ETF data limitations, one can't always rely upon a breadth-based trading signal.
Before breadth data was readily available, several market analysts devised price-based thrust models. The following indicator and trading signal utilize a derivative of price to identify a thrust signal.
Today's note aims to share a concept that uses a ratio between two moving averages to identify a bullish price-based thrust in a stock, index, or ETF.
DEVIATION FROM TREND INDICATOR CALCULATION
Average #1 = 4-Week Simple Moving Average of Price
Average #2 = 40-Week Simple Moving Average of Price
Ratio = Average #1/Average #2
THE CONCEPT
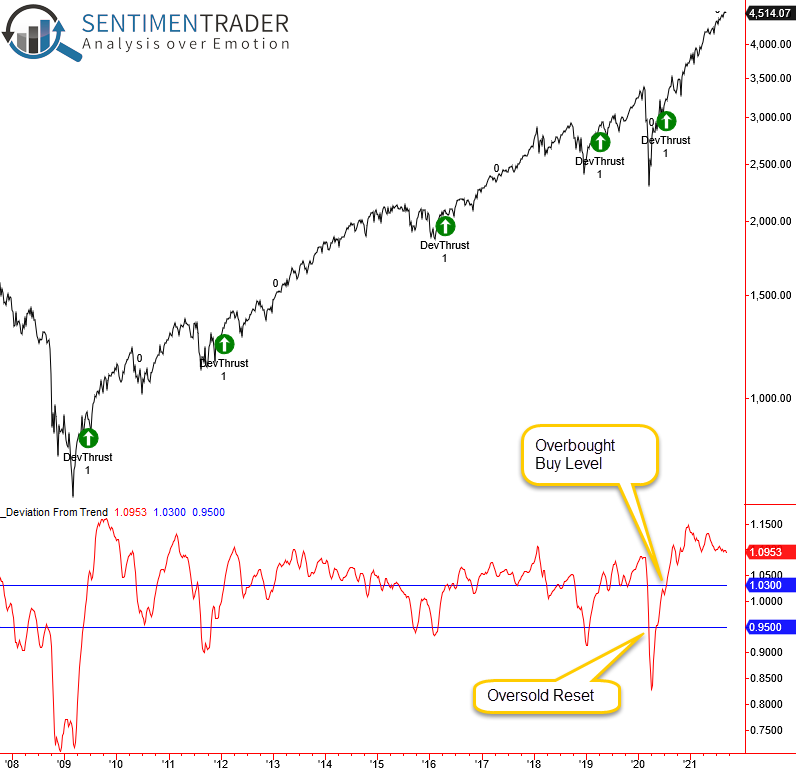
The deviation from trend signal identifies when the moving average ratio surges above a user-defined threshold level after an oversold reset condition. The model will issue an alert based upon the following conditions.
SIGNAL CRITERIA FOR THE S&P 500
- If the deviation from trend indicator crosses below the oversold reset level of 0.95, then the reset condition is active.
- If the reset condition is confirmed and the deviation from trend indicator crosses above the overbought buy level of 1.03, then buy.
The deviation from trend model is a component in the TCTM Composite Confirmation Model. The CCM component uses the same parameters as described in the above text.
CURRENT DAY CHART
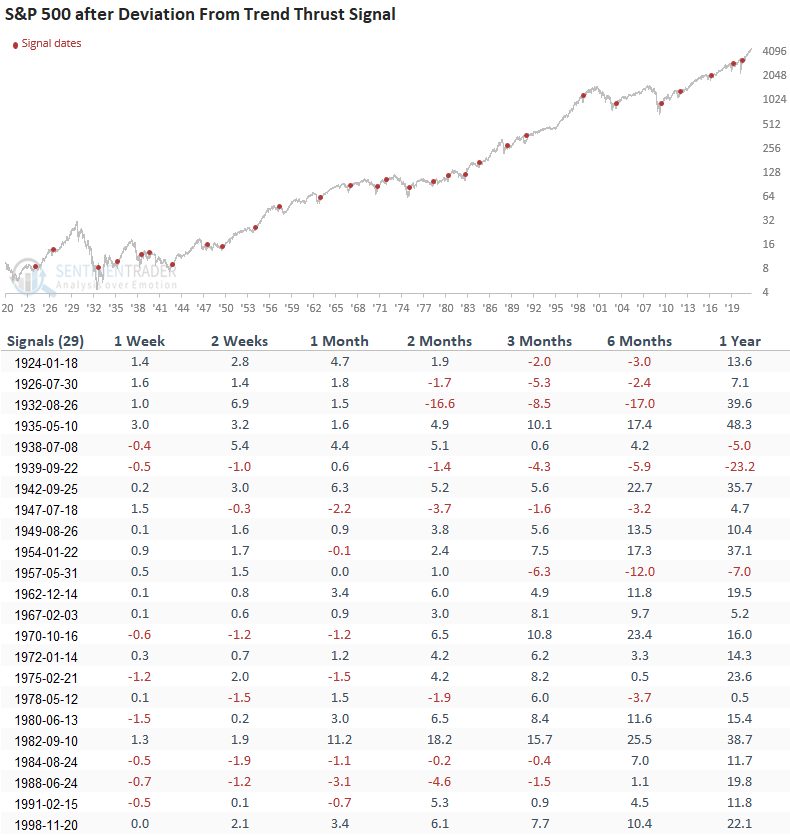
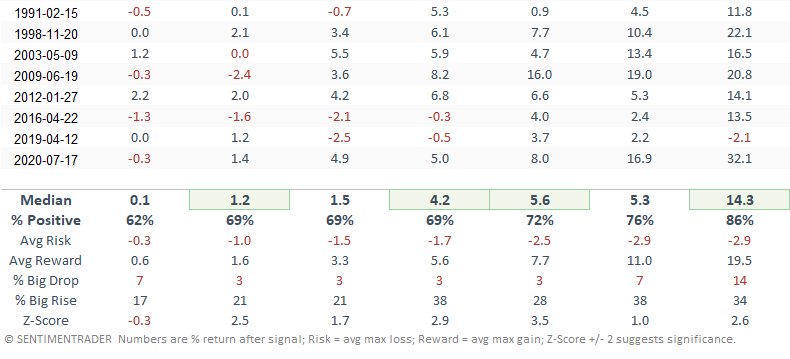
HOW THE SIGNALS PERFORMED
Results look robust across almost all timeframes with several notable z-scores.
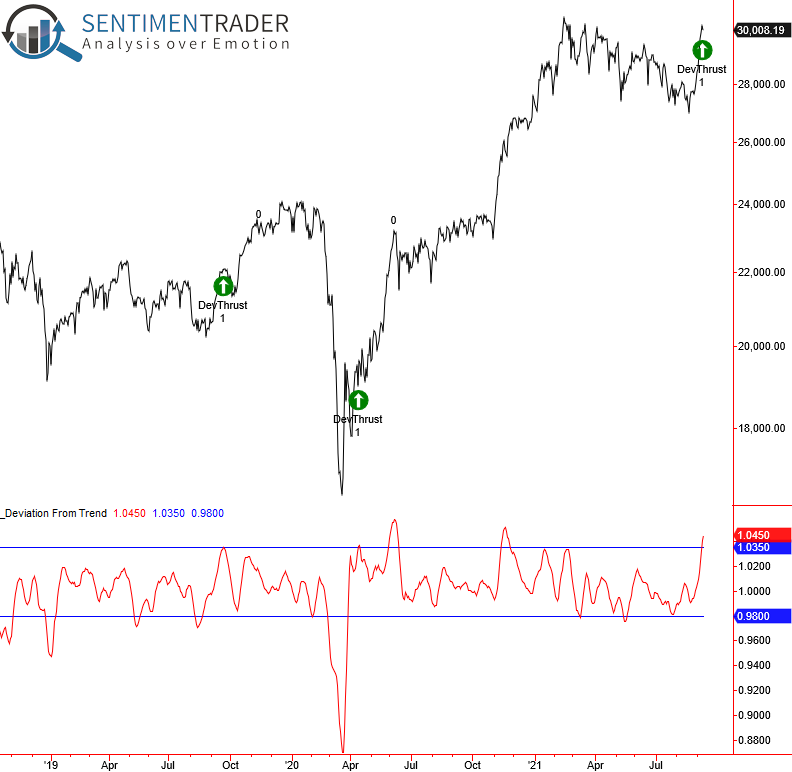
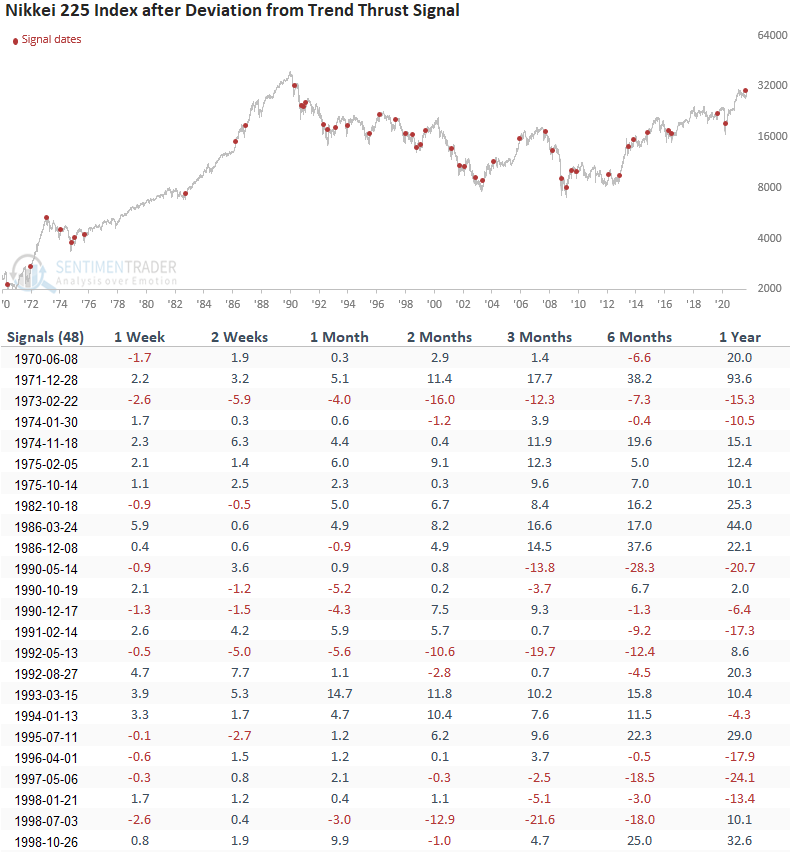
In a note on Wednesday, I shared a breadth-based thrust signal for the Nikkei 225 Index that triggered on 9/7/21. The deviation from trend signal for the Nikkei 225 Index triggered an alert at the close of trading on 9/8/21.
Let's assess the forward return outlook for the Nikkei 225 Index.
I would note that the Nikkei 225 Index signal utilizes daily data, and the ratio compares a 6-day moving average to an 18-day moving average. The threshold levels are 0.98 and 1.035.
CURRENT DAY CHART - NIKKEI 225 INDEX
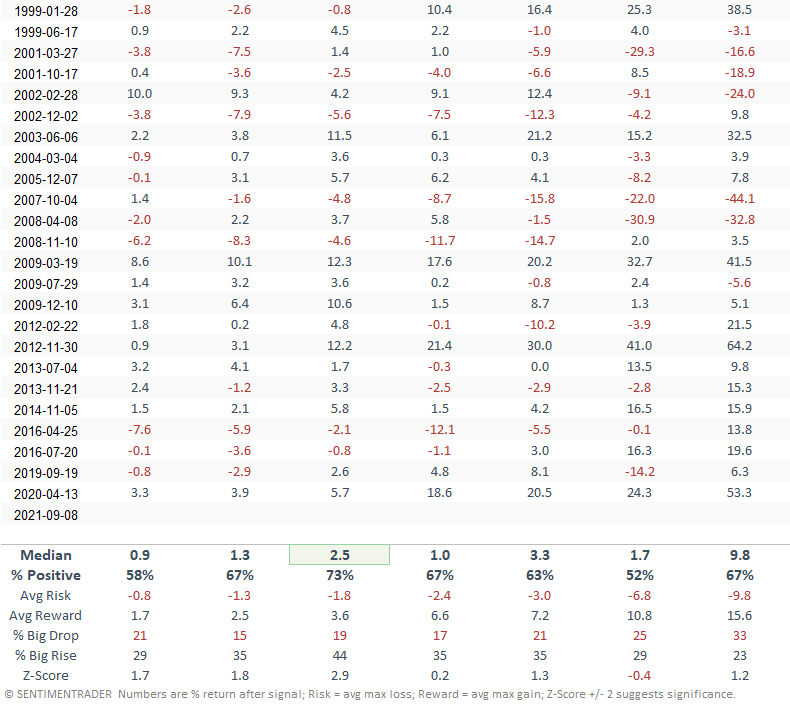
HOW THE SIGNALS PERFORMED
The short-term results look good, especially the 1-month timeframe. The intermediate to long-term performance numbers are primarily in line with historical returns.
The deviation from trend concept provides a flexible approach that can be utilized on any timeframe to identify a price-based momentum thrust for stocks, indexes, and ETFs. While the TCTM Composite Confirmation Model uses weekly data, I monitor daily data for trade ideas. And, I leave the moving average input lengths static at 6 and 18 days. Depending on the underlying security, I may adjust the oversold and overbought threshold levels.