Data &
Technology
Research
Reports
Report Solutions
Reports Library
Actionable
Strategies
Free
Resources
Simple Backtest Calculator
Simple Seasonality Calculator
The Kelly Criterion Calculator
Sentiment Geo Map
Public Research Reports
Free Webinar
Pricing
Company
About
Meet Our Team
In the News
Testimonials
Client Success Stories
Contact
Log inLoginSign up
< BACK TO ALL REPORTS

Despite the "reflation trade," fewer Industrials are trending higher

Jason Goepfert
2021-01-07
The percentage of Industrial stocks trading above their 50-day moving average has dropped below 70% for the first time in months.

Industrial stocks have been one of the bright lights of the re-opening crowd, with investors focusing on them to potentially signal that the engine of commerce is really steaming.

They suffered a hiccup to start the New Year. After months with an overwhelming majority of industrials holding above their medium-term trends, that dropped quite a bit as the calendar turned. For the first time in nearly 2 months, fewer than 70% of industrial stocks traded above their 50-day moving averages.

XLI industrial members above 50 day moving average

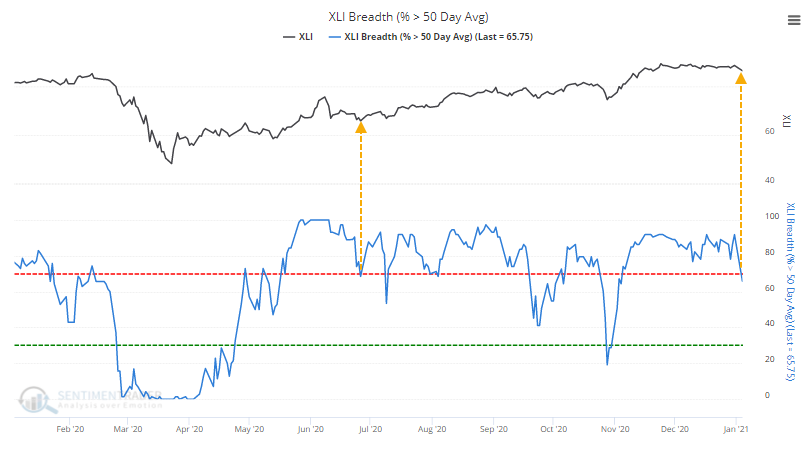
The last time the sector enjoyed an extended run with more than 70% of stocks above their 50-days, when it first dropped below 70%, the sector turned immediately and headed higher. Historically, it hasn't been quite so easy.


What else is happening

These are topics we explored in our most recent research. For immediate access with no obligation, sign up for a 30-day free trial now.

  • Forward returns when the percentage of industrial stocks above their 50-day averages drops below 70%
  • Returns in XLI when Twitter users are optimistic (like now) versus pessimistic
  • Corporate insiders aren't buying a lot of shares in industrial companies
  • A look at the seasonal window in XLI
  • What happens to industrial stocks when the ISM Manufacturing survey rises above 60
  • The Russell 2000 fund, IWM, gapped up almost the most-ever when at a new high
  • Financials had a big spike versus tech
  • What seasonality says about prospects for the British pound
  • Returns since 1926 when small-cap stocks see a big jump to a new high

Stat Box

On Wednesday, the Russell 2000 rose more than 3% to an all-time high. Since the index's inception in 1979, the only other day that can claim such a good performance was February 29, 2000.

Sentiment from other perspectives

We don't necessarily agree with everything posted here - some of our work might directly contradict it - but it's often worth knowing what others are watching.

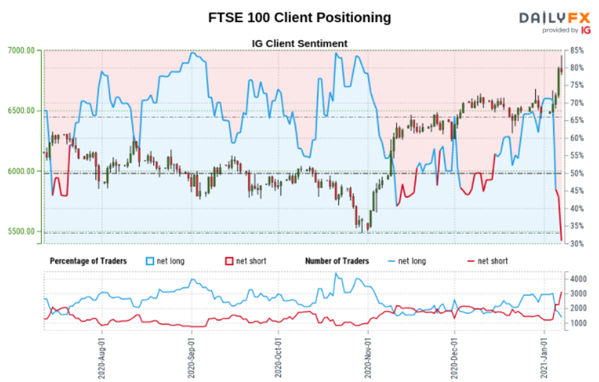
1. Retail traders have gone heavily short the FTSE 100, and they have a pretty good record at actually being correct. [DailyFX]

brokerage client ftse net long

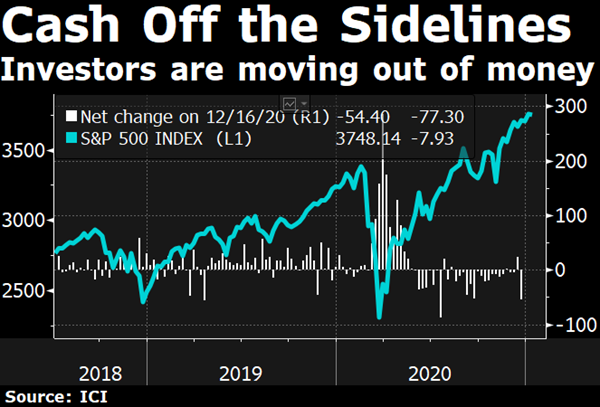
2. With stocks doing well and neighbors getting rich, it gets harder and harder to justify holding cash, so investors are deciding to hold less of it. [Bloomberg TV]

money market flow

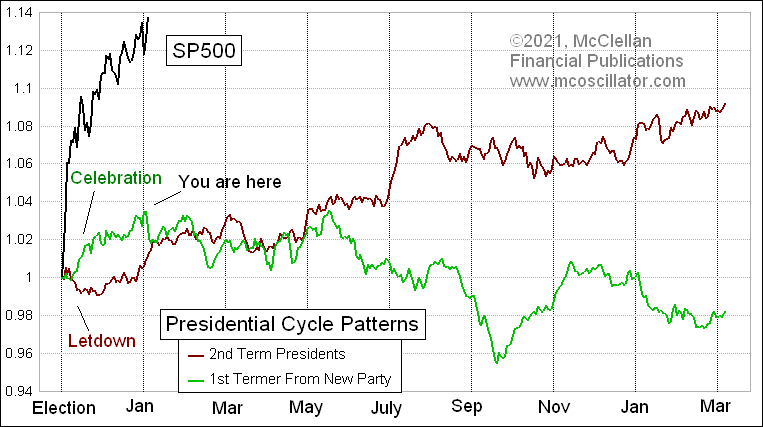
3. Investors have enjoyed the "celebration" part of the cycle when a new president gets elected, and if history is any kind of a guide then the hangover is about to begin. [Tom McClellan]

presidential cycle

DATA &
TECHnologies
IndicatorEdge
‍
BackTestEdge
‍
Other Tools
‍
DataEdge API
RESEARCH
reports
Research Solution
‍
Reports Library
‍
actionable
Strategies
Trading Strategies
‍
Smart Stock Scanner
‍
FREE
RESOUrCES
Simple Backtest
Calculator
Simple Seasonality
Calculator
The Kelly Criterion
Calculator
Sentiment Geo Map
‍
Public Research Reports
‍
Free Webinar
COMPANY
‍
About
‍
Meet our Team
‍
In the News
‍
Testimonials
‍
Client Success Stories
Pricing
Bundle pricing
‍
Announcements
‍
FAQ
© 2024 Sundial Capital Research Inc. All rights reserved.
Setsail Marketing
TermsPrivacyAffiliate Program
Risk Disclosure: Futures and forex trading contains substantial risk and is not for every investor. An investor could potentially lose all or more than the initial investment. Risk capital is money that can be lost without jeopardizing ones’ financial security or life style. Only risk capital should be used for trading and only those with sufficient risk capital should consider trading. Past performance is not necessarily indicative of future results.

Hypothetical Performance Disclosure: Hypothetical performance results have many inherent limitations, some of which are described below. No representation is being made that any account will or is likely to achieve profits or losses similar to those shown; in fact, there are frequently sharp differences between hypothetical performance results and the actual results subsequently achieved by any particular trading program. One of the limitations of hypothetical performance results is that they are generally prepared with the benefit of hindsight. In addition, hypothetical trading does not involve financial risk, and no hypothetical trading record can completely account for the impact of financial risk of actual trading. for example, the ability to withstand losses or to adhere to a particular trading program in spite of trading losses are material points which can also adversely affect actual trading results. There are numerous other factors related to the markets in general or to the implementation of any specific trading program which cannot be fully accounted for in the preparation of hypothetical performance results and all which can adversely affect trading results.

Testimonial Disclosure: Testimonials appearing on this website may not be representative of other clients or customers and is not a guarantee of future performance or success.