Products
SentimenTrader Trading Tools
‍
Backtest Engine
My Trading Toolkit
Correlation Analysis
Seasonality
Market Prediction
Indicators & Data API
‍
Proprietary Indicators & Charts
Market Data API
Strategies & Scanner
‍
50+ Trading Strategies
Smart Stock Scanner
Smart Option Scanner
Research Reports
‍
Research Solutions
Reports Library
Free Resources
Simple Backtest Calculator
Simple Seasonality Calculator
The Kelly Criterion Calculator
Sentiment Geo Map
Public Research Reports
Education
Sentiment Indicators
Technical Indicators
Pricing
Company
About
In the News
Testimonials
Client Success Stories
Contact
Log inLoginSign up
< BACK TO ALL REPORTS

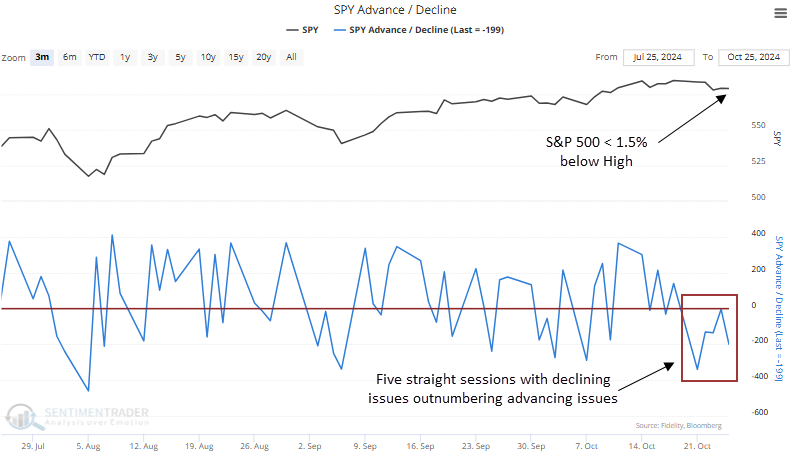
Decliners in the S&P 500 have topped advancers for five straight days

Dean Christians
2024-10-28
For only the 20th time since 1954, declining issues for S&P 500 members exceeded advancing issues for five consecutive sessions, with the index hovering within 1.5% of a 5-year high. Comparable breadth dynamics preceded a short-term pause in the S&P 500.

Key points:

  • Each trading session over the last week saw more S&P 500 stocks fall than rise
  • Similar breadth conditions near a high tended to precede a multi-week consolidation
  • Calendar and election-year seasonality trends are poised to turn favorable

A negative skew in the advance-decline differential suggests a short-term pause

Stocks have rallied with impressive breadth, demonstrating resilience by ignoring the typically weak seasonal periods of August and September. However, last week's market breadth was poor, as the number of declining stocks in the S&P 500 exceeded advancing issues in each trading session. 

While the negative skew in participation is likely due to investors' hesitation surrounding the upcoming election, it's always best to take an evidence-based approach to market analysis rather than speculating on possible interpretations. 

Comparable market breadth conditions preceded a short-term consolidation

Whenever declining issues for the S&P 500 exceeded advancing issues for five straight sessions, with the index hovering less than 1.5% below a 5-year high, the world's most benchmarked index tended to undergo a multi-week consolidation. At some point over this time frame, the index displayed a loss in 15 out of 19 instances. 

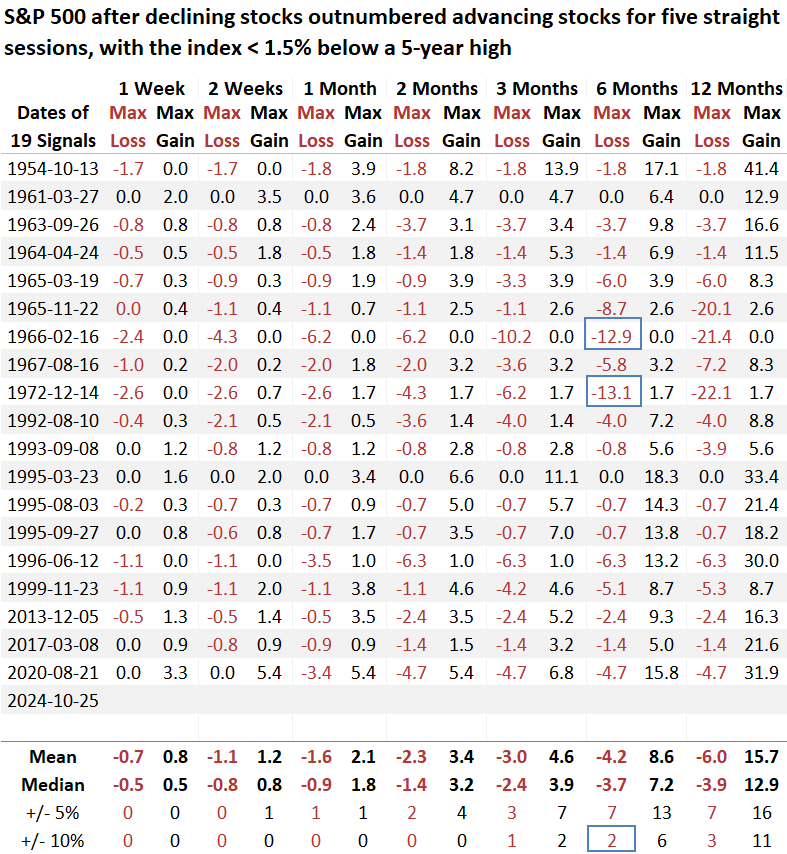
Any pullback or consolidation should be viewed as a buying opportunity as returns and win rates over the next six and twelve months exceeded historical norms, especially since 1992.

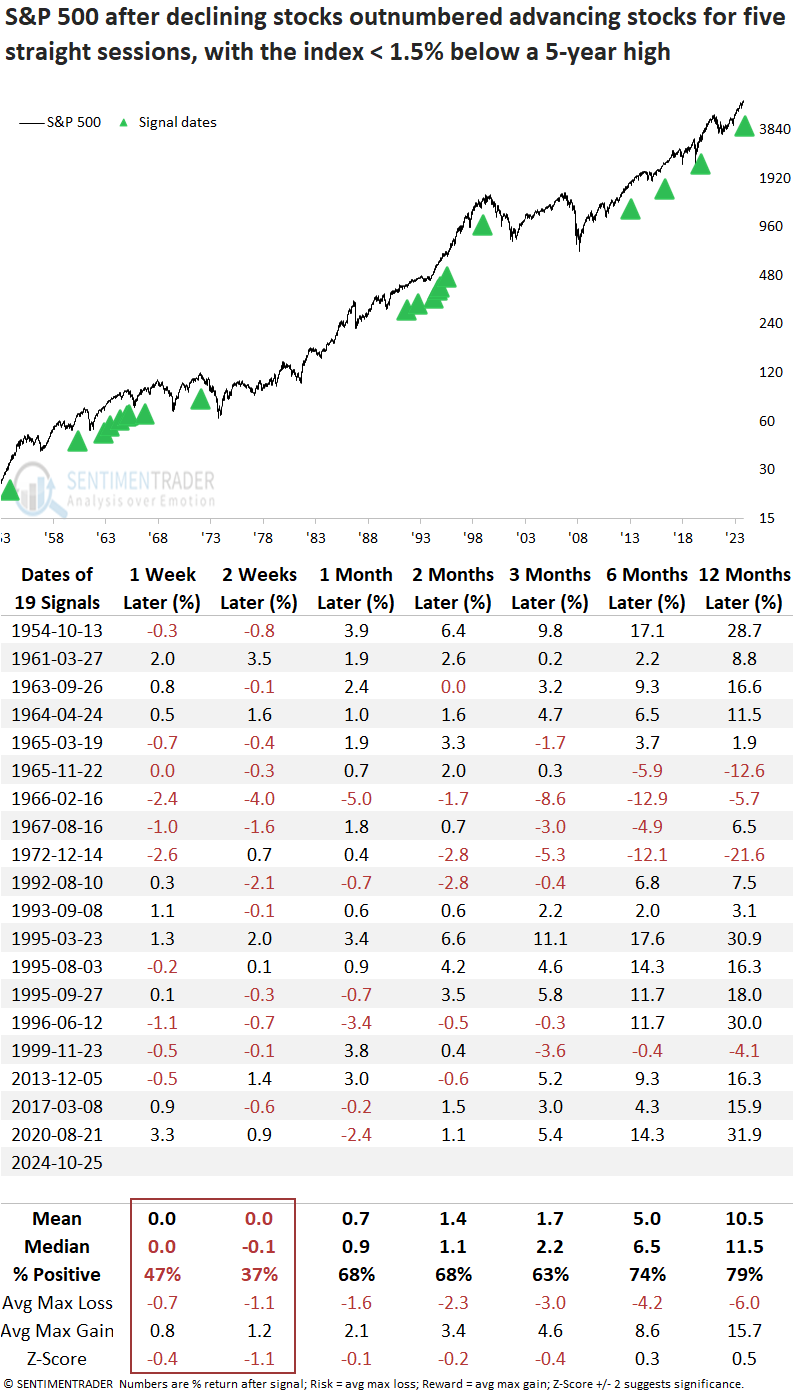
Over the subsequent six months, the S&P 500 sustained just two instances of a maximum loss exceeding 10%, a threshold that has not been breached since before 1973. Consequently, the chances of last week's negative breadth developing into something more significant appears less probable.  

Seasonality

As illustrated in the table below, today's trading session marks the last day of a seasonally weak period ahead of the presidential election. If you're seeking an explanation for last week's negative breadth, the typical jitters associated with pre-election periods might be the cause. 

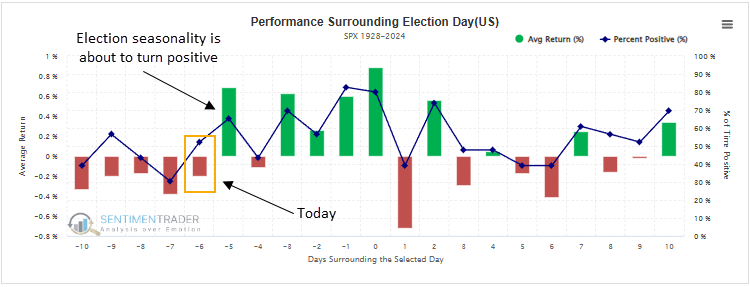
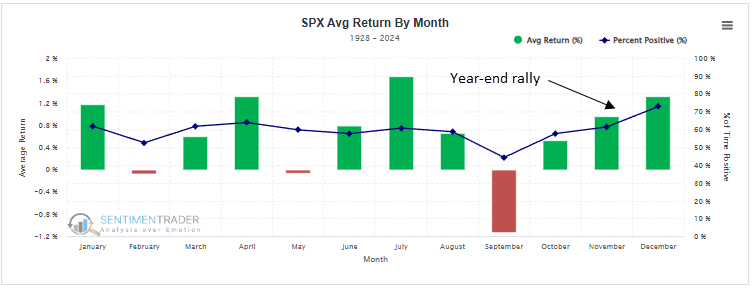
Although today's analysis suggests the broad market could drift sideways for a few weeks, investors should keep sight of the big picture, given that stocks are set to enter the advantageous seasonal period from November to May. 

What the research tells us...

Last week, the S&P 500 saw a consistent pattern of declining issues outpacing advancing ones each day, a dynamic that may partly stem from seasonal trends typically observed ahead of a presidential election. Historically, such patterns often lead to a period of consolidation for the index over several weeks. However, with favorable seasonal trends on the horizon, investors might view any short-term weakness as an opportunity to buy the dip, positioning for potential upside ahead of the November to May period.

PRODUCTS
SentimenTrader
Trading Tools
Indicators & Data API
‍
Strategies & Scanner
‍
Research Reports
FREE
RESOUrCES
Simple Backtest
Calculator
Simple Seasonality
Calculator
The Kelly Criterion
Calculator
Sentiment Geo Map
‍
Public Research Reports
‍
Education
Sentiment Indicators
‍
Technical Indicators
‍
Pricing
Bundle pricing
‍
FAQ
‍
Announcements
‍
COMPANY
‍
About
‍
In the News
‍
Testimonials
‍
Client Success Stories
CONTACT
‍
General Inquiries
‍
Media Inquiries
‍
Financial Professionals Inquiries
‍
© 2026 Sundial Capital Research Inc. All rights reserved.
Setsail Marketing
TermsPrivacyAffiliate Program
Risk Disclosure: The information and tools provided are for research and analytical purposes only and are not intended as investment advice. Market analysis involves uncertainty, and outcomes may differ from expectations. Users should conduct their own due diligence and consider their individual circumstances before making any financial decisions. Past performance is not necessarily indicative of future results.

Hypothetical Performance Disclosure: Hypothetical performance results have many inherent limitations, some of which are described below. No representation is being made that any account will or is likely to achieve profits or losses similar to those shown; in fact, there are frequently sharp differences between hypothetical performance results and the actual results subsequently achieved by any particular trading program. One of the limitations of hypothetical performance results is that they are generally prepared with the benefit of hindsight. In addition, hypothetical trading does not involve financial risk, and no hypothetical trading record can completely account for the impact of financial risk of actual trading. for example, the ability to withstand losses or to adhere to a particular trading program in spite of trading losses are material points which can also adversely affect actual trading results. There are numerous other factors related to the markets in general or to the implementation of any specific trading program which cannot be fully accounted for in the preparation of hypothetical performance results and all which can adversely affect trading results.

Testimonial Disclosure: Testimonials appearing on this website may not be representative of other clients or customers and is not a guarantee of future performance or success.