
Dealing With the Weight Issue

For the record, the title does not refer to anything related to my "Covid Diet." On the positive side, yes, in some ways, I was able to revisit my youth (rediscovering Froot Loops and Chips Ahoy, for instance), which was nice. However, on the negative side, I spent most of the last year+ eschewing salads rather than actually chewing salads. But I digress.
What the title is actually referring to is "Cap-Weighted Indexes" versus "Equal-Weight Indexes." In a capitalization-weighted index, the index constituents are weighted according to market cap (i.e., price times shares outstanding), so the biggest stocks have the most influence on the index fluctuations. With an Equal-Weight index, each constituent stock gets equal weighting. Does this make a difference?
As it turns out, it's kind of like chewing versus eschewing.
WHAT TO KNOW
It is not uncommon for investors to wonder - "which is better, cap-weighted or equal-weight?" And numerous pundits are willing to weigh in to argue why one approach is better than the other. However - much like growth versus value or large-cap versus small-cap - the correct answer to the question "Which is better, weighted or equal-weight" is "it depends," as in, "it depends which way the wind is presently blowing."
THE DATA
For our purposes, we will use monthly total return data for the S&P 500 Index and the Equal-Weight S&P 500 Index (which was first calculated in January 1990). Figure 1 displays the cumulative total return for both indexes since 1990.
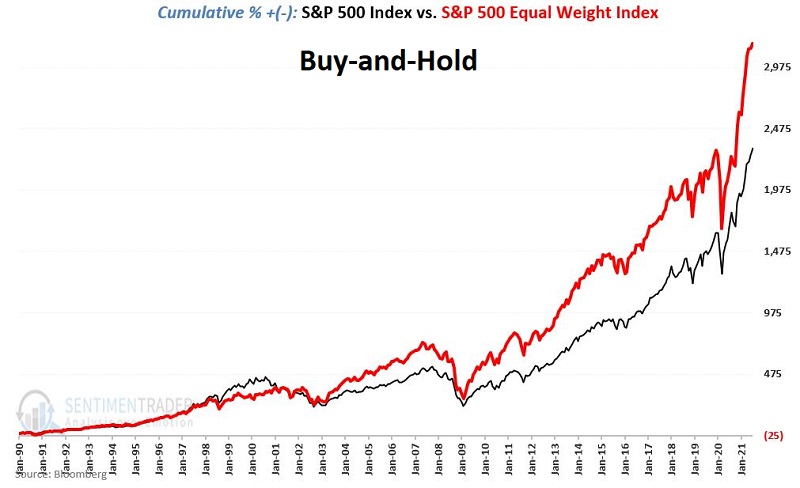
As you can see, the Equal-Weight Index has outperformed the more widely known S&P 500 Index. So, does that mean it is better? That is the argument that some might make and the conclusion that they might draw. As such, this seems like a good time to invoke:
Jay's Trading Maxim #40: Remember, no style, sector, or index holds a permanent advantage. When it comes to the financial markets, there is an ebb and a flow to everything. If you find yourself starting to think that that's no longer true, pay close attention - because things are probably about to change.
THE TEST
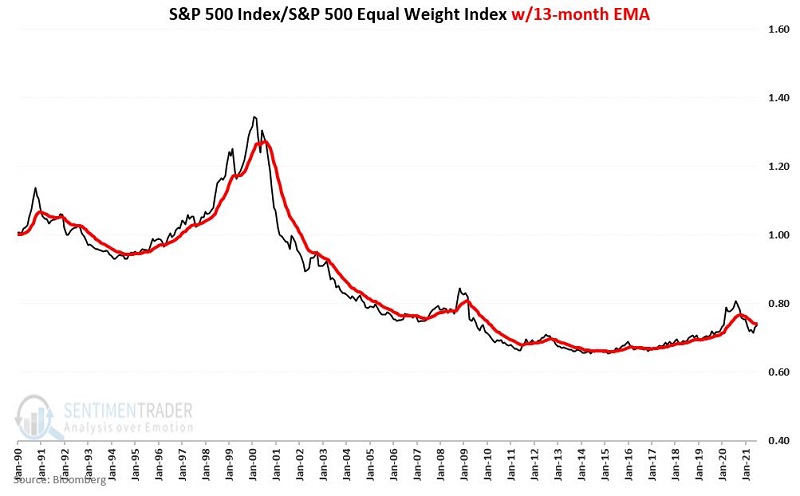
The chart below divides the cumulative value of $1,000 invested in the S&P 500 Index by the cumulative value of $1,000 invested in the Equal-Weight S&P 500 Index (NOT the index price values themselves) to get a ratio (black line) and adds a 13-month exponential moving average (red line) of the ratio itself. As you can see, there is - not surprisingly - an ebb and a flow to this relationship.
Now let's subtract the 13-month exponential moving average from the actual ratio. The difference appears in the chart below.
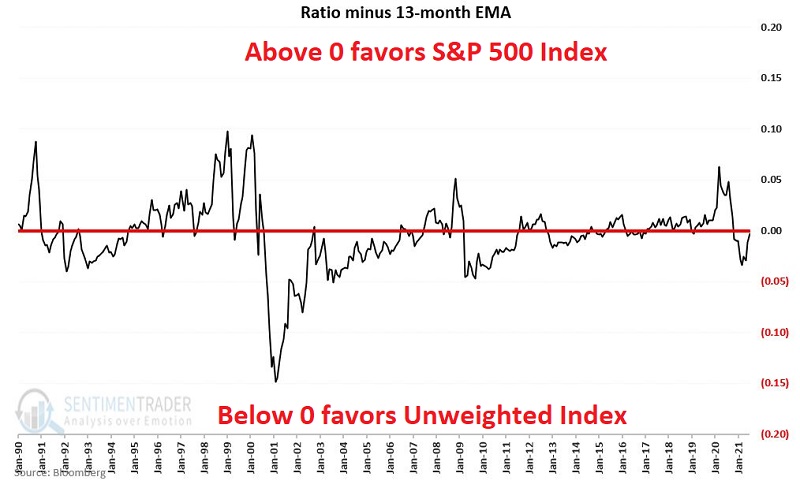
When the value in the chart above is:
- Positive it favors the S&P 500 Index
- Negative it favors the Equal-Weight S&P 500
So, let's consider an actual trading method.
A SIMPLE METHOD
*When the value in the chart above is positive, we will hold the S&P 500 Index for the next month
*When the value in the chart above is negative, we will hold the Unweighted S&P 500 Index for the next month
We will refer to this as the "Switch" strategy.
For comparison's sake, we will also track what happens if we "split" $1,000 50/50 between the two indexes and rebalance to a 50/50 split at the beginning of each year.
We will refer to this as the "Split" strategy.
Technical Note: The database I use reports total return data for the previous month early in the next month, i.e., I get the monthly total return values for August in early September. As a result, I use a 1-month lag for tracking purposes. In other words, if I receive data in early September that signals a change at the end of August, then the actual switch from one index to the other takes place at the close of September. Also, because of this lag, the following test begins at the end of February 1990.
PERFORMANCE BASED ON RATIO VERSUS 13-MONTH EMA
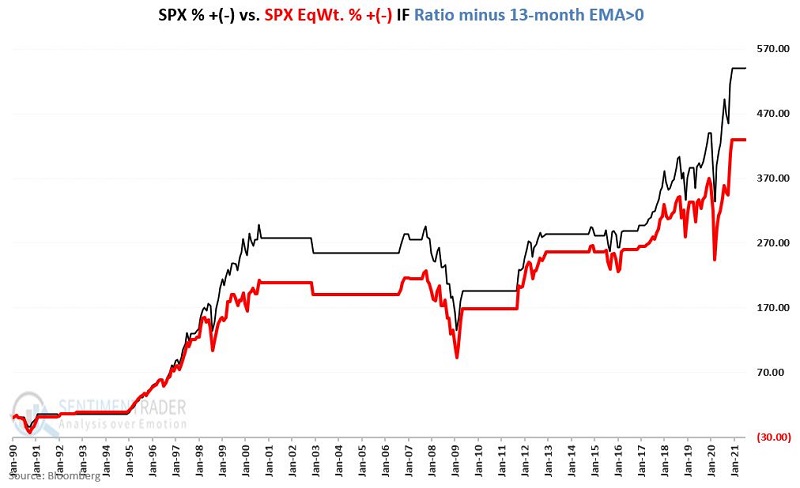
The chart below displays the cumulative % return for both indexes:
- ONLY when the chart above is positive (i.e., SPX/Equal-Weight Ratio > 13-month EMA)
The chart below displays the cumulative % return for both indexes:
- ONLY when the chart above is negative (i.e., SPX/Equal-Weight Ratio < 13-month EMA)
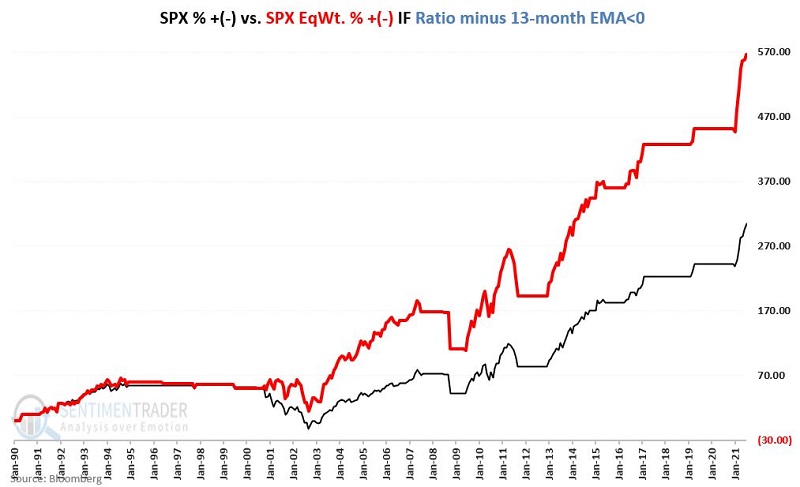
What we find is that when:
- The ratio of index performance minus the 13-month EMA is positive, the S&P 500 Index has gained +540%, and the Unweighted Index has gained +430%
- The ratio of index performance minus the 13-month EMA is negative, the Unweighted Index has gained +566%, and the S&P 500 Index has gained +304%
CREATING A STRATEGY
The chart below displays the cumulative total return for our rudimentary "Switch" versus the "Split" strategy.
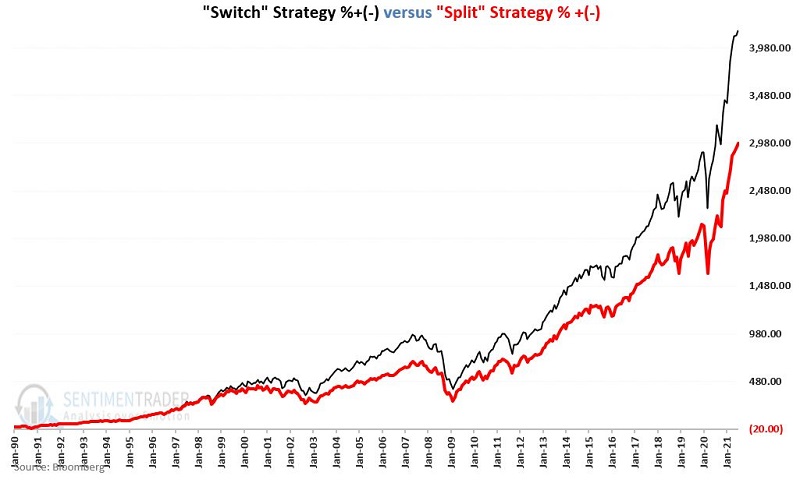
The table below tells the "Tale of the Numbers."
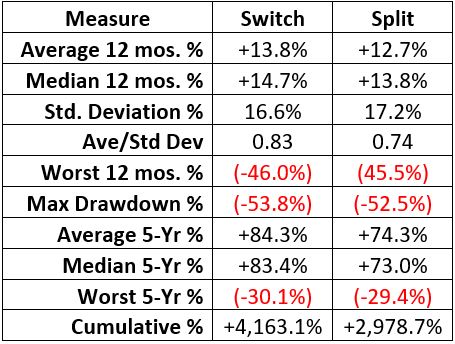
The bottom line is that "Switch" has gained 40% more than "Split" over roughly 31 years.
For the record, the "Switch" strategy was in the S&P 500 Index from the end of March 2017 - except for March and April of 2019 - through October 2020. The "Switch" strategy has been in the Equal-Weight S&P 500 Index since January 1st of 2021.
SUMMARY
As always, the "strategy" (such as it is) presented here should NOT be considered as a "recommendation." As you can see in the table above, it involves a fair amount of volatility and some significant drawdowns (remember, this "strategy" is always fully invested in one index or the other, so bear market declines are inevitable).
Still, for someone planning to keep some money fully invested in an index, this might be one way to enhance returns over time. For those interested in actually applying this or some other similar strategy, note that:
- Ticker SPY (among several others) tracks the S&P 500 Index
- Ticker RSP tracks the S&P 500 Equal Weight Index.
That said, remember that the real purpose of this piece is NOT to convince anybody that they should employ this particular approach. The real purpose is to highlight the importance of recognizing the ebb and flow in the markets.
Dean showed yesterday that the relative ratio between the equal- and cap-weighted versions of the index looks to (slightly) favor the latter. If the ratio between the indexes climbs above its 13-month EMA (which it's close to doing), that would be another point in the cap-weighted index's favor.