Headlines
|
|
Grading the market studies for 2021:
This year, our studies proved to be successful in aggregate, but there were the most 1-star pieces of research (that proved to be totally wrong) in the past 5 years. There were also a lot of 5-star, effective, studies, showing that this was a binary year when things either worked really well, or not at all.
|
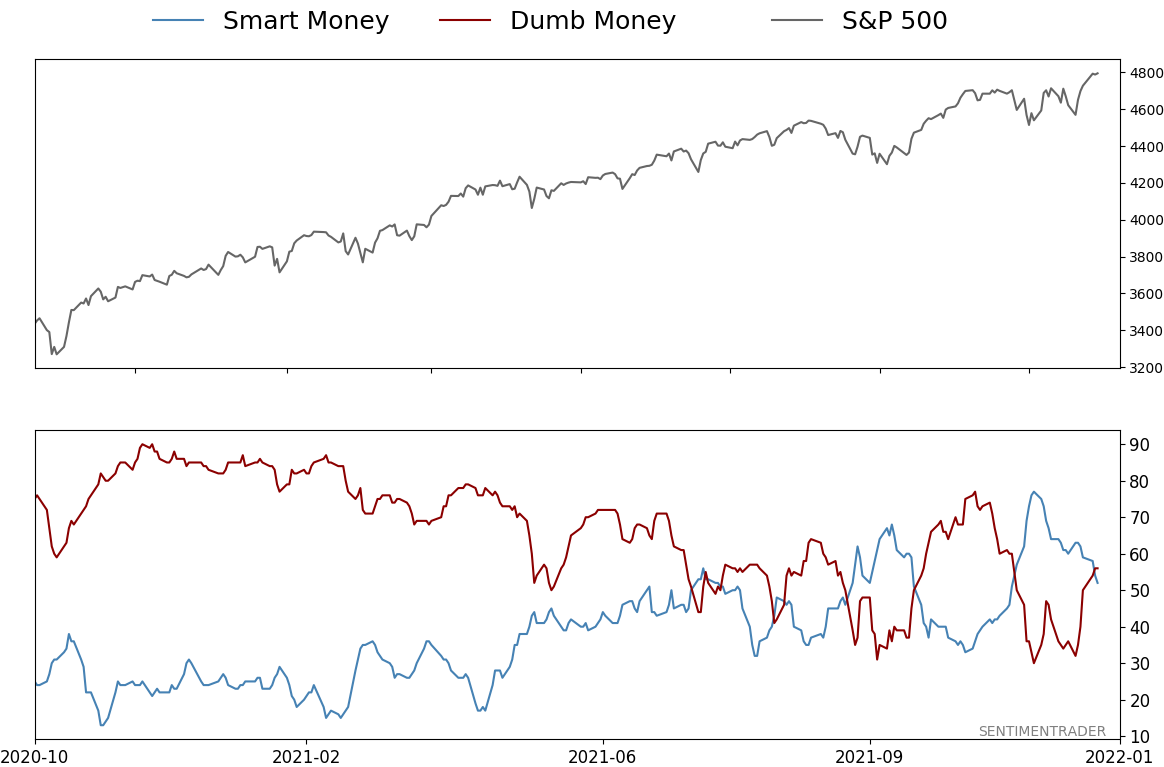
Smart / Dumb Money Confidence
|
Smart Money Confidence: 52%
Dumb Money Confidence: 56%
|
|
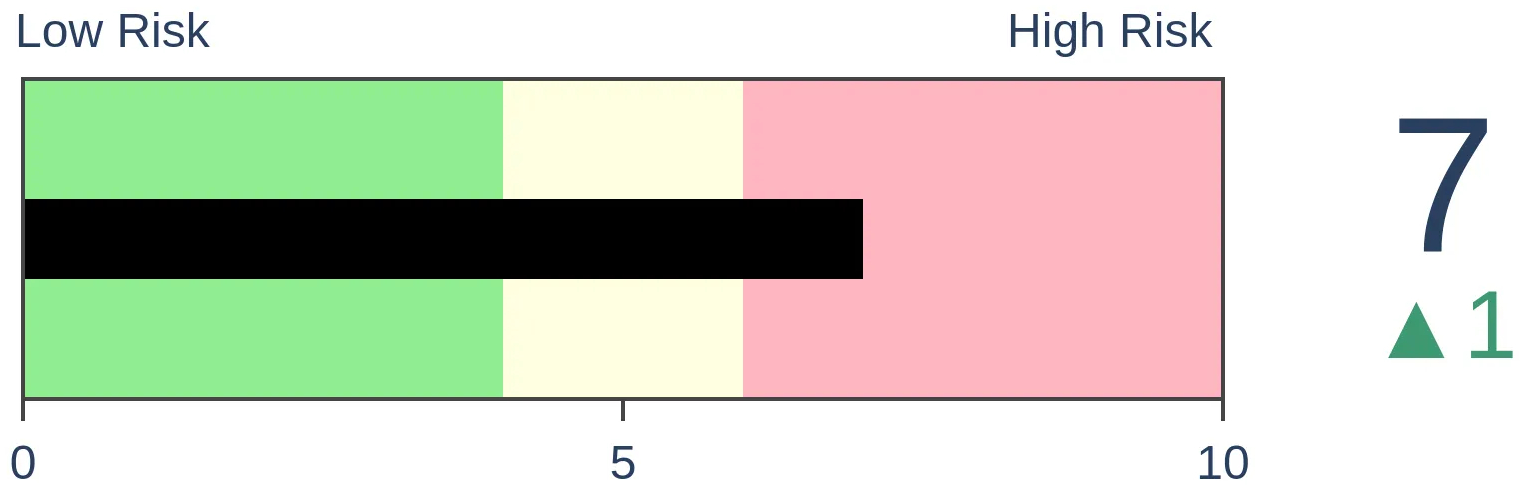
Risk Levels
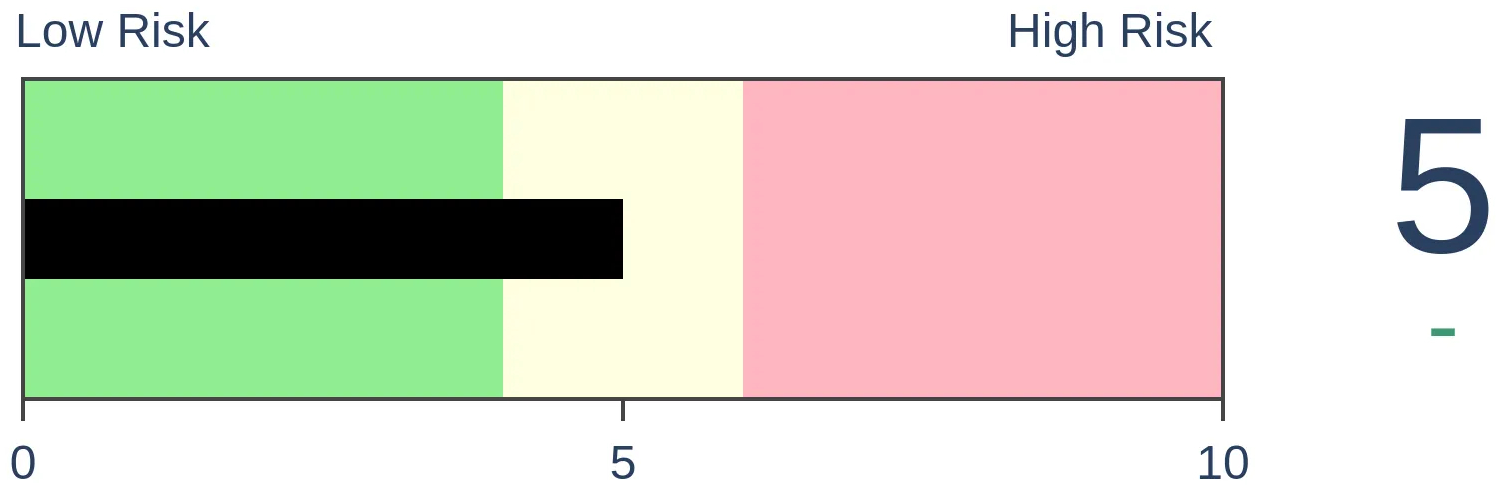
Stocks Short-Term
|
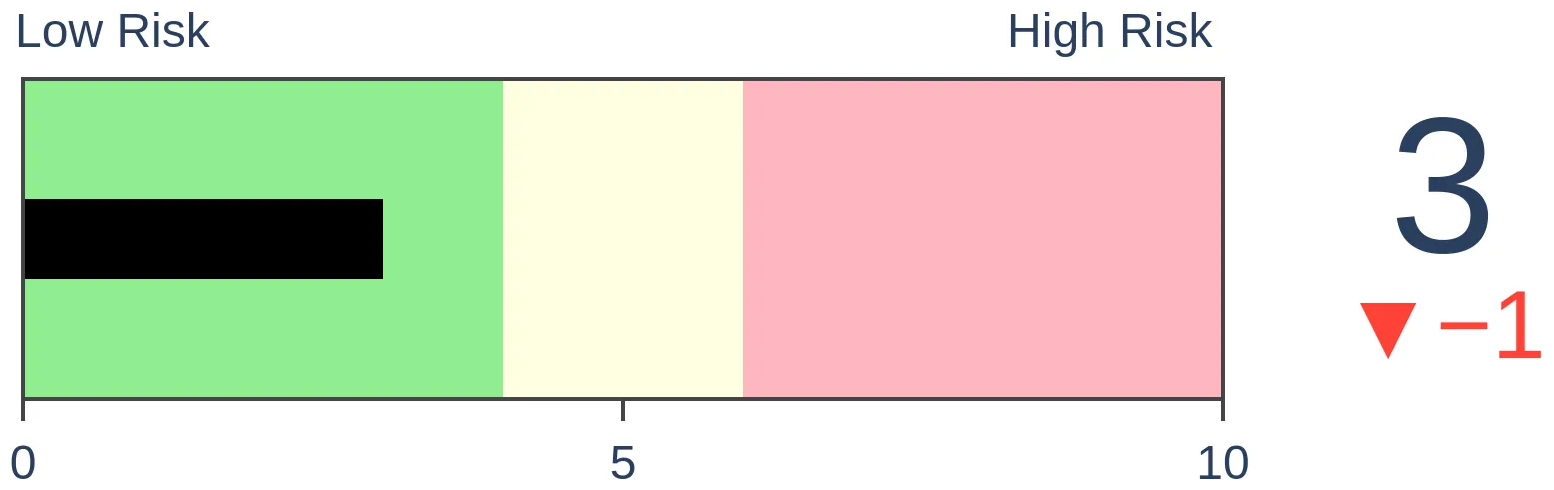
Stocks Medium-Term
|
|
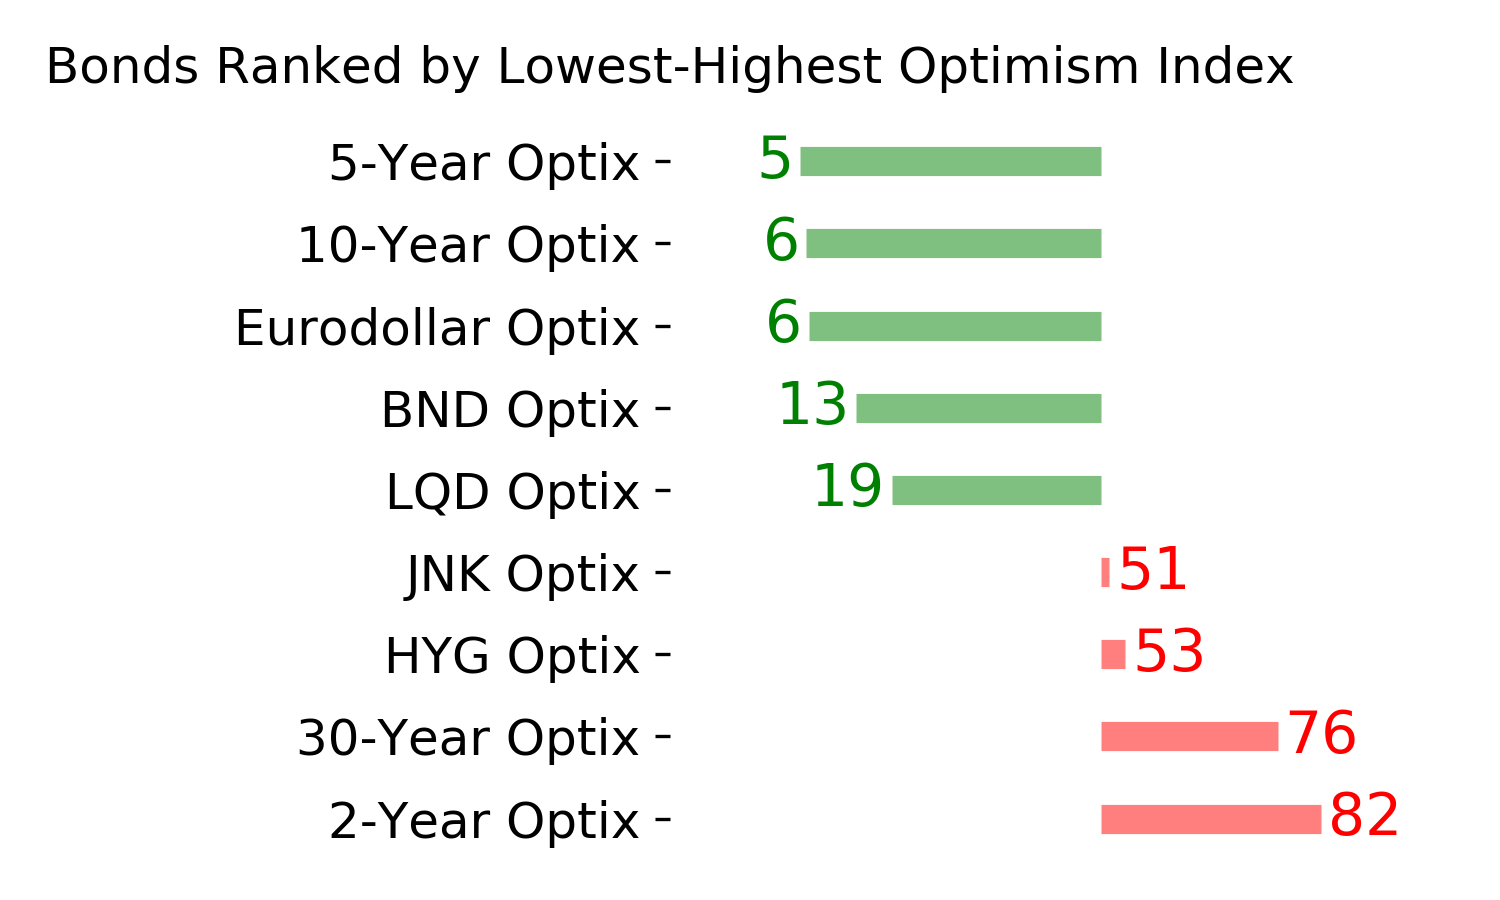
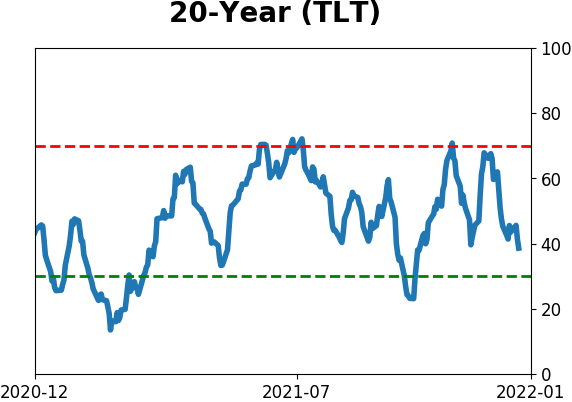
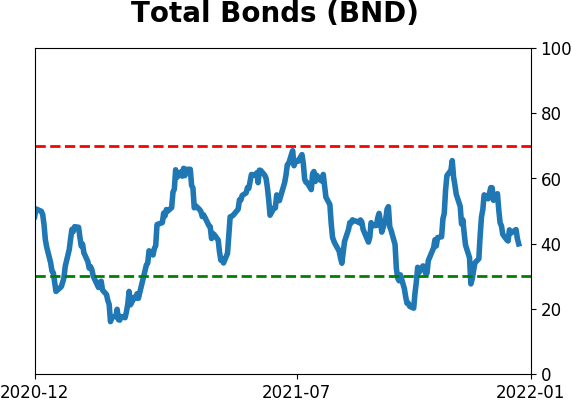
Bonds
|
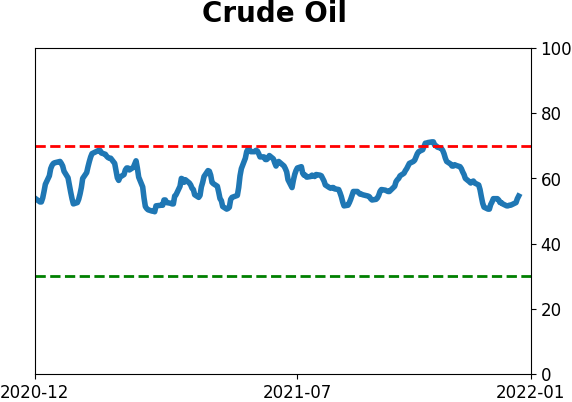
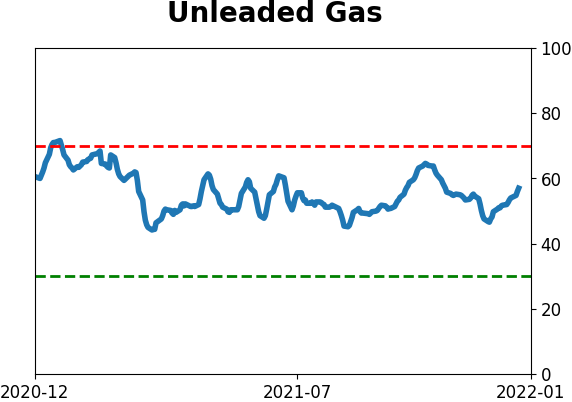
Crude Oil
|
|
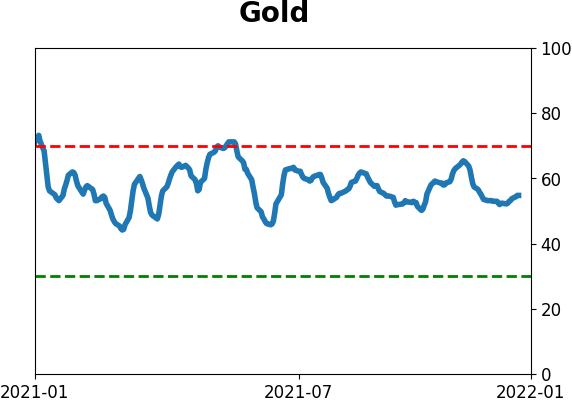
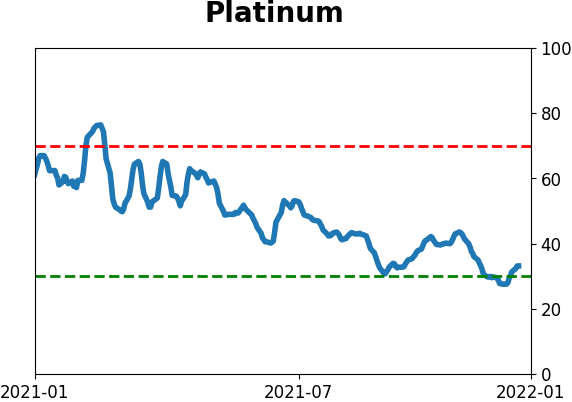
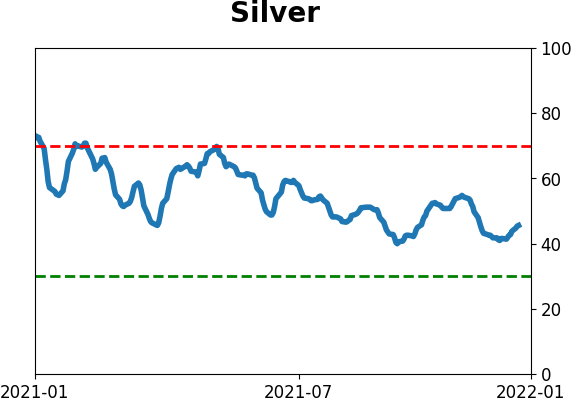
Gold

|
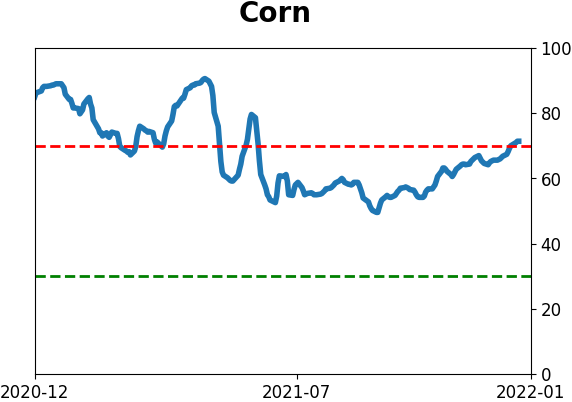
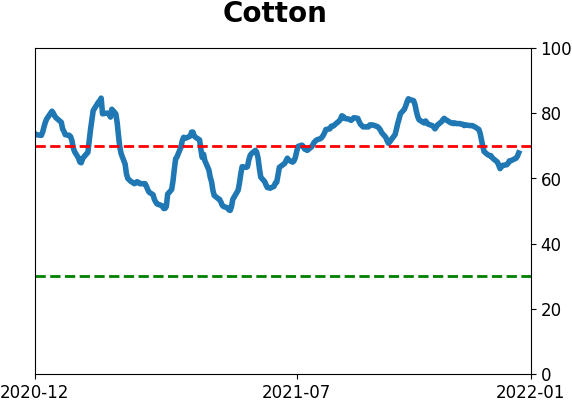
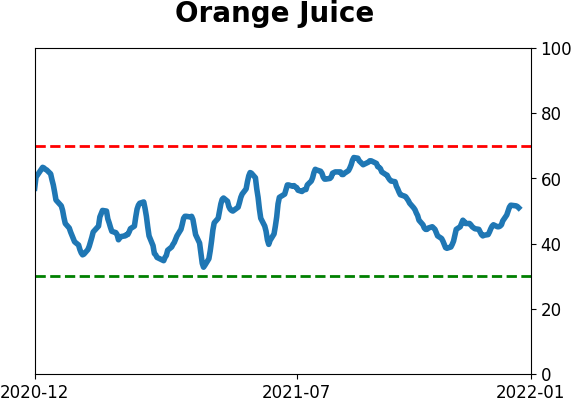
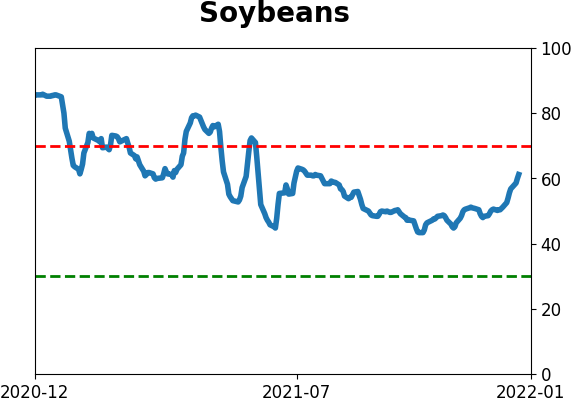
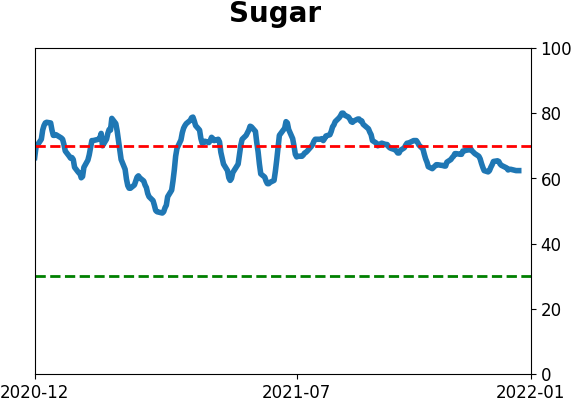
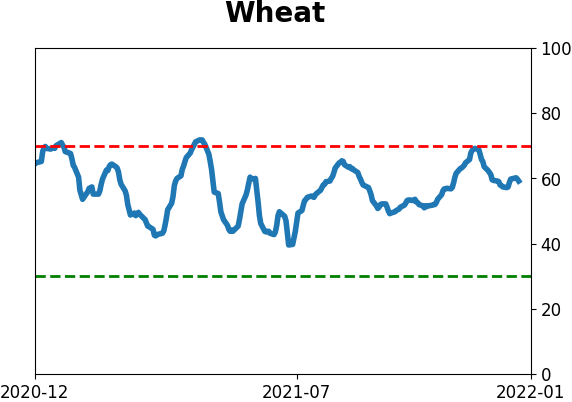
Agriculture

|
|
Research
By Jason Goepfert
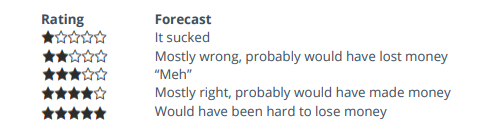
BOTTOM LINE
This year, our studies proved to be successful in aggregate, but there were the most 1-star pieces of research (that proved to be totally wrong) in the past 5 years. There were also a lot of 5-star, effective, studies, showing that this was a binary year when things either worked really well, or not at all.
FORECAST / TIMEFRAME
None
|
Key points:
- After grading our most compelling studies in 2021, it's obvious this was a binary year
- We had the most 1-star (completely wrong) studies out of any year in the past 5
- But there were even more 5-star studies as things either totally worked, or totally didn't
A year when studies were either really good, or really bad
As we've done near the end of prior years, it's time to take a look at our Archived Studies for 2021.
For every study we do at SentimenTrader that has a solid conclusion, we track it in the Active Studies. Research that includes a compelling study will have a forecast attached to it showing whether the forecast is for higher prices or lower prices, an ETF that tracks the appropriate market, and whether the time frame is short-term (< 1 month), medium-term (1-6 months) or long-term (> 6 months). Members can filter and sort both Active and Archived studies to get a feel for what our research has been suggesting.
To remain accountable and transparent, after the studies' effective time frames have passed, we go back and rate them based on whether they were a good guide or not, and they then show up in the Archived Studies. There are 860 studies that have been rated.
Near the end of each year, we objectively review studies that were closed during the year. The ratings are based on how the indicated market performed over the time frame that was most consistent in the study. They range from 1 to 5 stars.
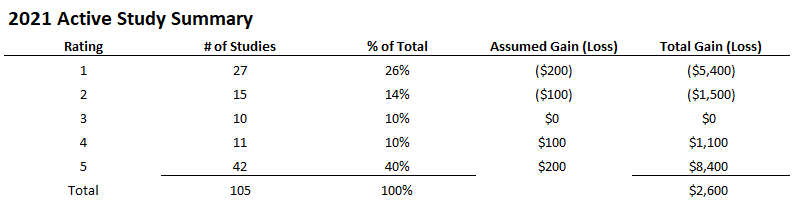
Below, we can see a breakdown of study results for 2021. Using a conservative rating approach, the studies continue to show a positive expectation. The results from this year were effective, though it was the worst year out of the past 5. The biggest problem was from early in the year when nothing seemed to matter, and stocks drove higher day after day. The S&P 500 rolled right past signs of historic speculation and split market conditions.
Out of 105 studies that were graded, totally incorrect ones accounted for 26% of the total, the worst out of any year. But 40% of the studies got 5 stars - not the best year, but pretty good. This was a binary year, when things either really worked, or really didn't. Not much middle ground.
Worst misses:
Best hits:
2021 versus past years
Assuming that we would have lost as much on the bad studies as we gained on the good ones - basically, that our stop losses were equal to our profit targets - then we would have made $2,600, or about a 26% return on the $10,000 total "invested" assuming we put $100 on the market for each of the 105 studies.
This is not a trading system and would be hard or impossible to implement if it was. It's just a shorthand way of trying to determine if the studies have been helpful over the years.
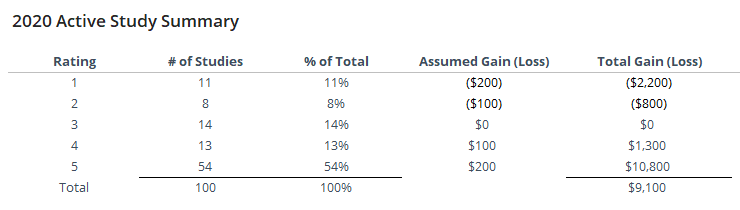
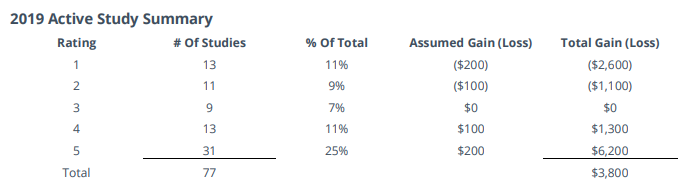
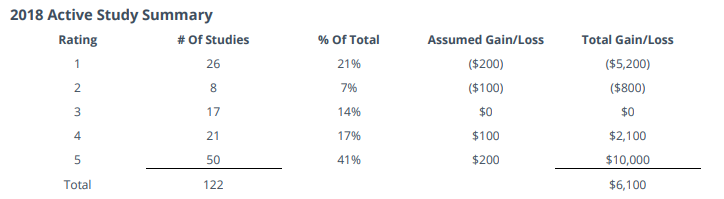
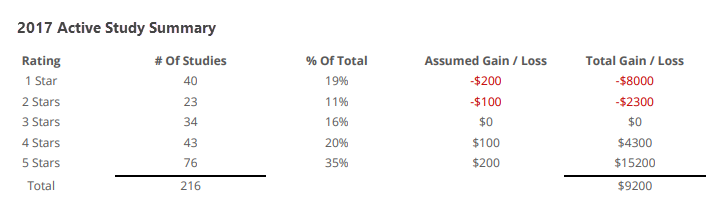
Below is a summary of study results for the past 4 years.
What the research tells us...
As long as the expectation of our studies continues to be consistently positive, then we feel there is value in analyzing markets this way. We think it's unique to our service since most others don't objectively track and grade their analysis, hoping nobody notices. It's not always easy, because sometimes it doesn't work, and nobody likes to admit failure. But acknowledging the difficulties and looking at things the way they are instead of how we want them to be is a good way to improve, and that's something we're always looking to do.
As we head into the new year, most of our studies are titled to the positive side, thanks to recent momentum and (mostly) positive breadth and seasonality, as well as a curious amount of pessimism in a mostly healthy market environment. This could change relatively quickly, especially after the first couple weeks of the new year.
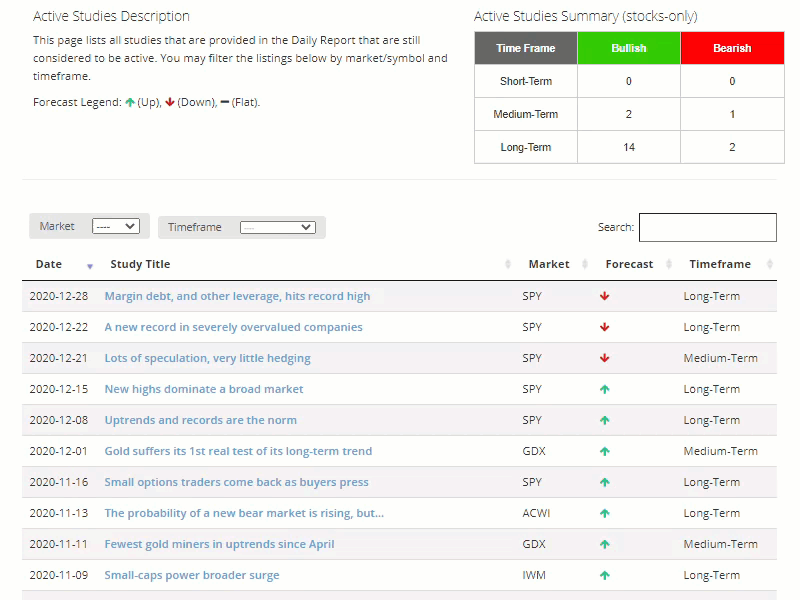
Active Studies
| Time Frame | Bullish | Bearish | | Short-Term | 1 | 0 | | Medium-Term | 9 | 2 | | Long-Term | 9 | 4 |
|
Indicators at Extremes
Portfolio
| Position | Description | Weight % | Added / Reduced | Date | | Stocks | RSP | 10.7 | Added 6.4% | 2021-10-01 | | Bonds | 32.7% BND, 7.1% SCHP | 39.8 | Added 8.3% | 2021-10-26 | | Commodities | GCC | 2.4 | Reduced 2.1%
| 2020-09-04 | | Precious Metals | GDX | 4.6 | Reduced 4.2% | 2021-05-19 | | Special Situations | 9.8% KWEB, 4.7% XLE, 2.9% PSCE | 17.3 | Added 9.78% | 2021-10-01 | | Cash | | 24.1 | | |
|
Updates (Changes made today are underlined)
No surprise for 2021, but we're seeing conflicting messages in some of what has developed lately. There was a jump in pessimism heading into December, which has been relieved to some degree. The subsequent breadth thrust has extremely positive implications for forward returns, especially longer-term. The negatives are mostly sector-related, especially the negative divergences among Nasdaq 100 stocks. Consumer Staples have seen an impressive surge, and Biotech may be oversold, but otherwise there are a whole lot of crosscurrents and seemingly not much edge. Bond sentiment is trying to recover from a recent bout of pessimism, and gold stocks are doing their thing which is not much at all. They've been flat for six months. Chinese tech stocks were doing exactly what they're supposed to do, then did *not* by plunging to new lows. This is troubling on a shorter-term time frame, but this was never meant for a trade, rather a multi-year investment. Recent behavior is troubling and I will not be adding any exposure as long as that's the case. RETURN YTD: 7.5% 2020: 8.1%, 2019: 12.6%, 2018: 0.6%, 2017: 3.8%, 2016: 17.1%, 2015: 9.2%, 2014: 14.5%, 2013: 2.2%, 2012: 10.8%, 2011: 16.5%, 2010: 15.3%, 2009: 23.9%, 2008: 16.2%, 2007: 7.8%
|
|
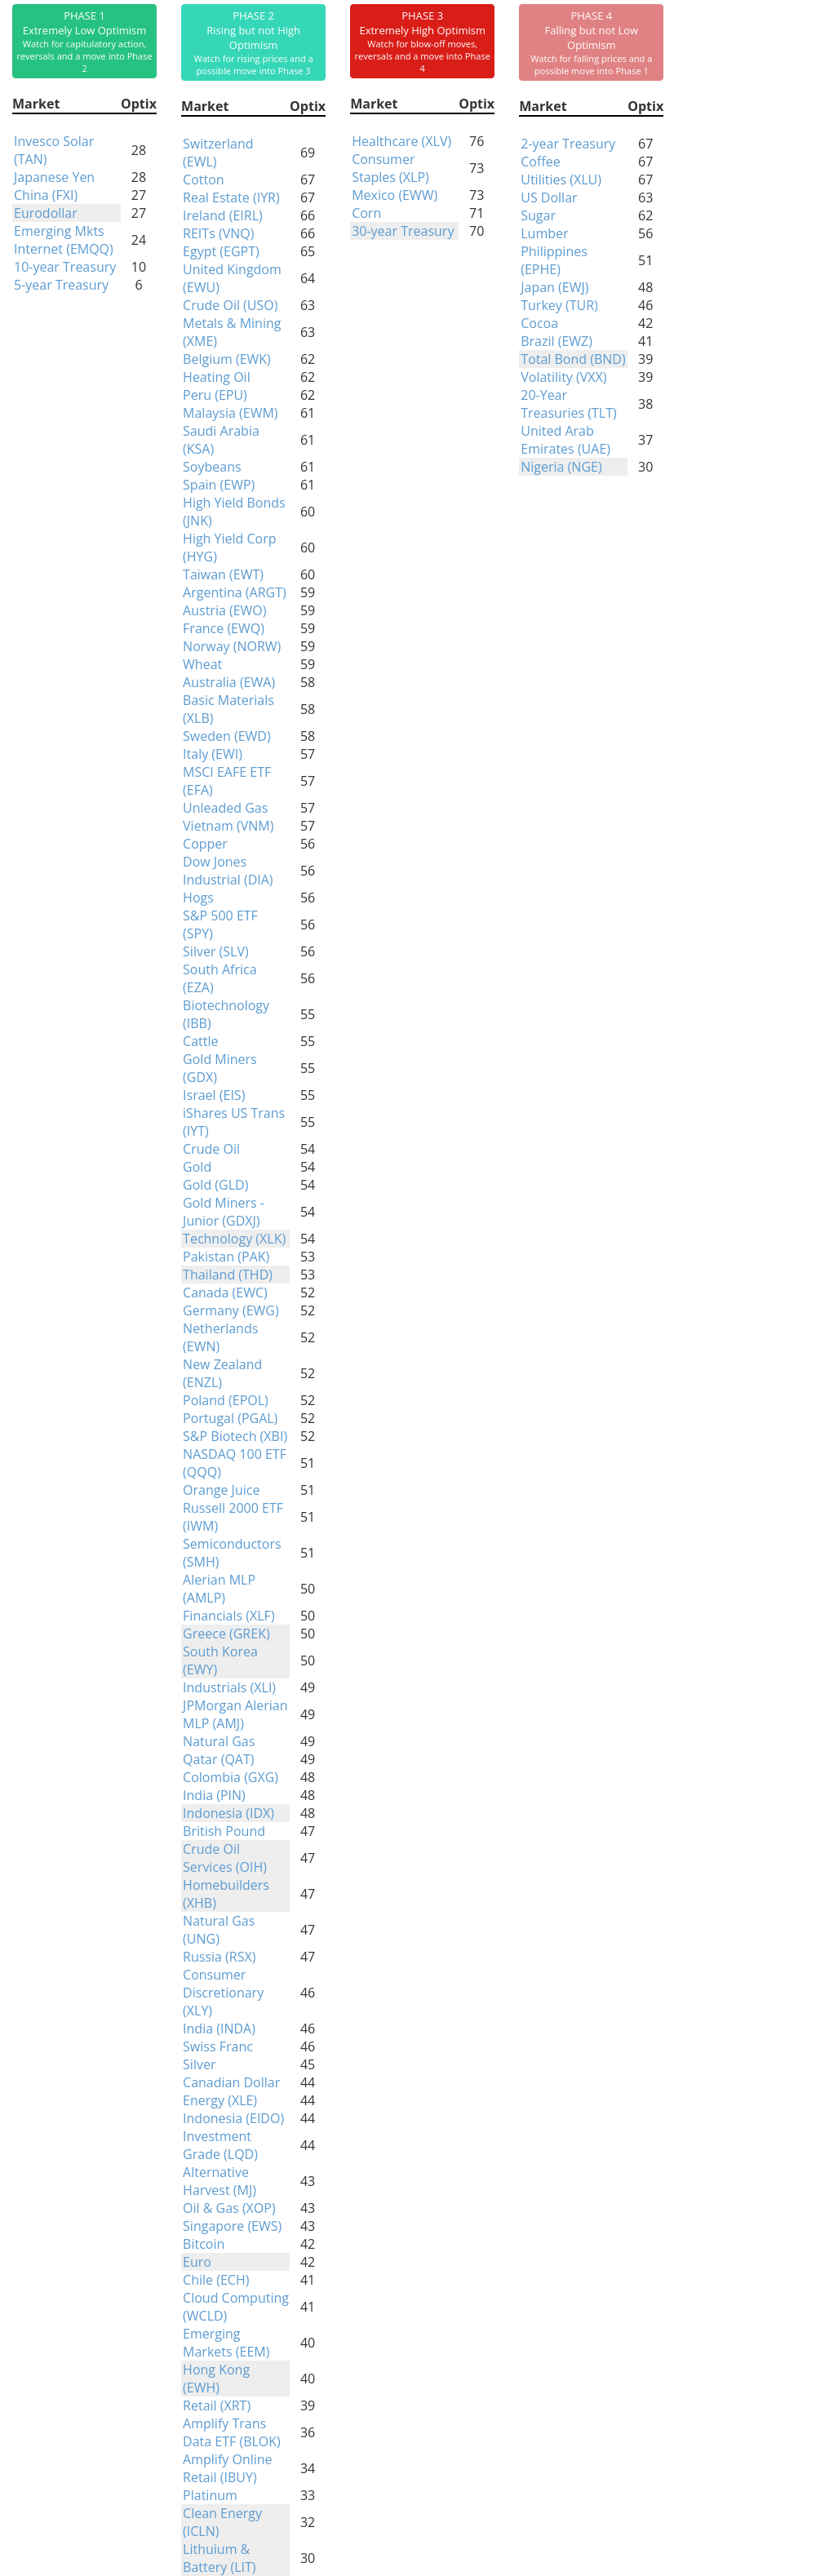
Phase Table
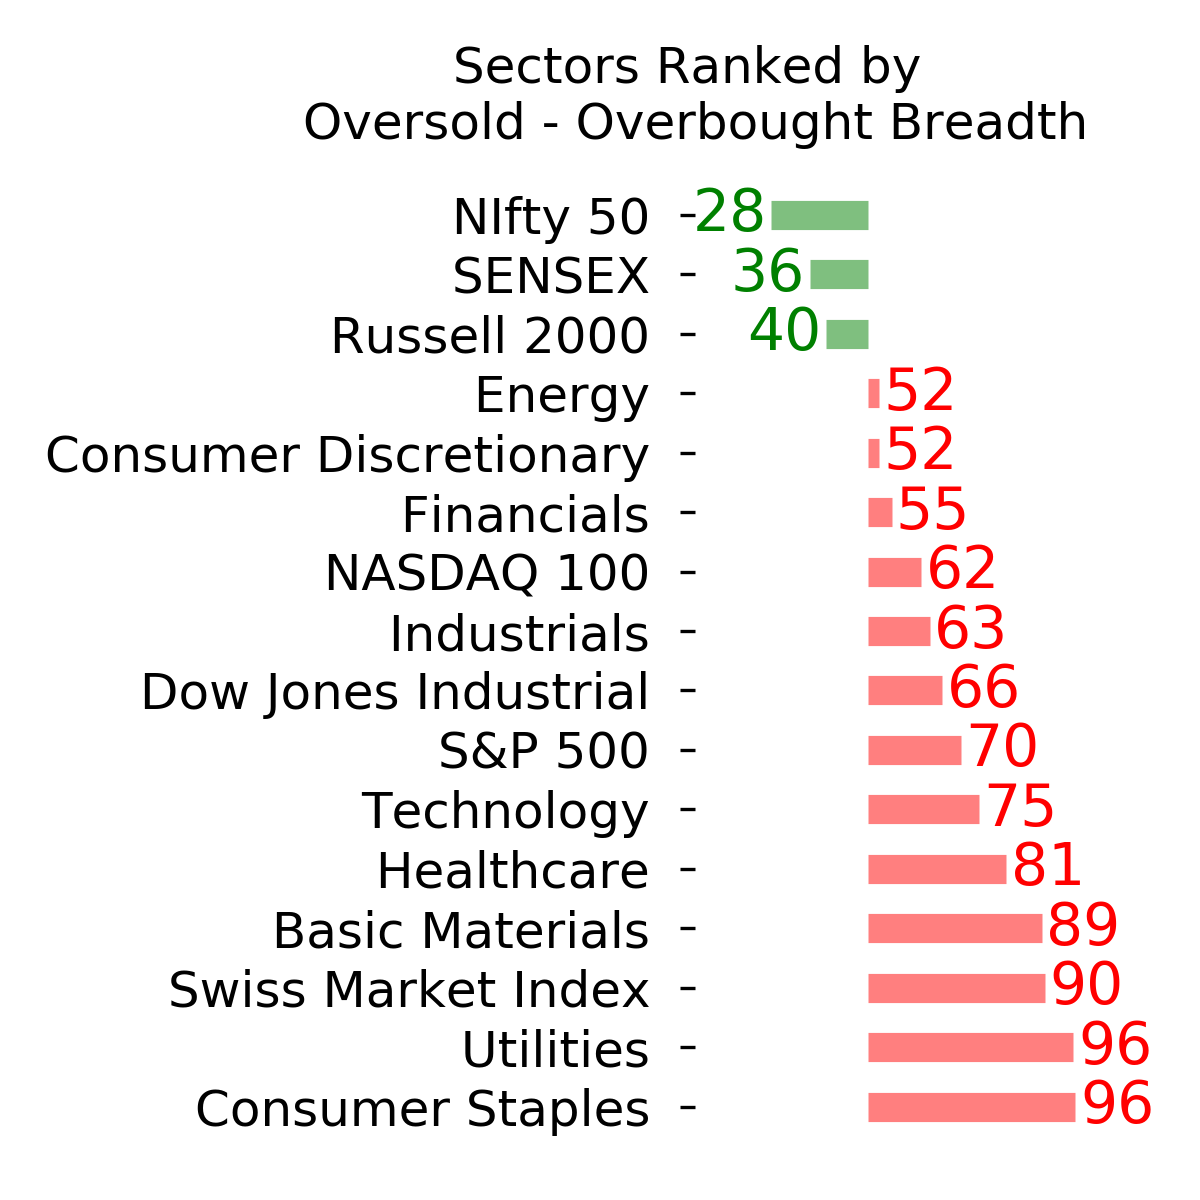
Ranks
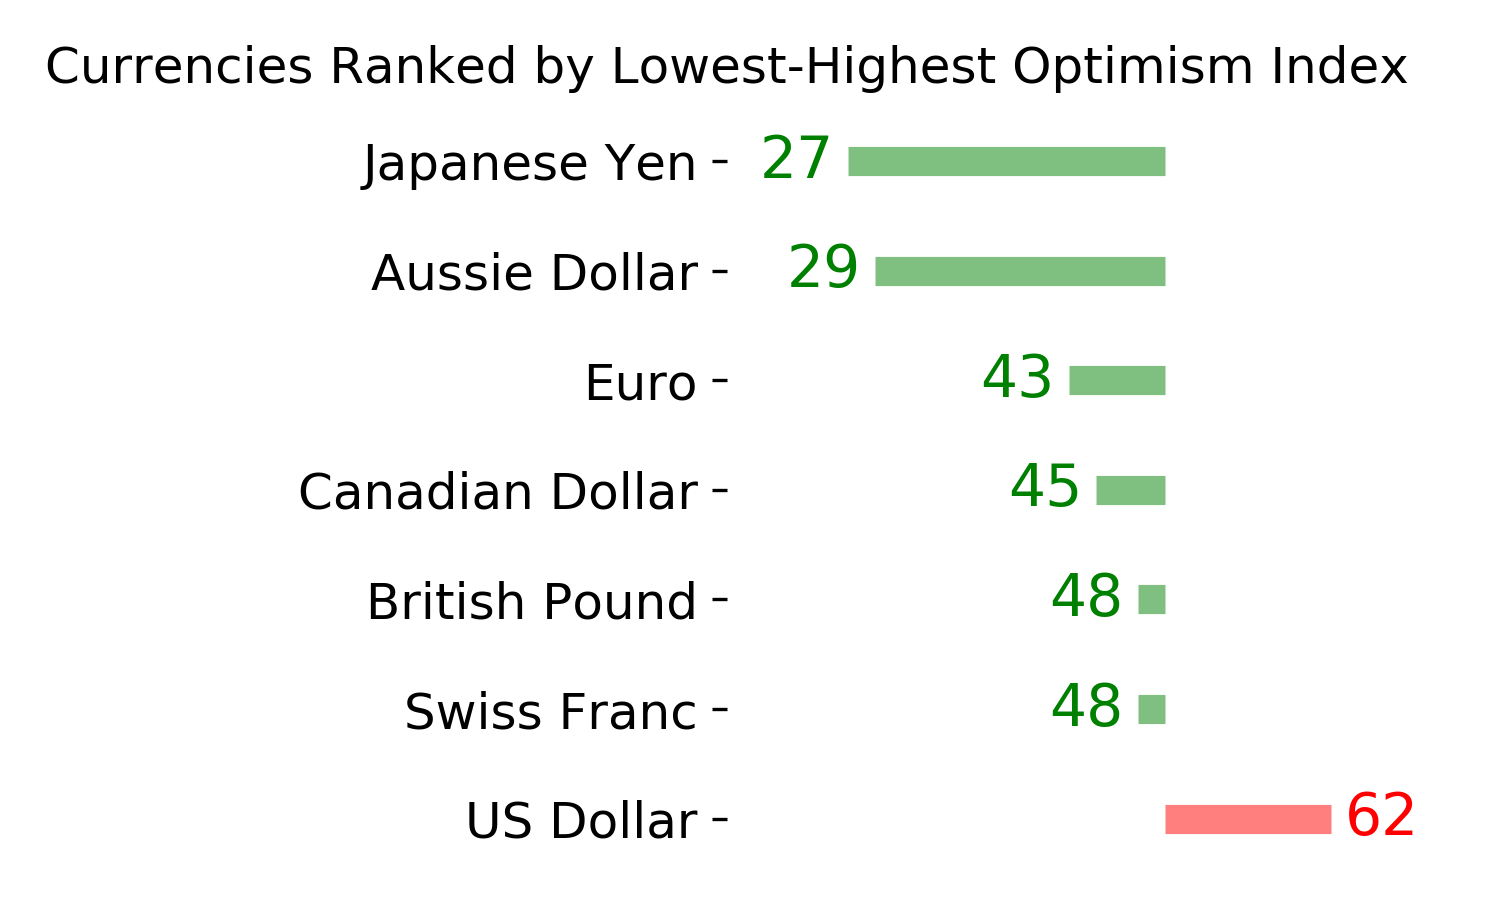
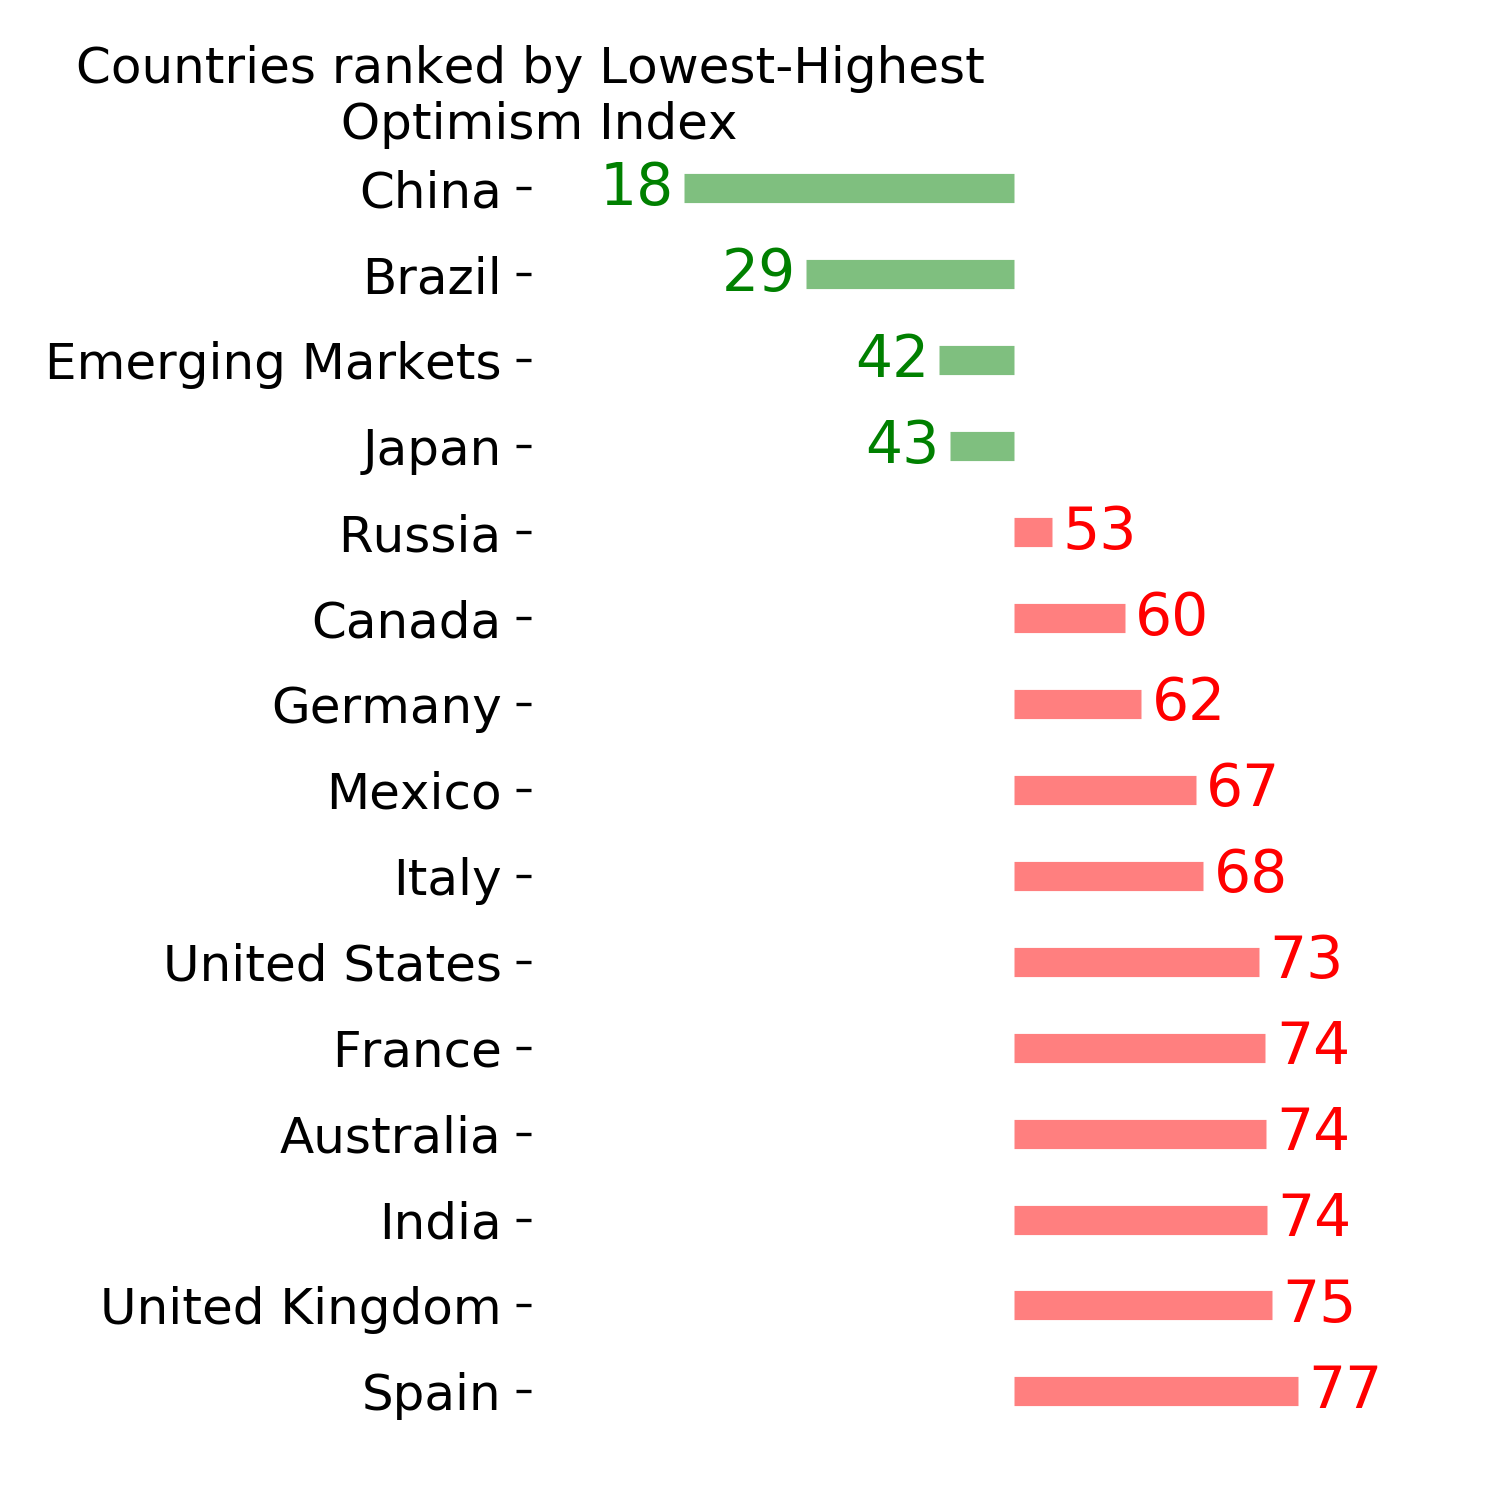
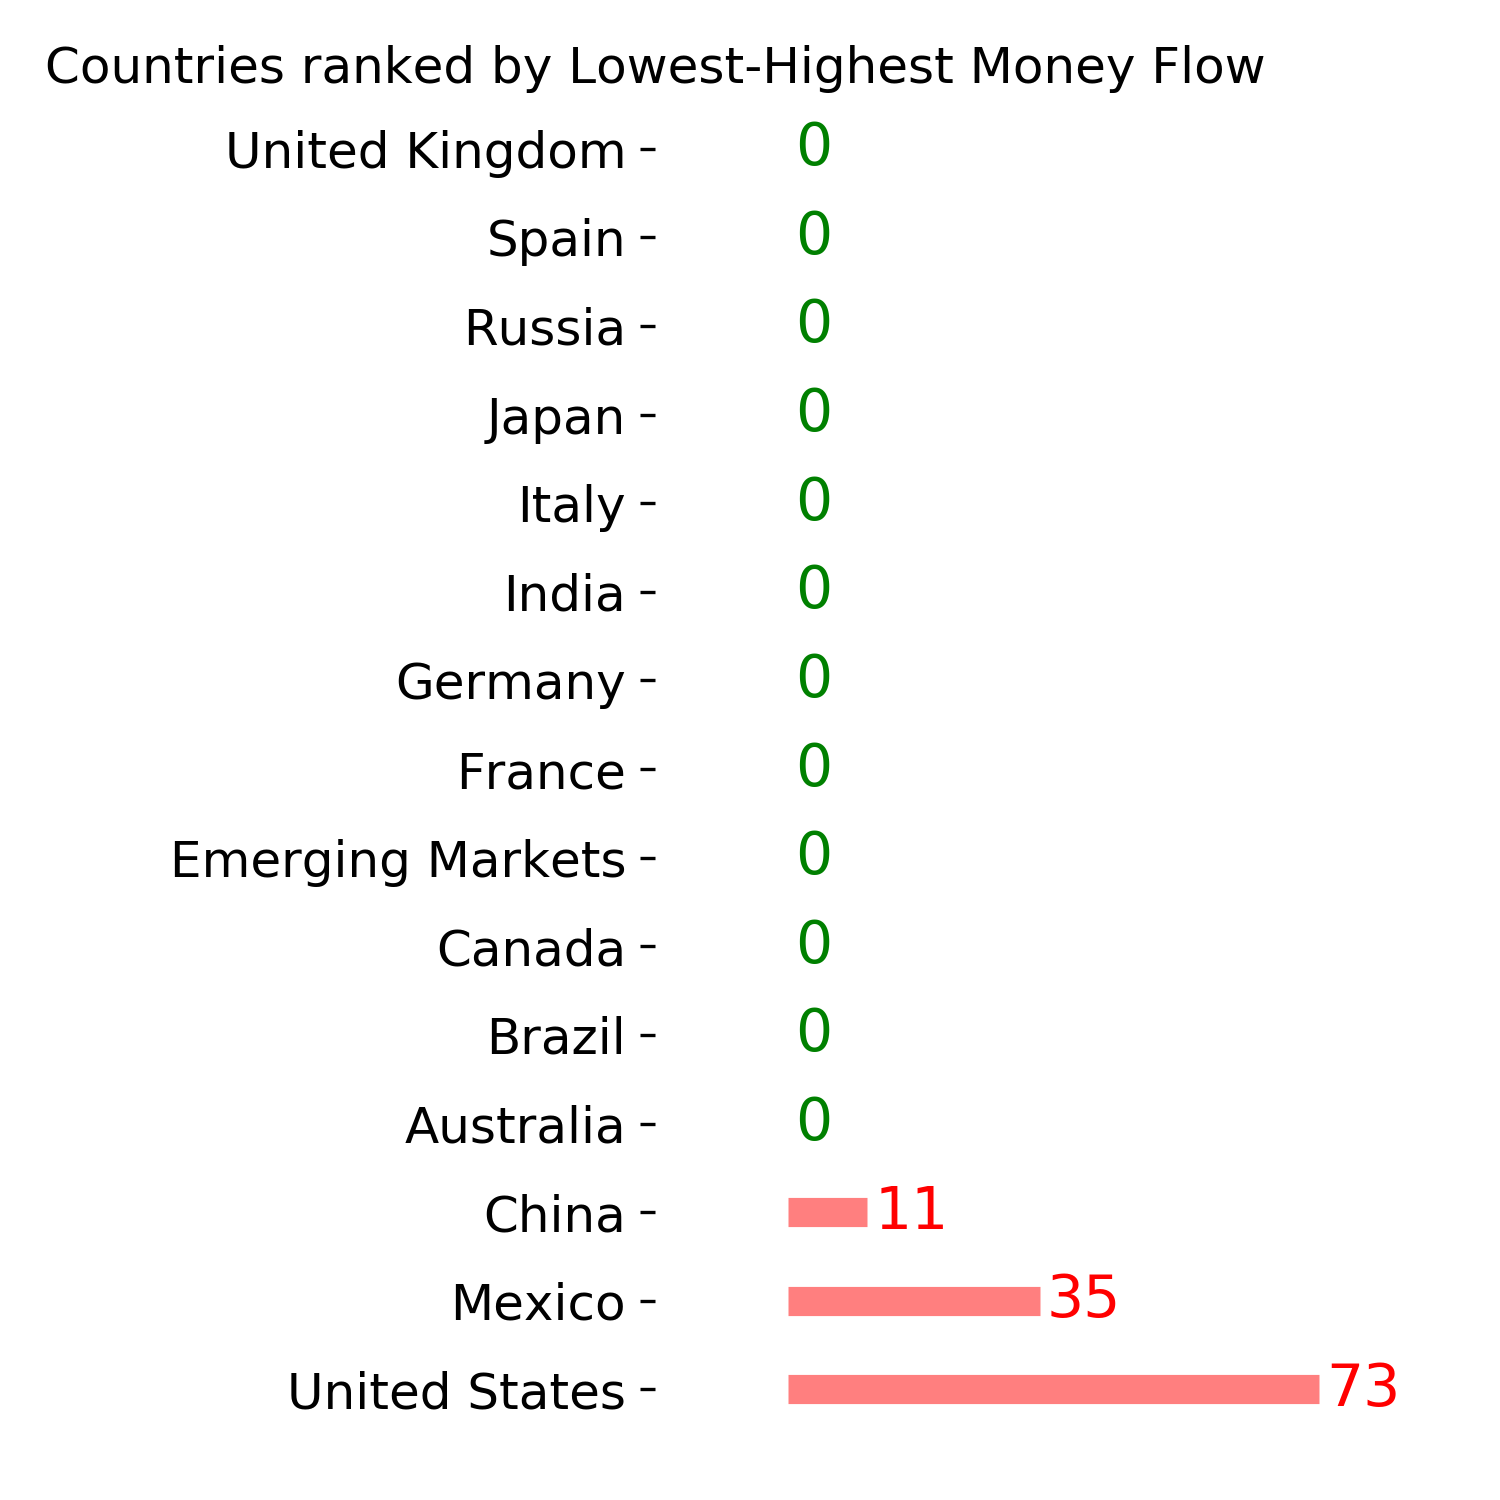
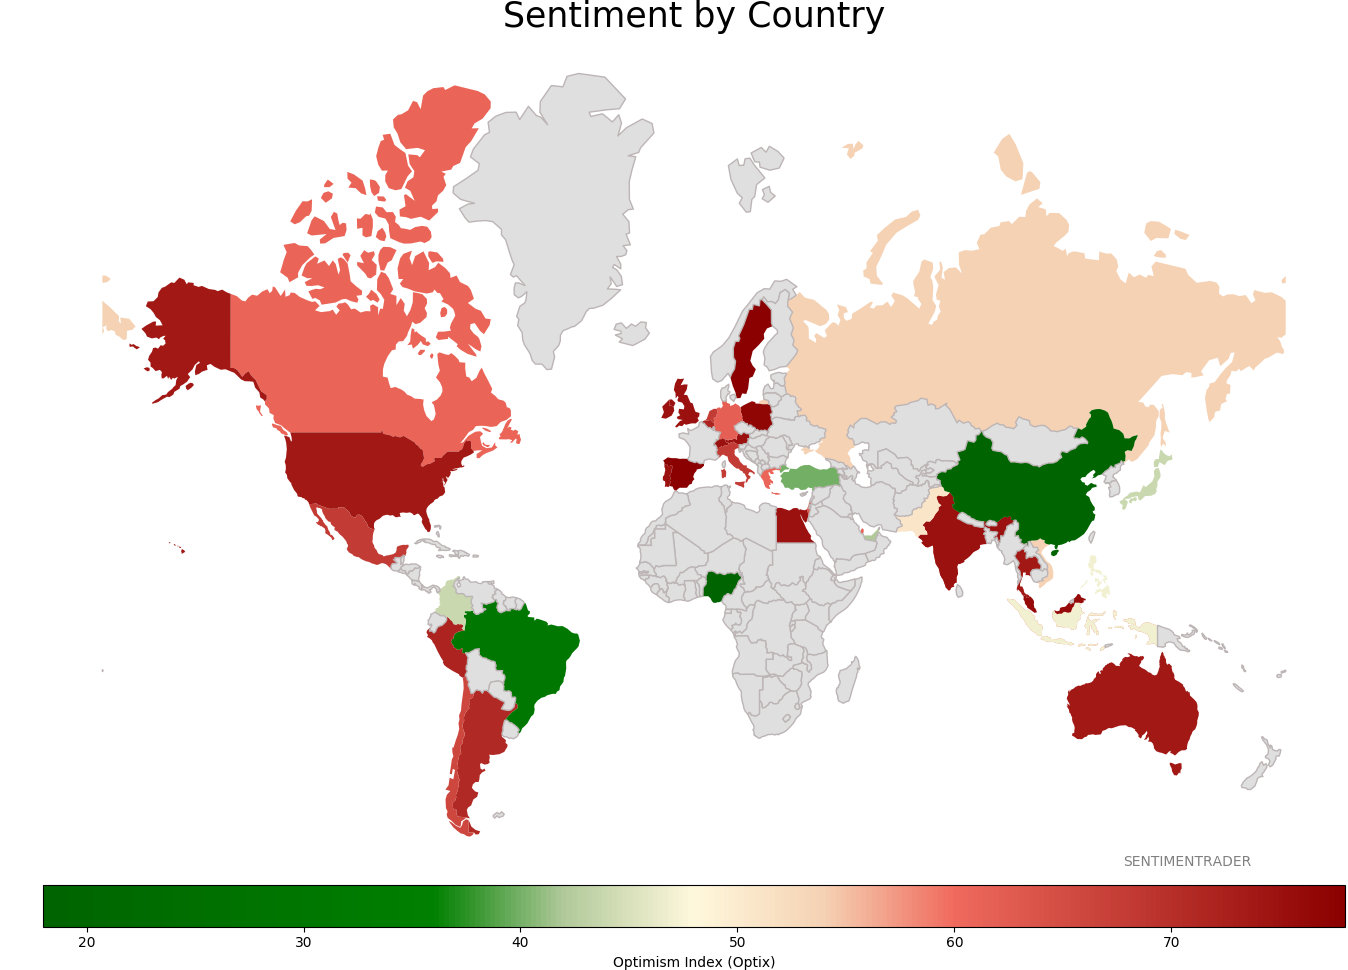
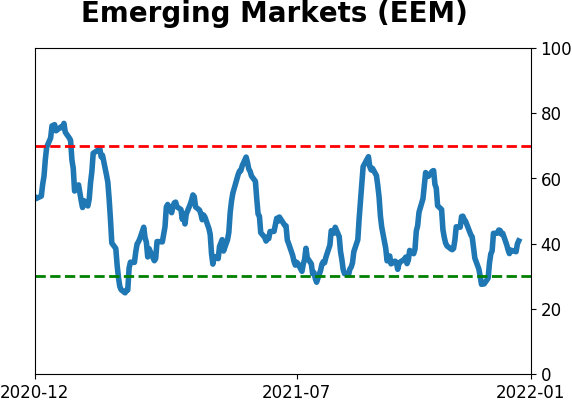
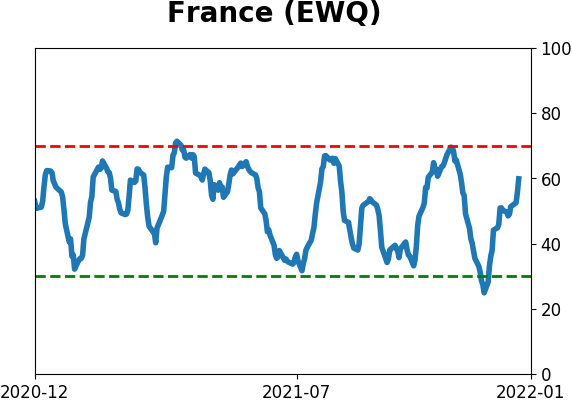
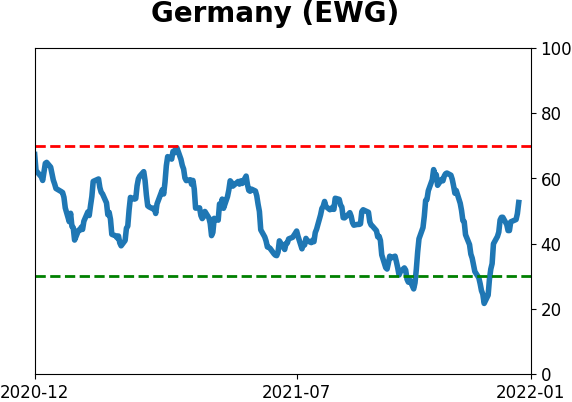
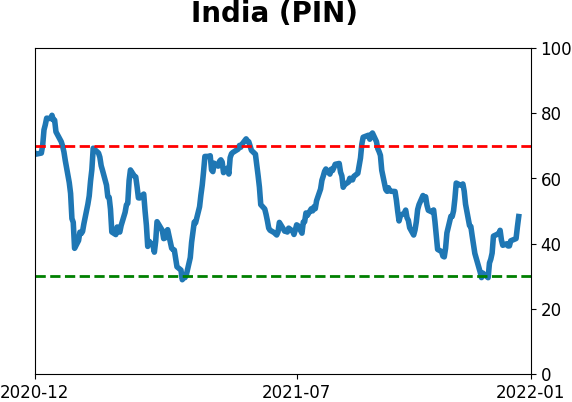
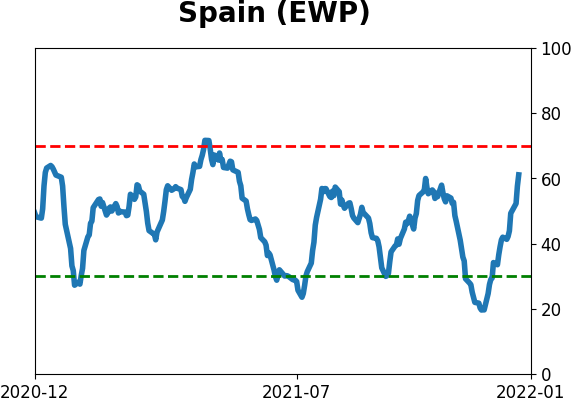
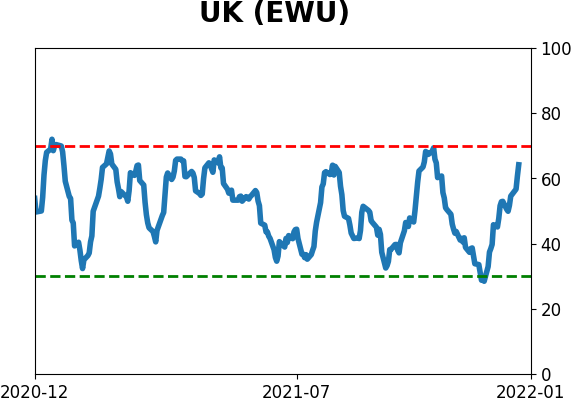
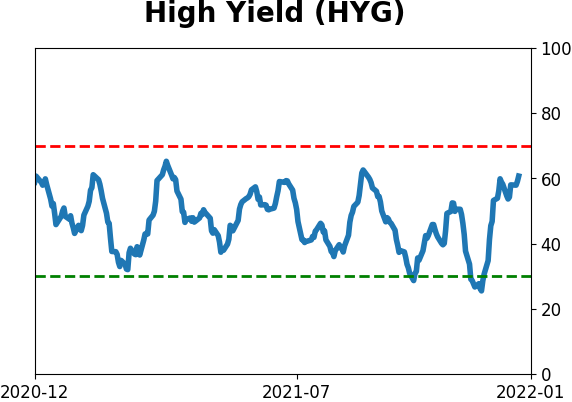
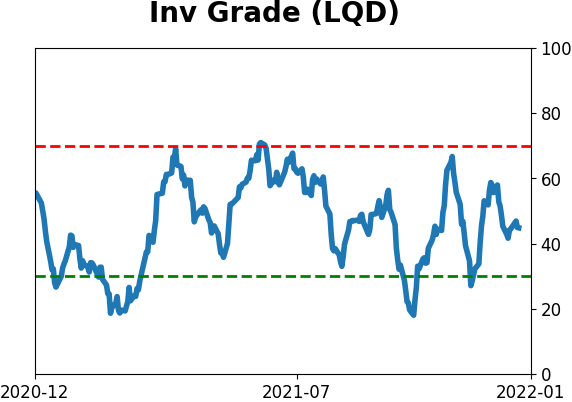
Sentiment Around The World
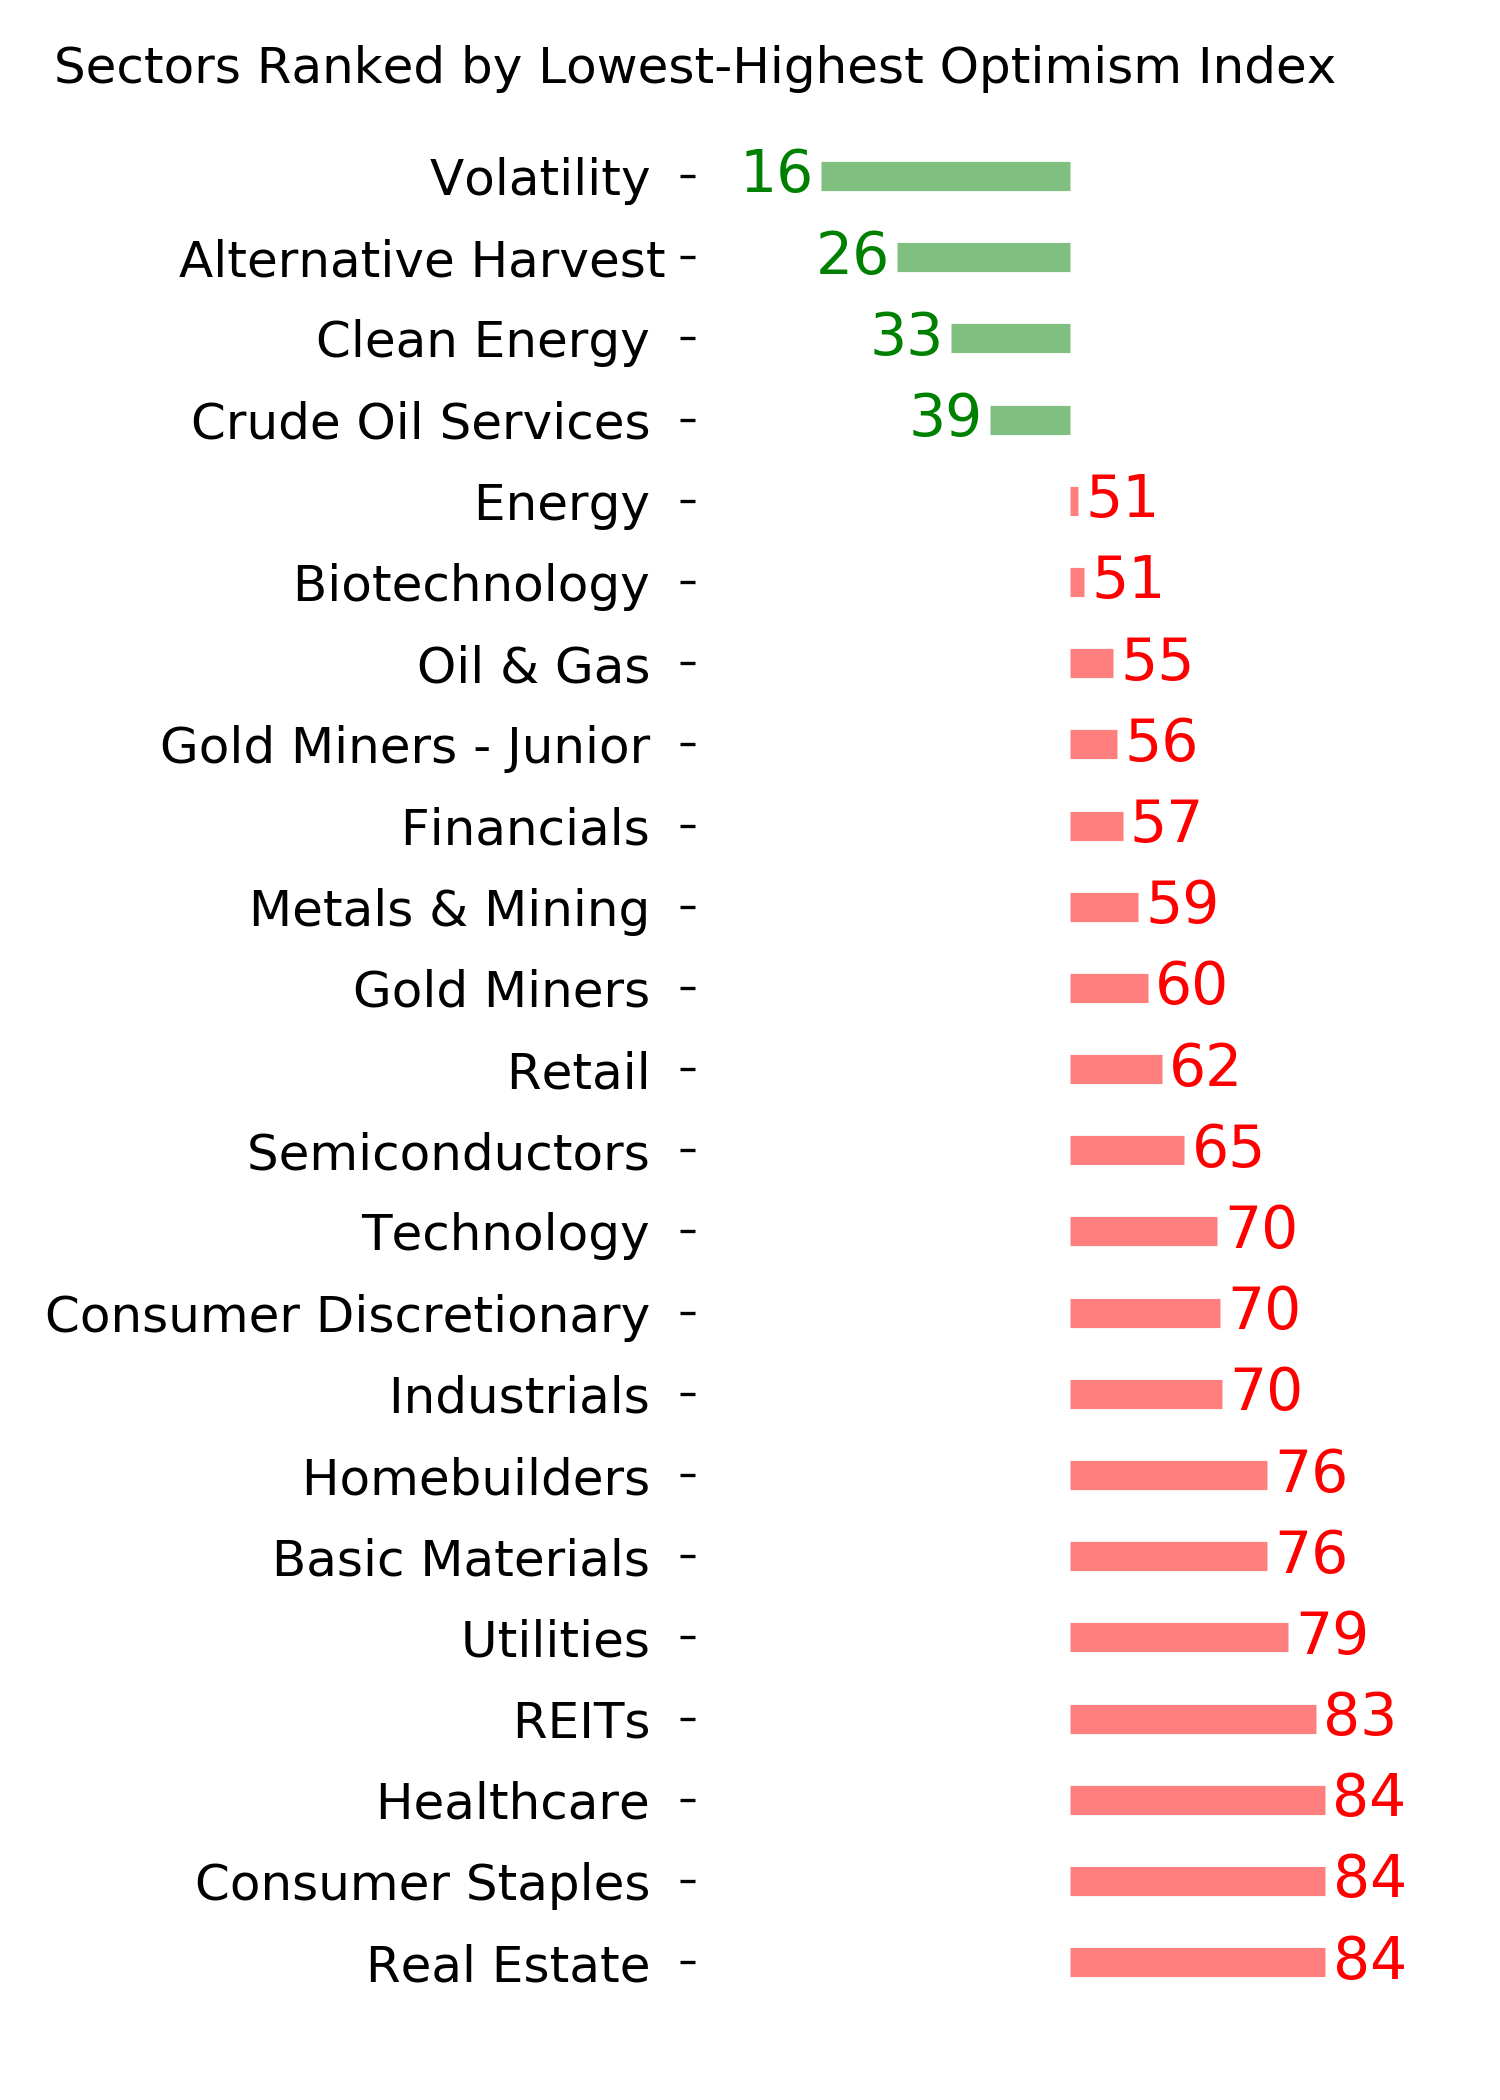
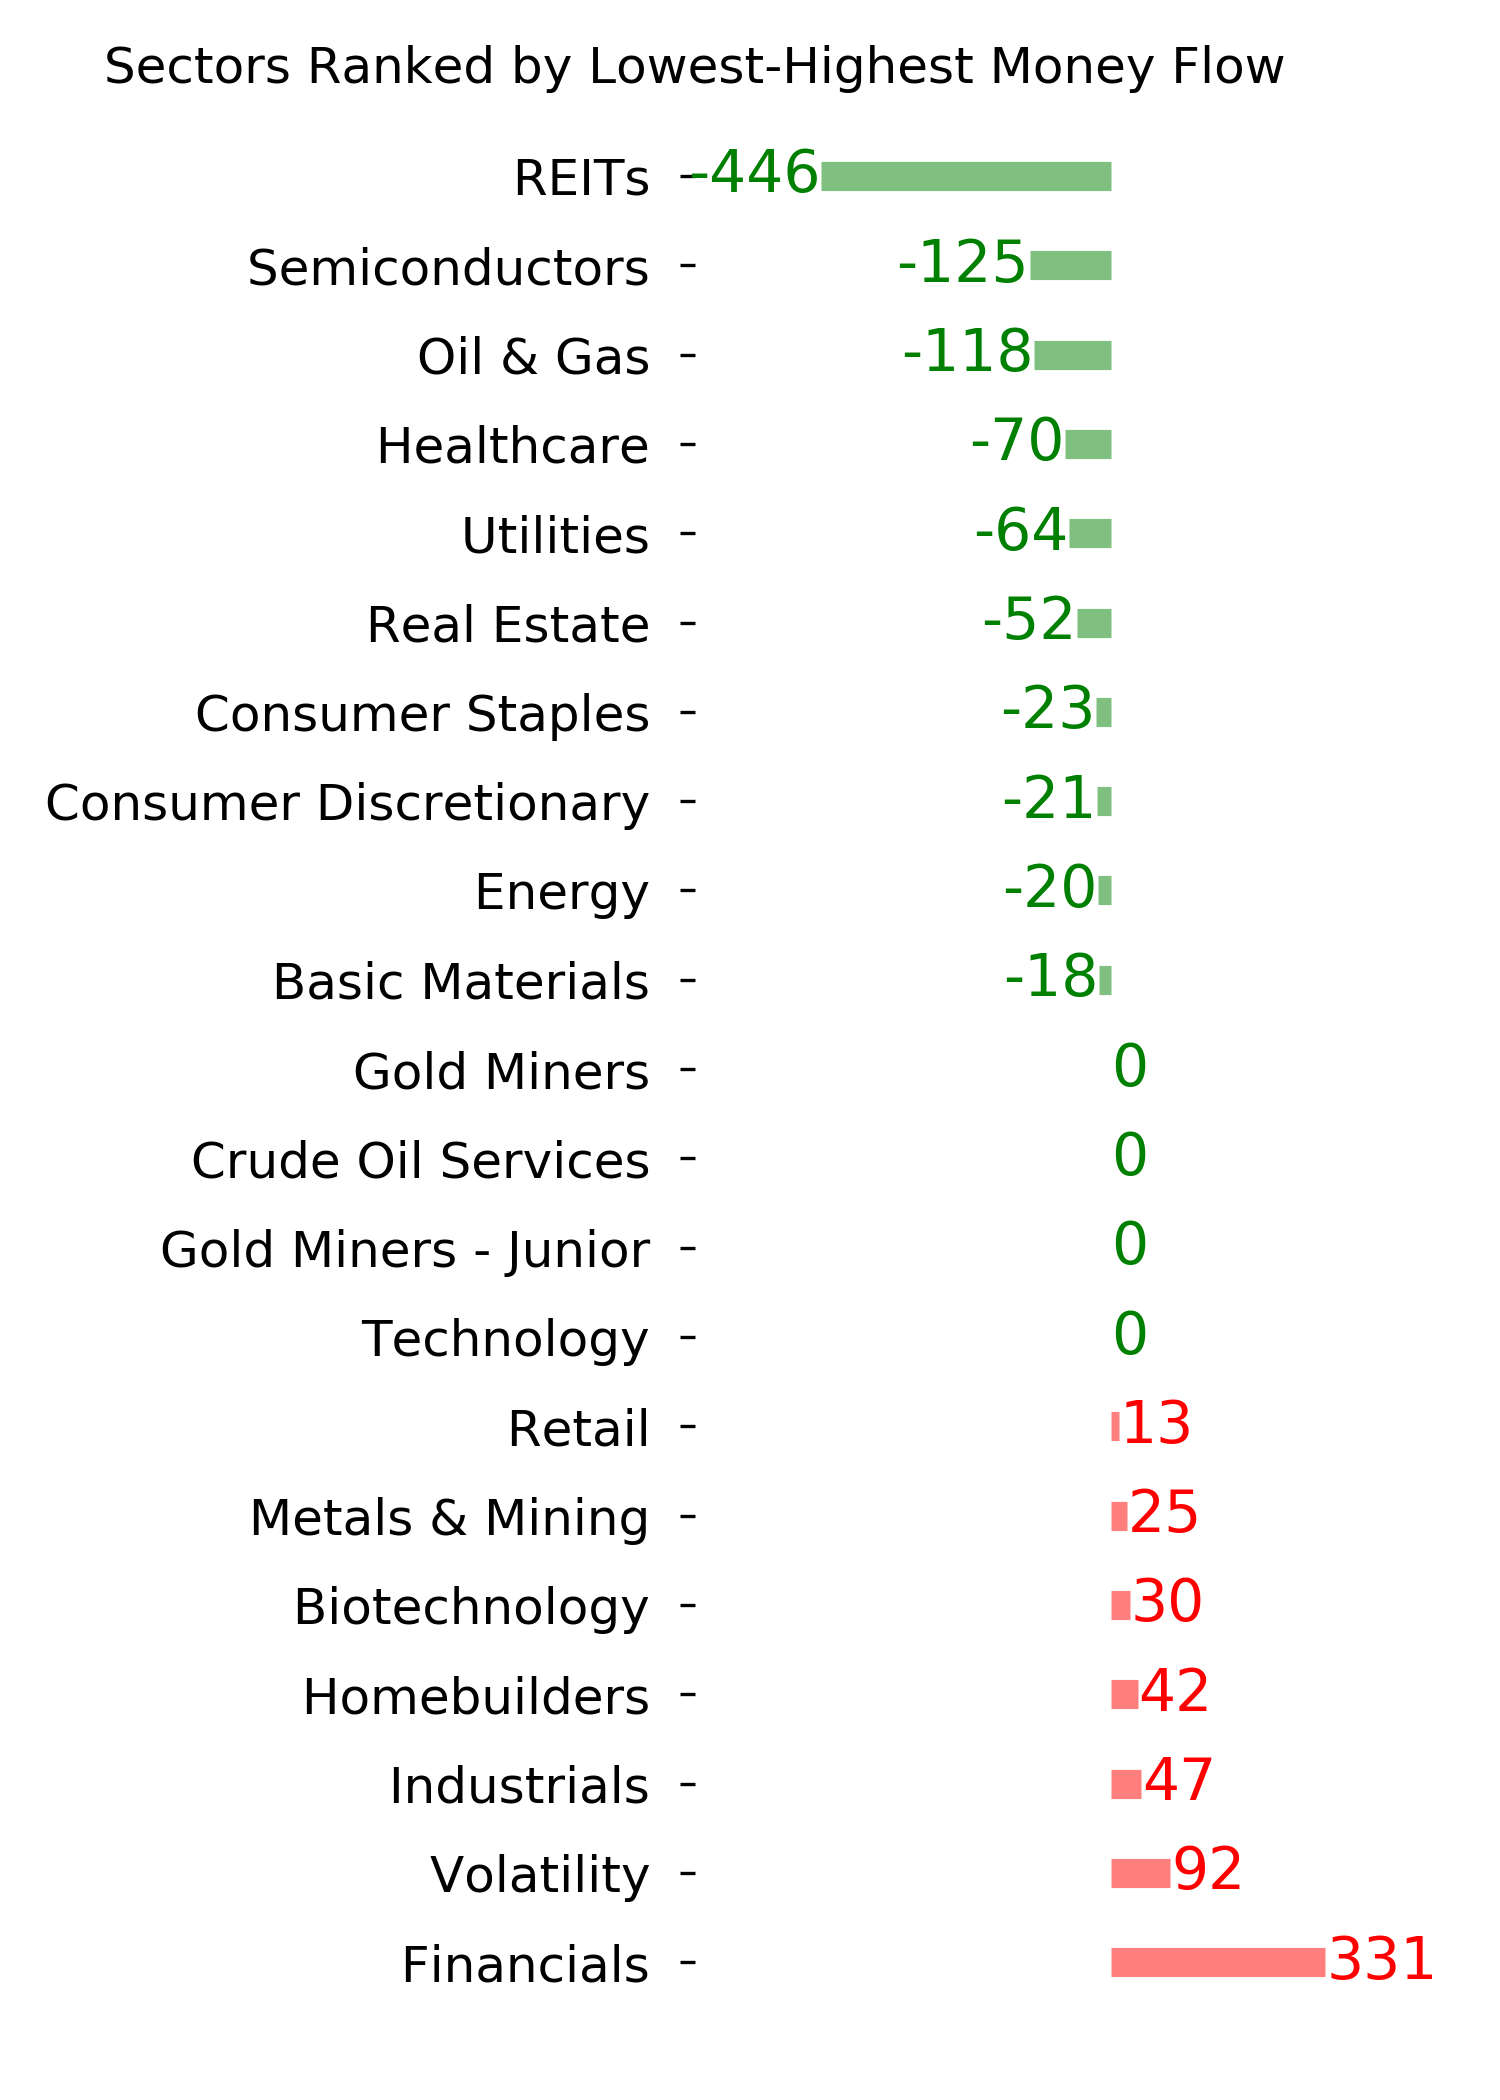
Optimism Index Thumbnails
|
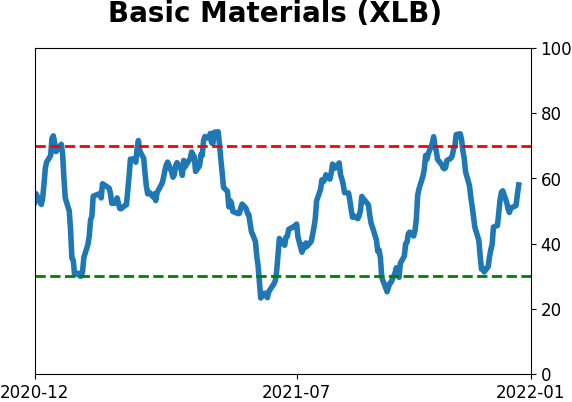
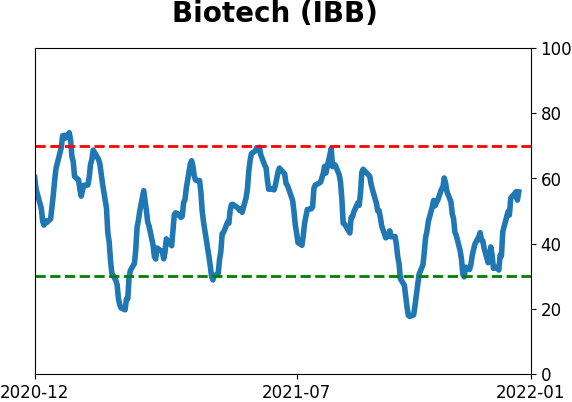
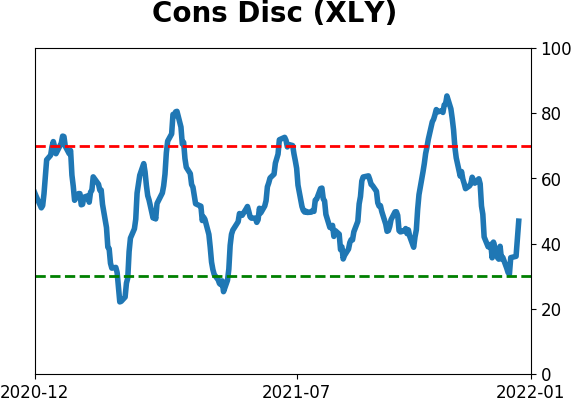
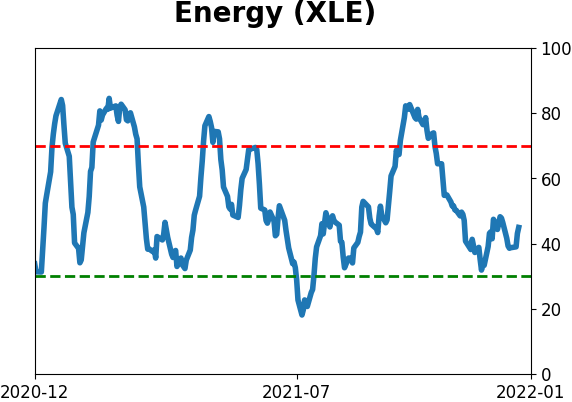
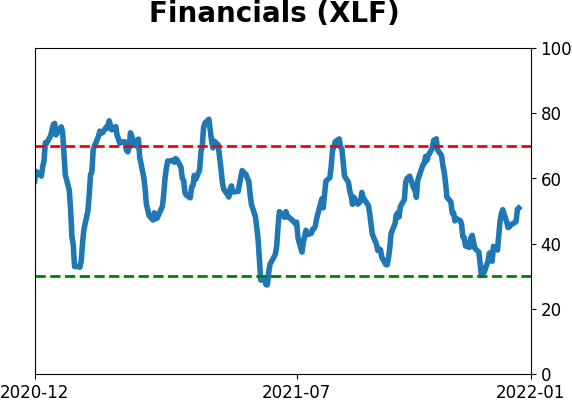
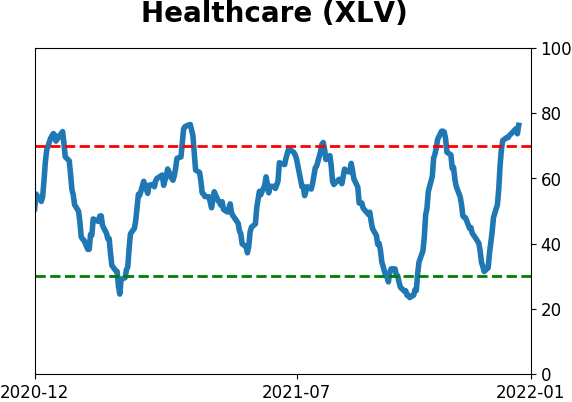
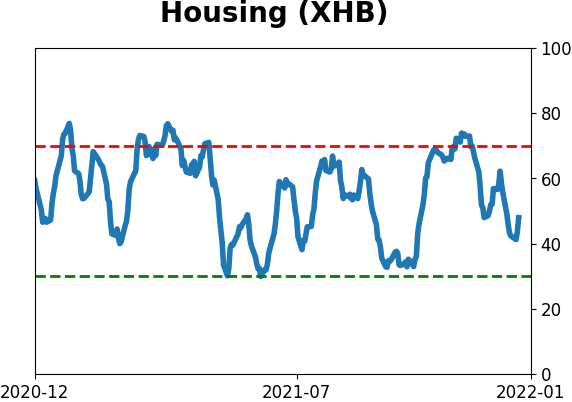
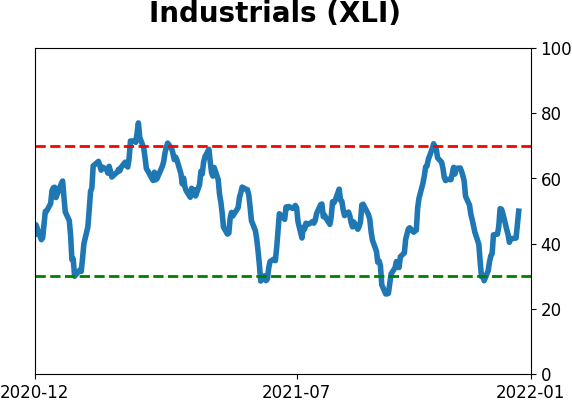
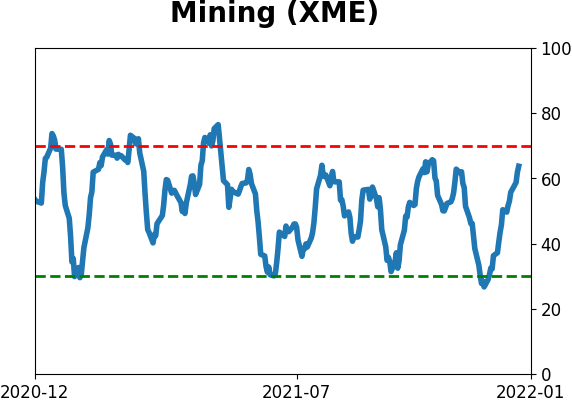
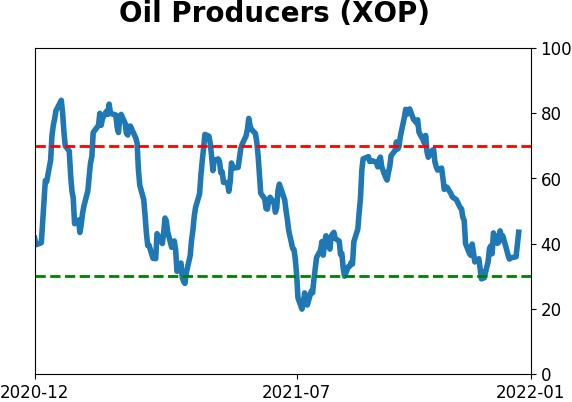
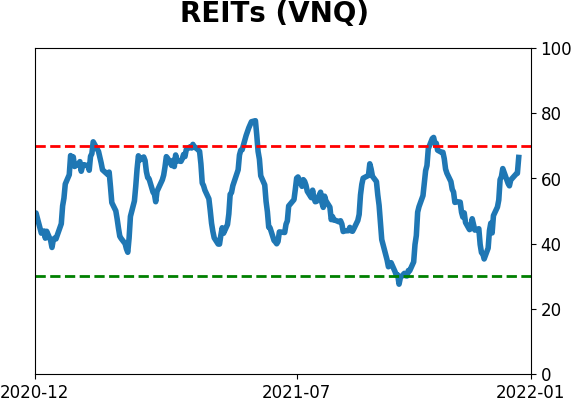
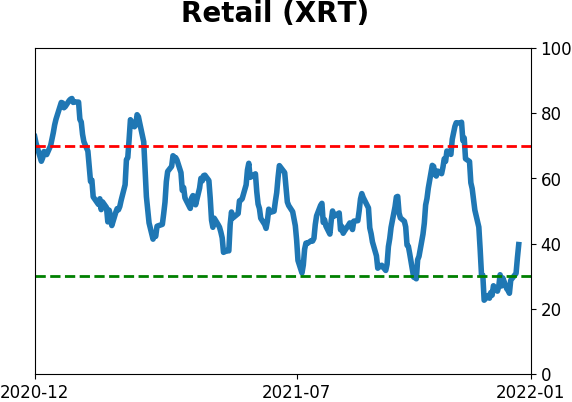
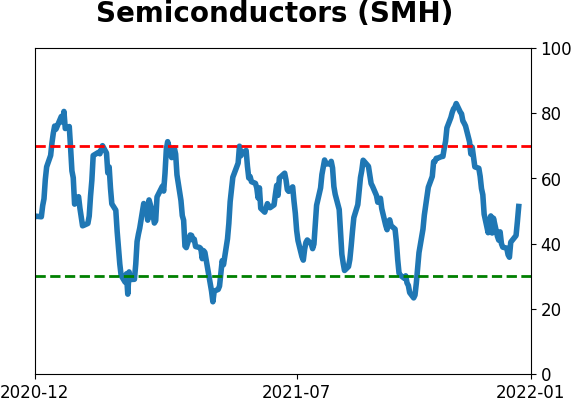
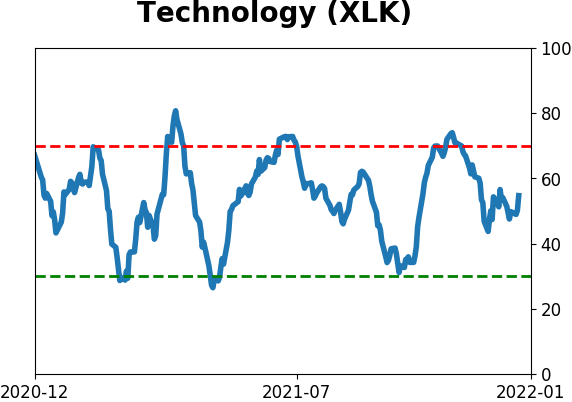
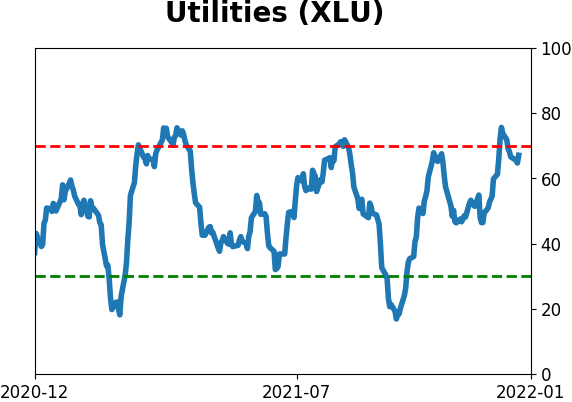
Sector ETF's - 10-Day Moving Average
|
|
|
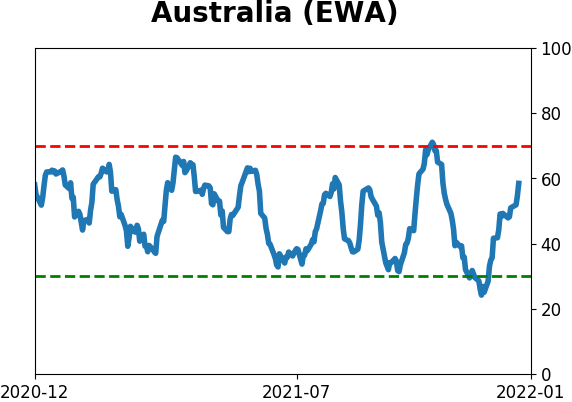
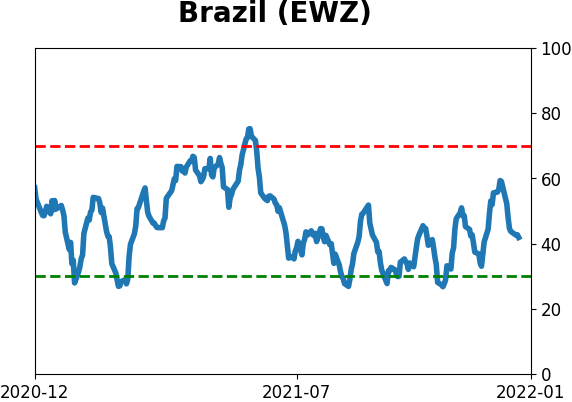
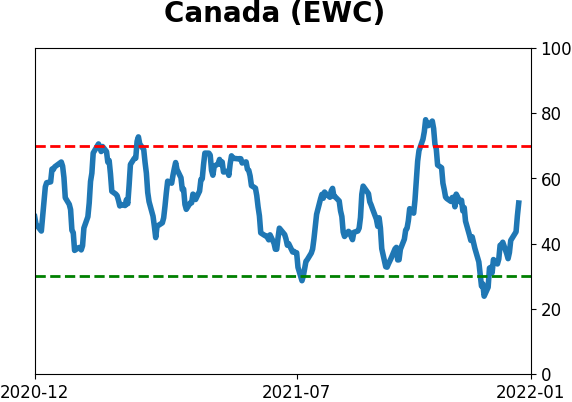
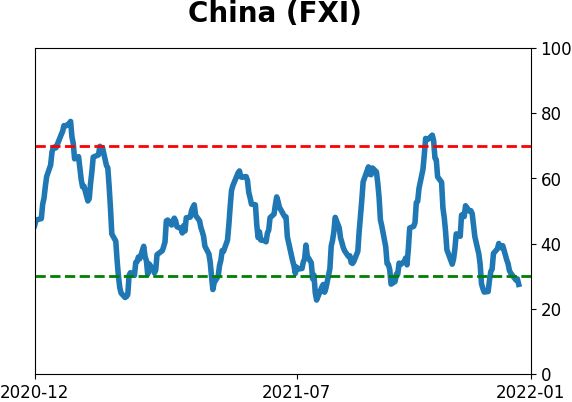
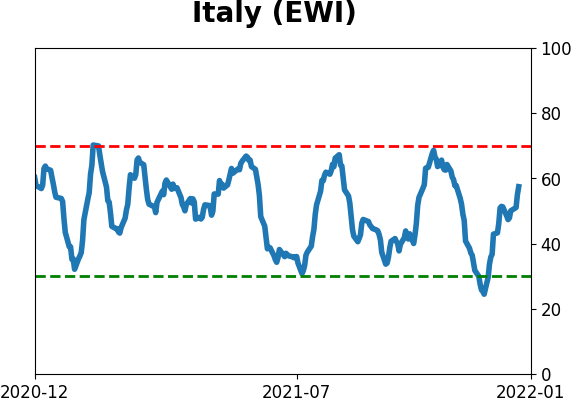
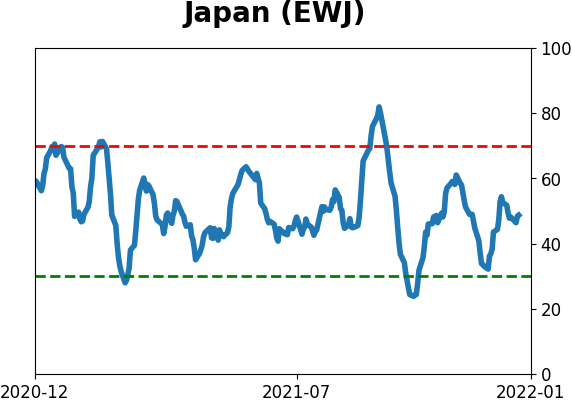
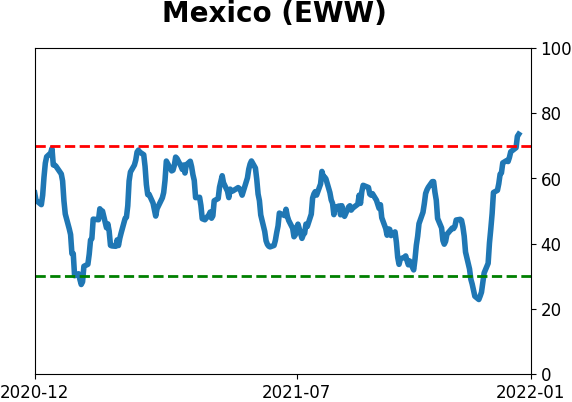
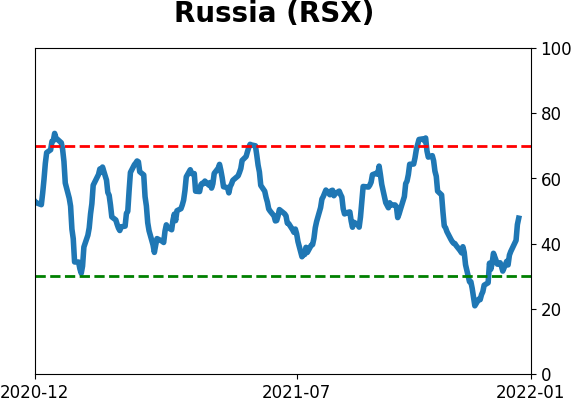
Country ETF's - 10-Day Moving Average
|
|
|
Bond ETF's - 10-Day Moving Average
|
|
|
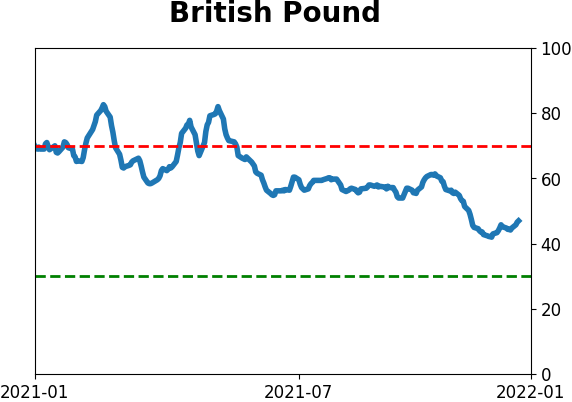
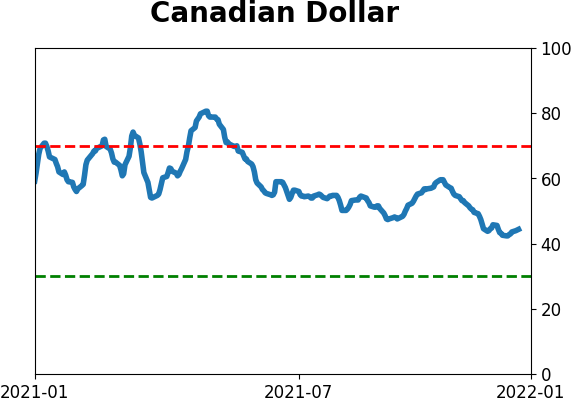
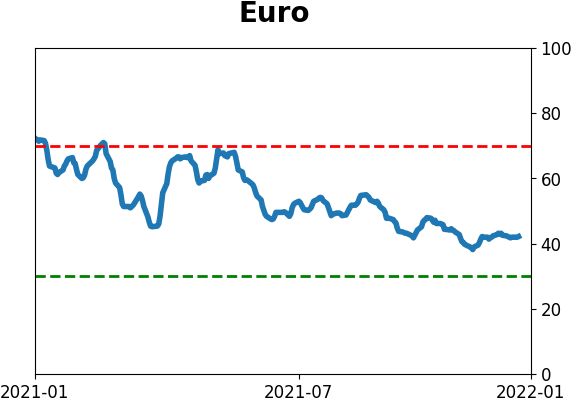
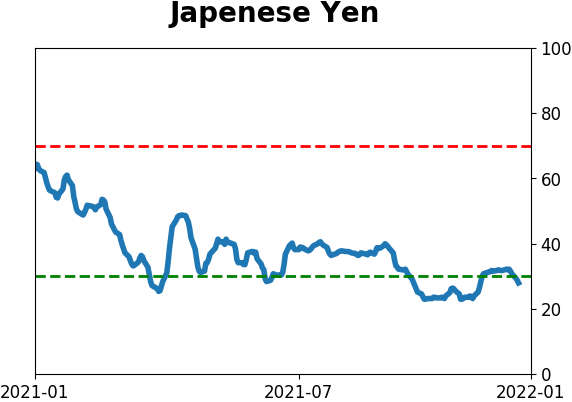
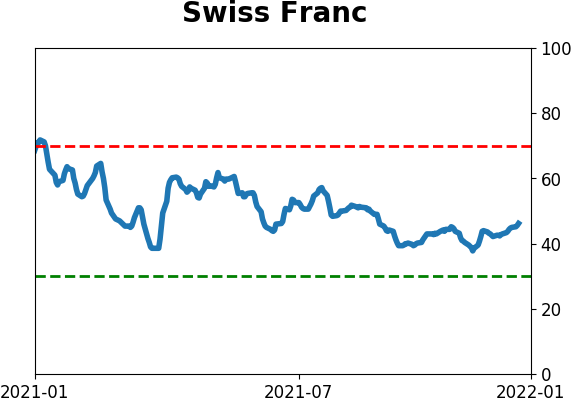
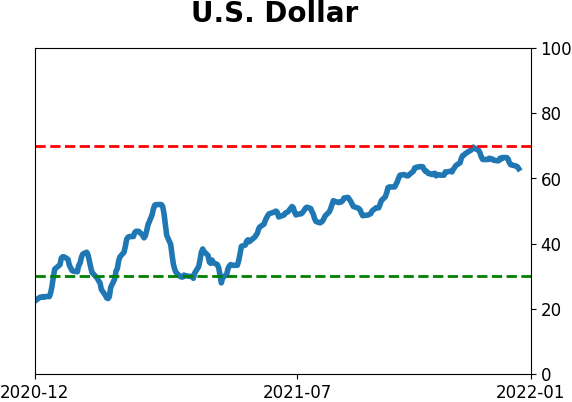
Currency ETF's - 5-Day Moving Average
|
|
|
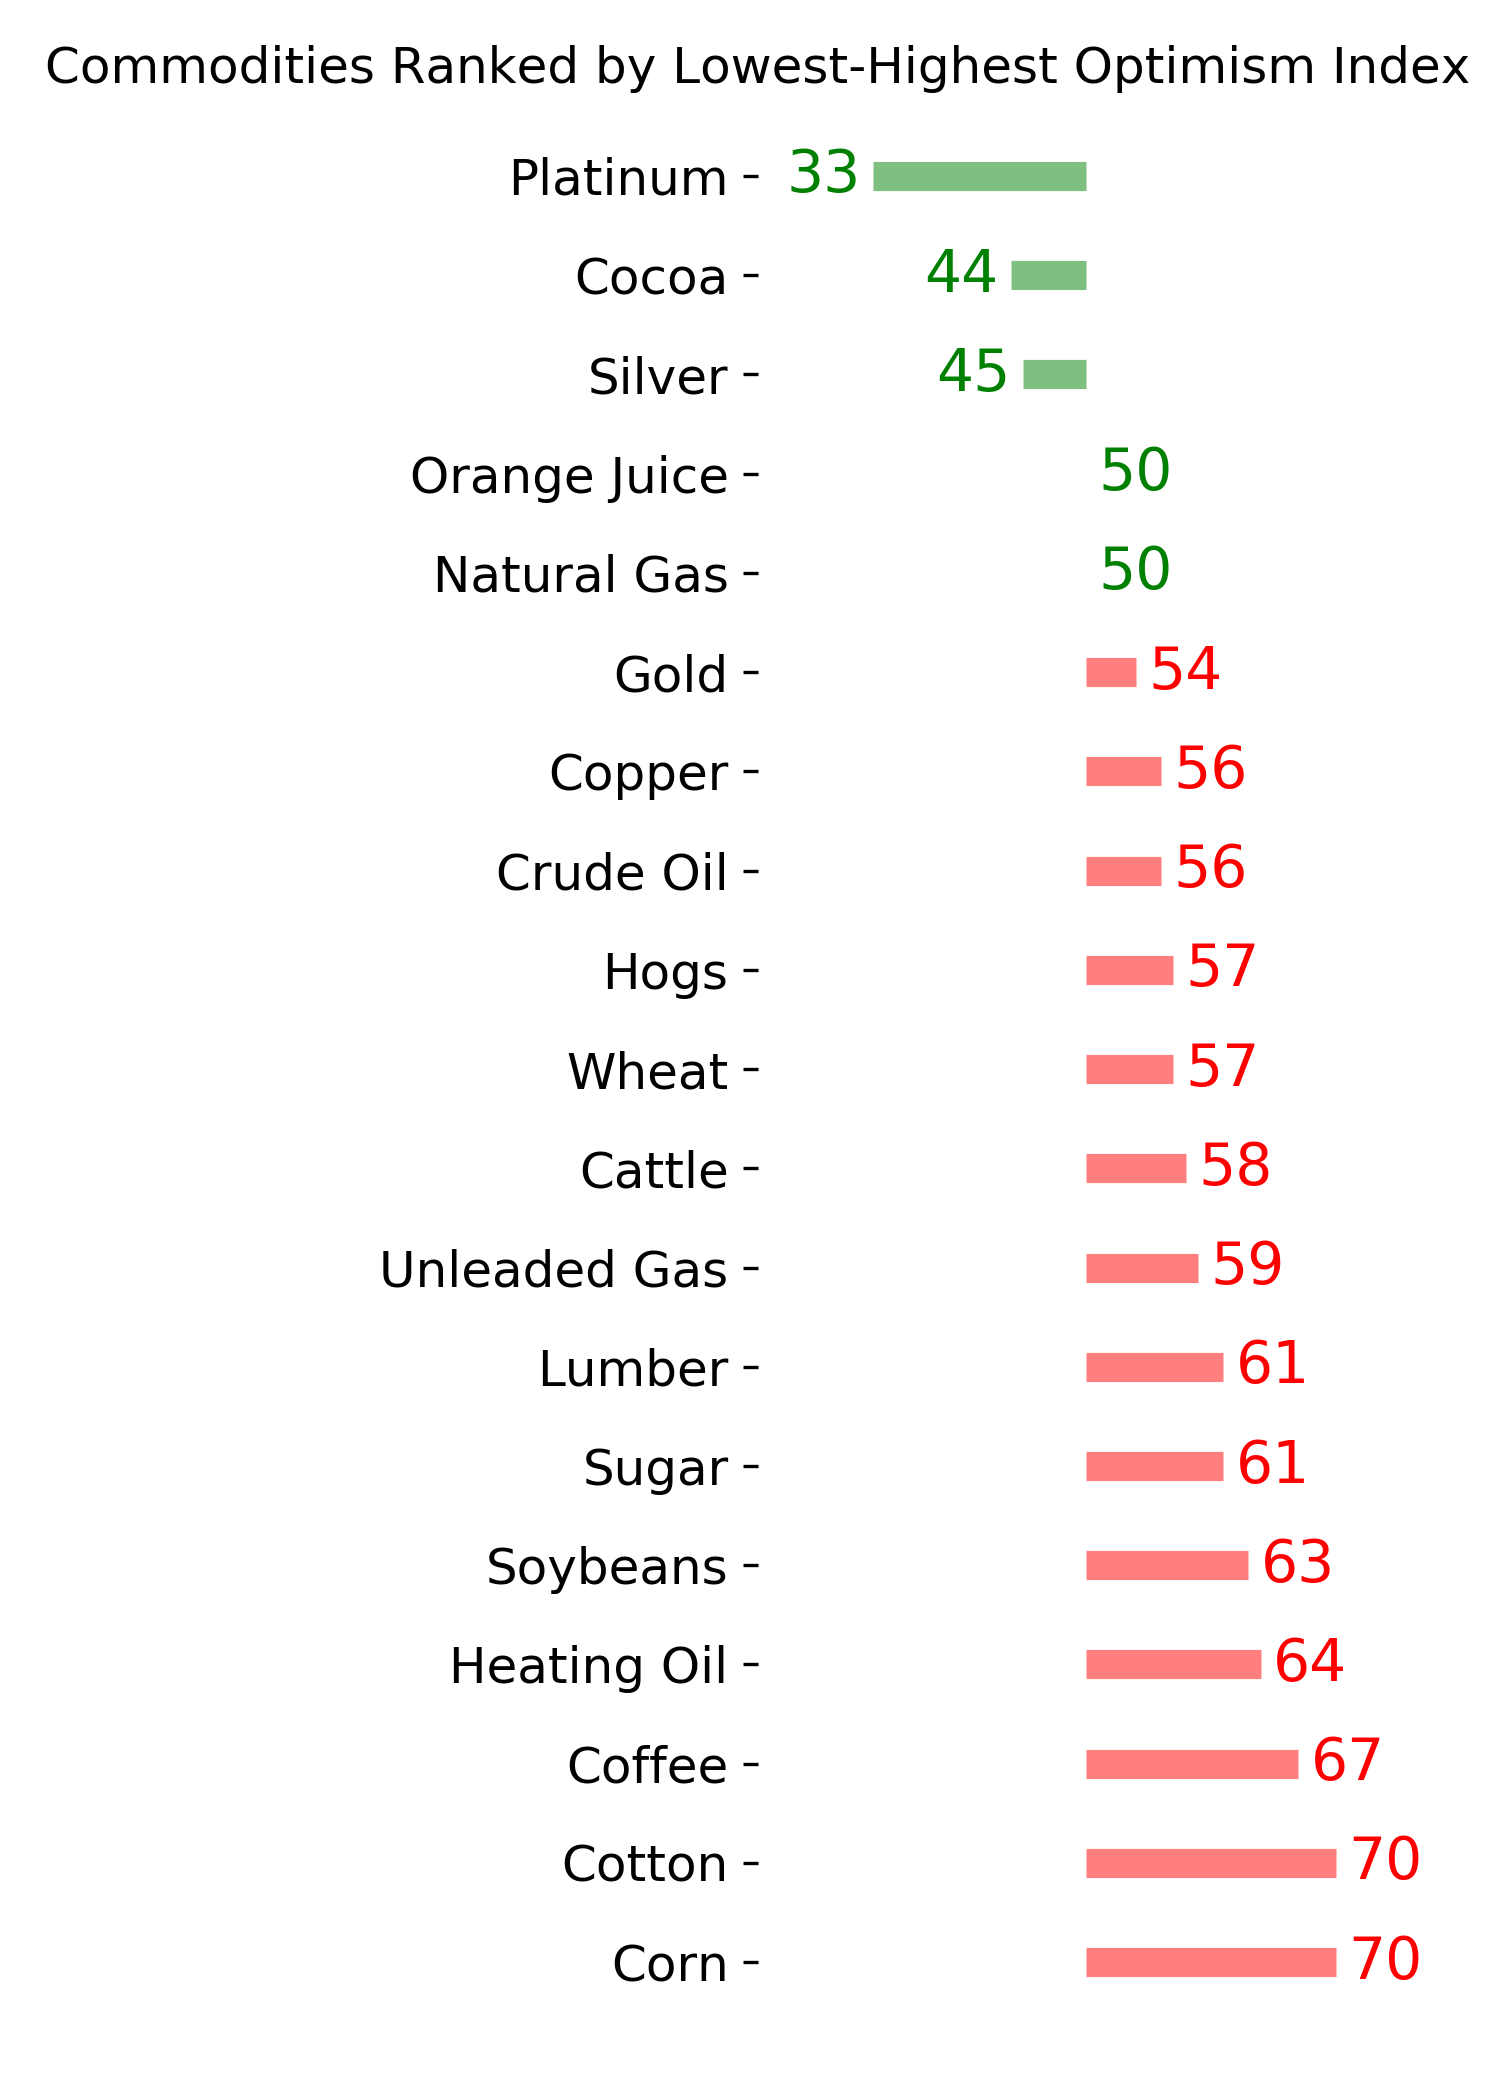
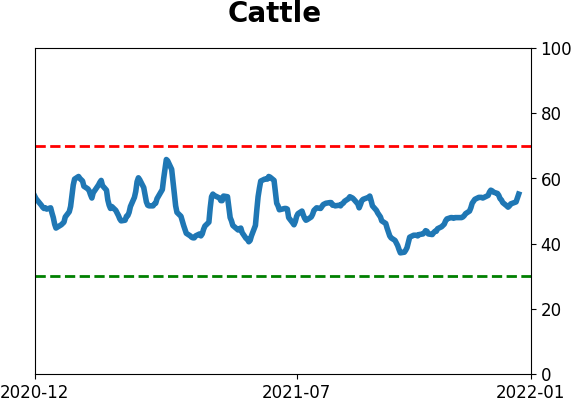
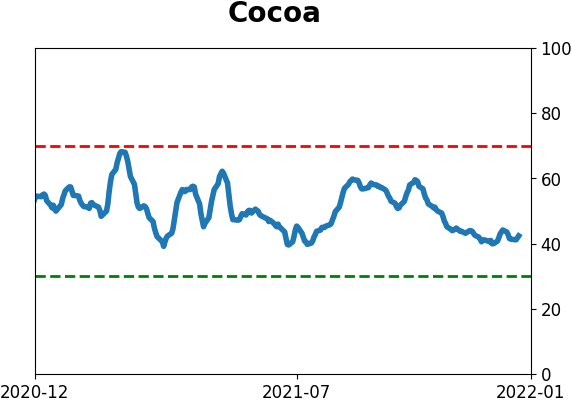
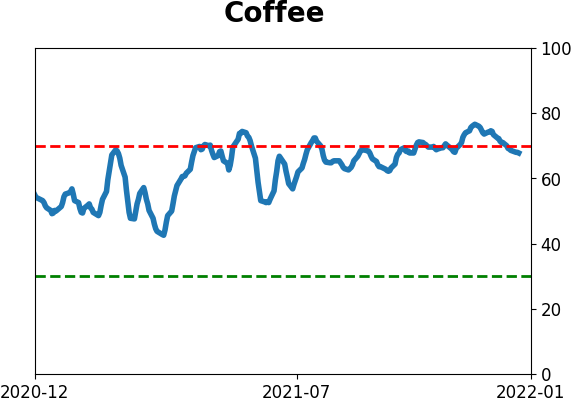
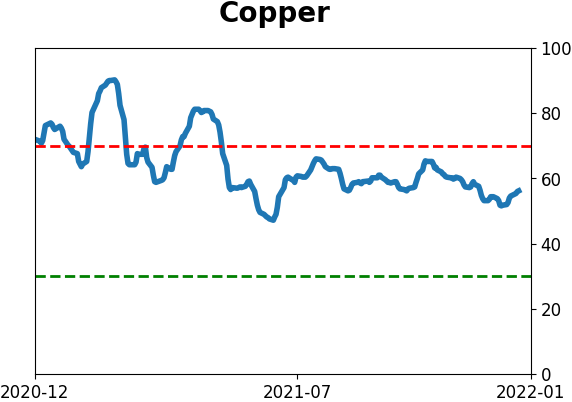
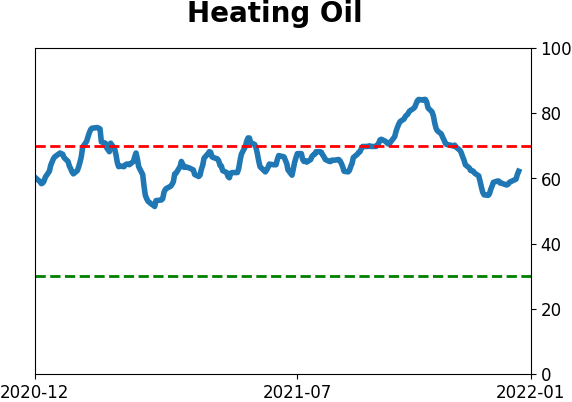
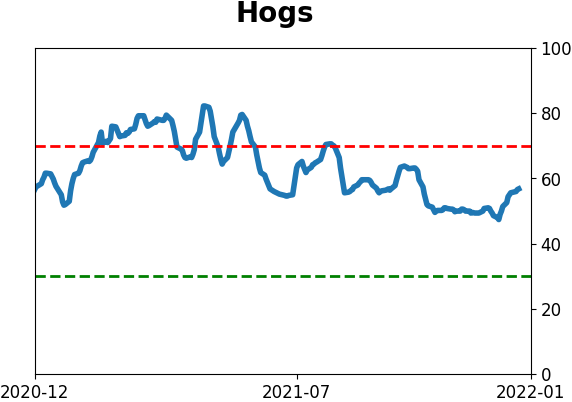
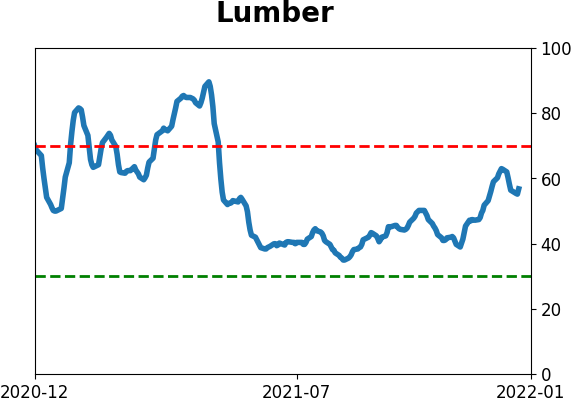
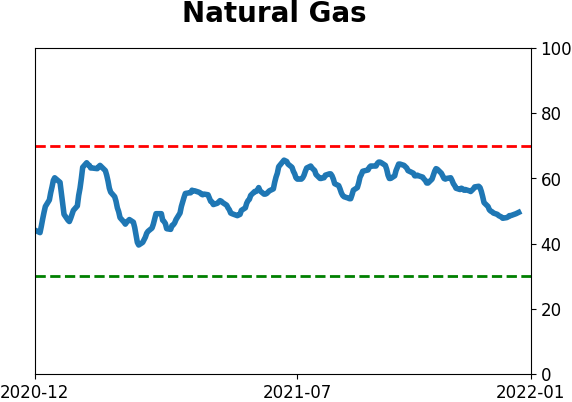
Commodity ETF's - 5-Day Moving Average
|
|