Headlines
|
|
AAII survey shows pessimism despite rising stocks and seasonality:
The S&P 500 is well above its rising 50-week moving average, but investors in the AAII survey have been pessimistic for 5 weeks. This is only the 2nd year they've been pessimistic during the first 4 weeks of December. That kind of behavior has preceded mostly positive returns for stocks, even when they're holding a high allocation to stocks.
The latest Commitments of Traders report was released, covering positions through last Tuesday : The 3-Year Min/Max Screen shows that "smart money" hedgers established a multi-year extreme in energy contracts, with the smallest number of net short contracts in more than 5 years. They've moved to a net long position in oats, which the Backtest Engine shows is a decent sign for forward returns. It's very odd to see that after a parabolic move in the underlying contract. Hedgers are currently holding fewer than 50,000 contracts net long, less than 15% of open interest, in VIX futures. That's the 2nd-lowest amount in more than 2 years, and is a weak argument that the VIX should decline.
Bottom Line:
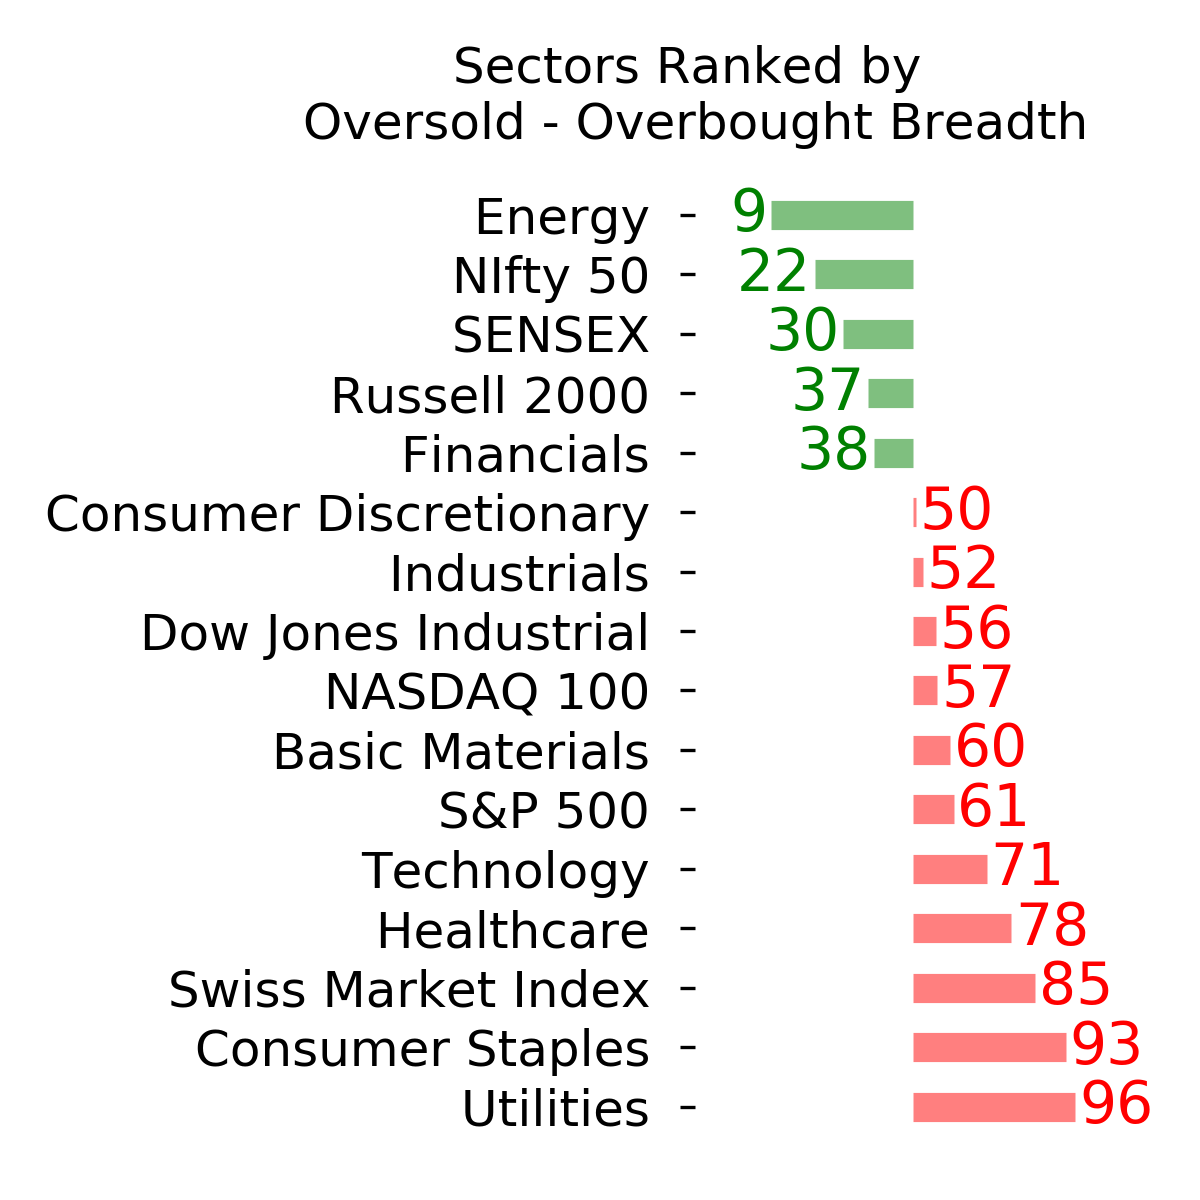
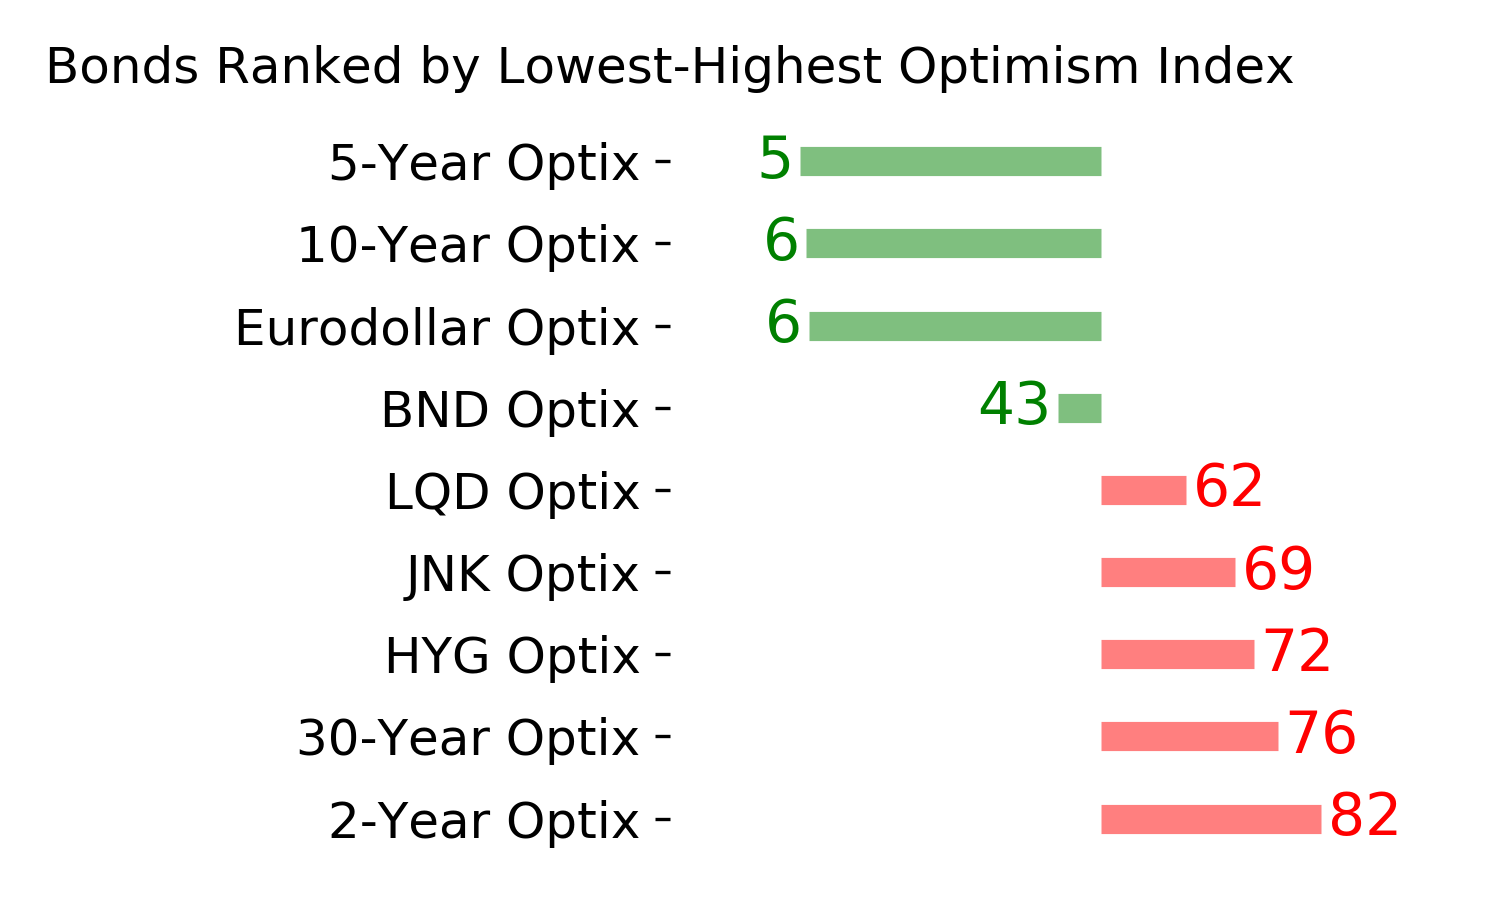
STOCKS: Hold Sentiment hit a pessimistic extreme by early December and then buyers showed enough interest to trigger a thrust in breadth. Those are reliable precursors to higher prices. There is a lot of disagreement among sectors, though, with negative divergences in tech but impressive participation in sectors like consumer staples. We should work higher but it's a bifurcated market. BONDS: Hold Despite mostly steady prices, investors turned pessimistic on bonds to a nearly decade-high degree by late November. Sentiment has recovered since then, which has been a mostly positive sign over the past 20 years, but not necessarily prior to then. GOLD: Hold
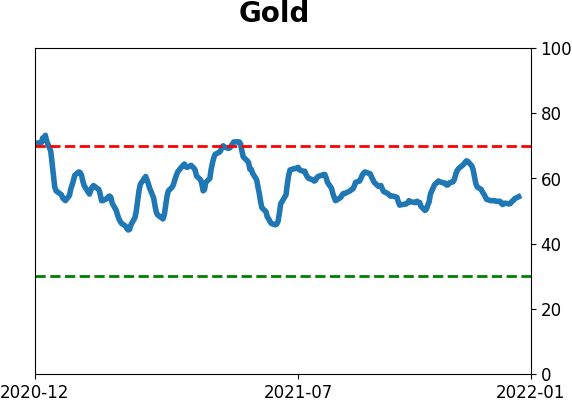
Gold and miners were rejected after trying to recover above their 200-day averages in May. Some oversold extremes in breadth measures among miners triggered in late September, and they rebounded strongly then gave those gains back. Still not much of an apparent edge here.
|
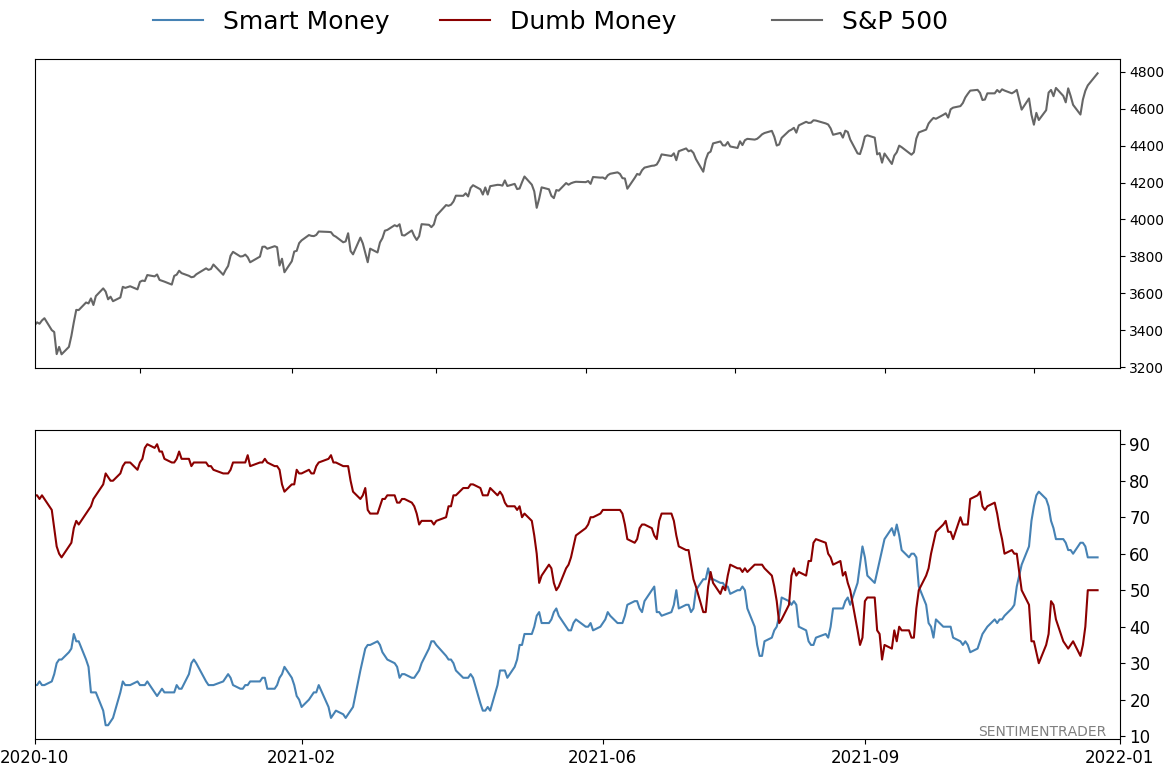
Smart / Dumb Money Confidence
|
Smart Money Confidence: 59%
Dumb Money Confidence: 50%
|
|
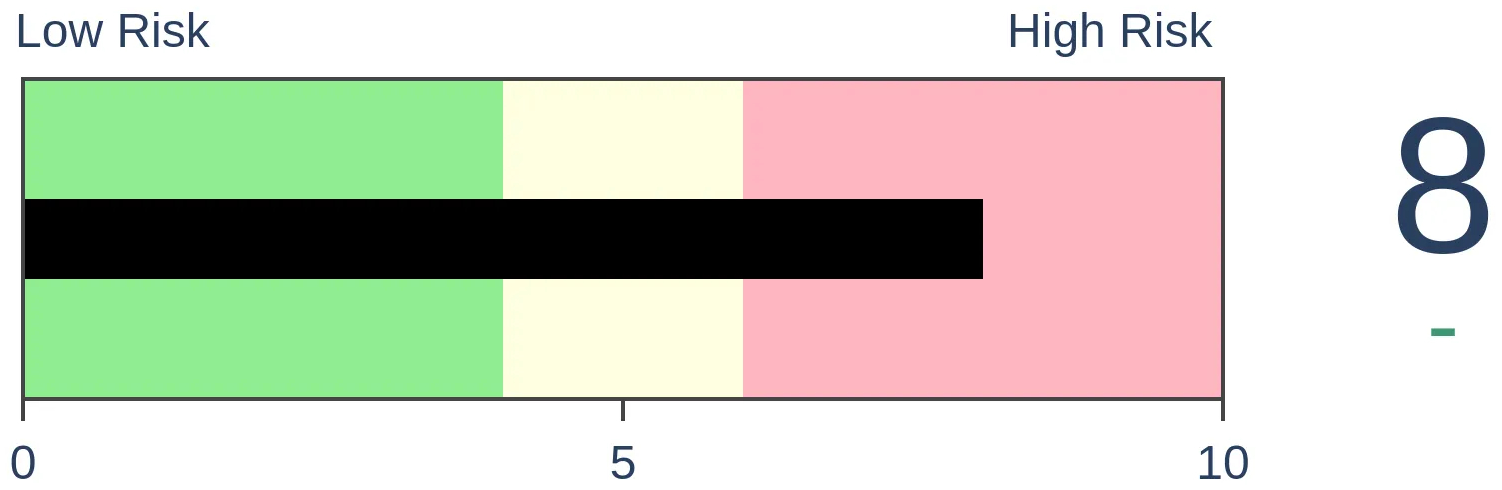
Risk Levels
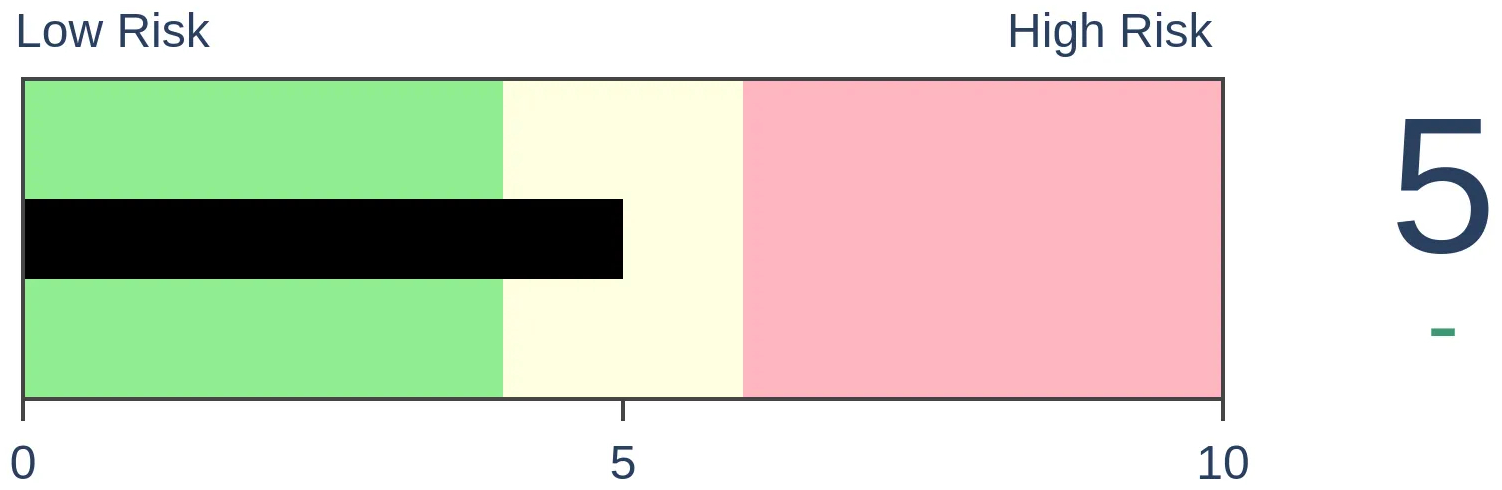
Stocks Short-Term
|
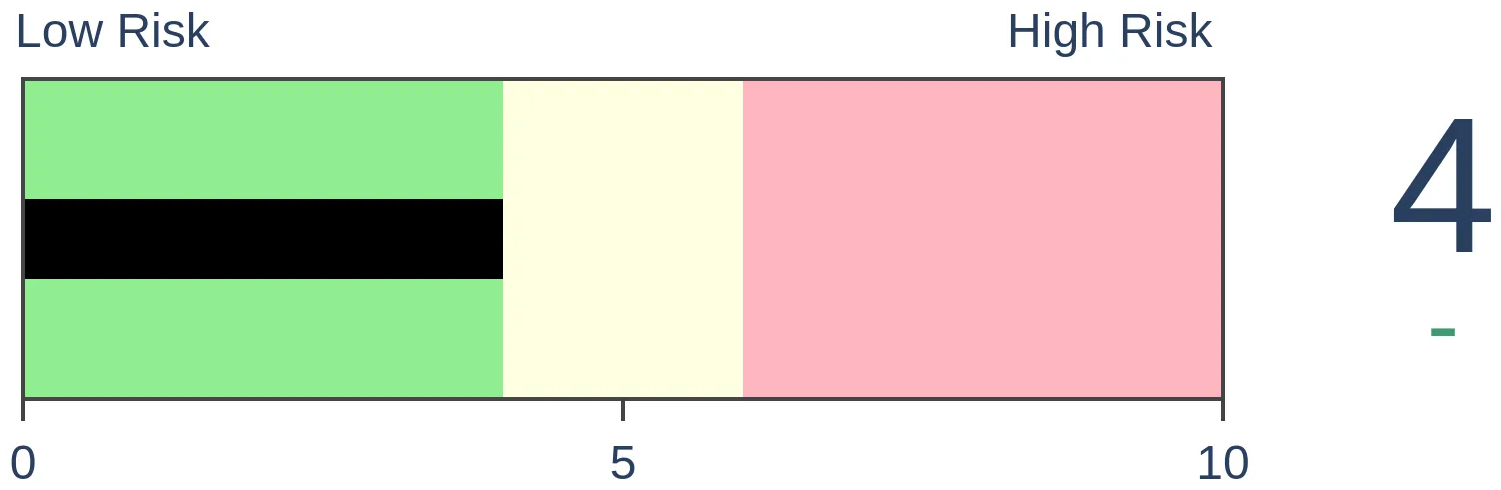
Stocks Medium-Term
|
|
Bonds
|
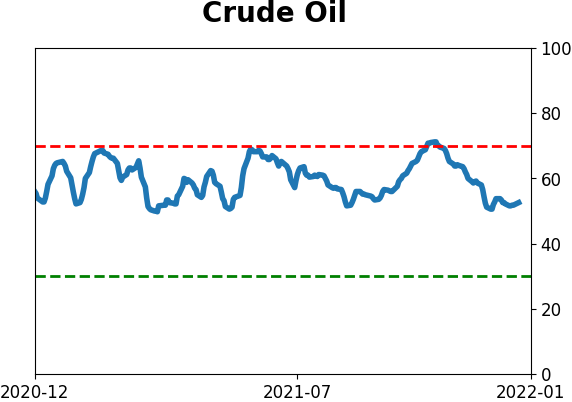
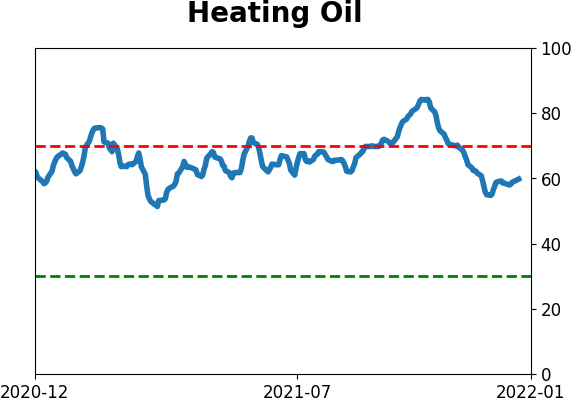
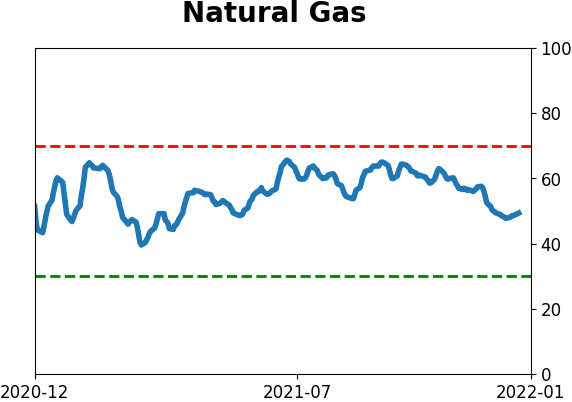
Crude Oil

|
|
Gold

|
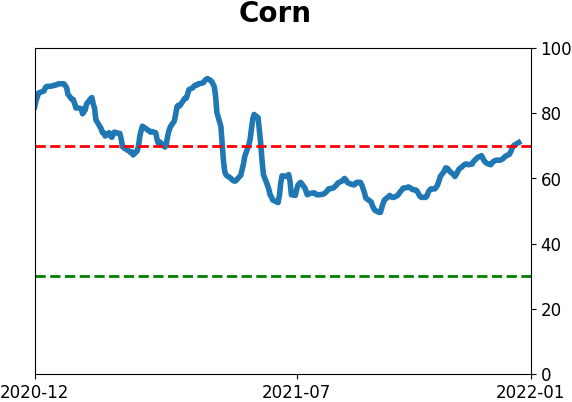
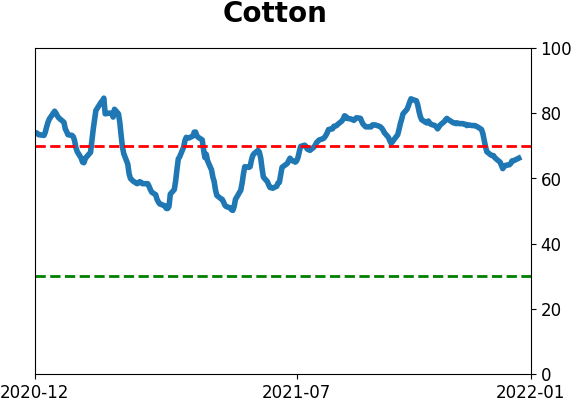
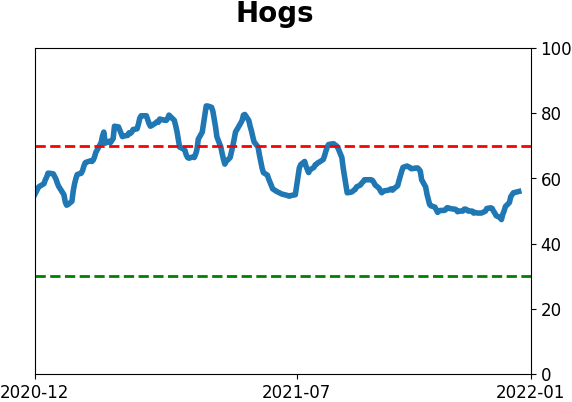
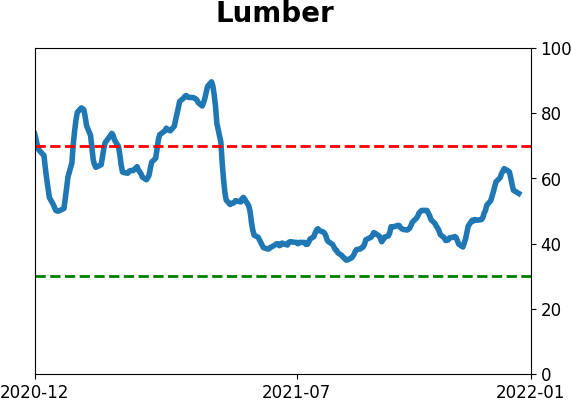
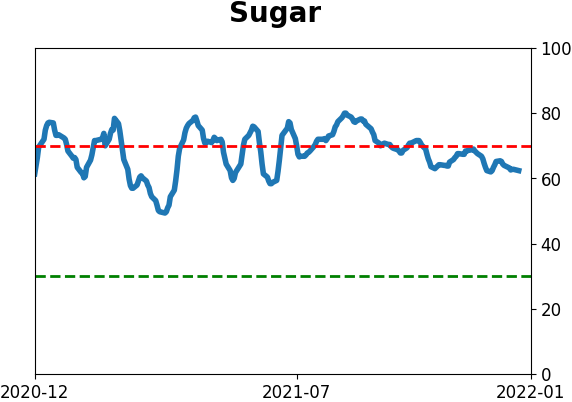
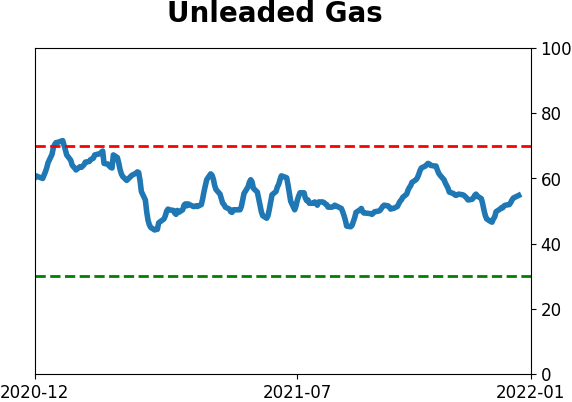
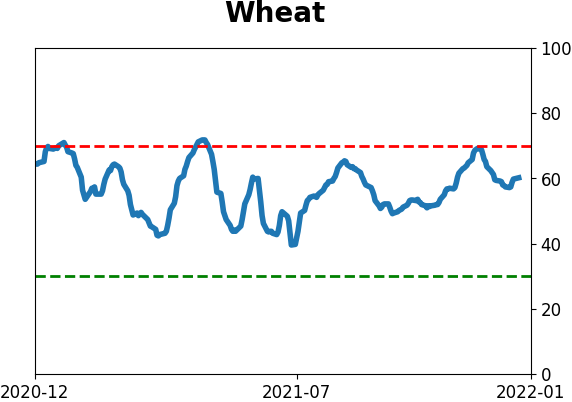
Agriculture

|
|
Research
By Jason Goepfert
BOTTOM LINE
The S&P 500 is well above its rising 50-week moving average, but investors in the AAII survey have been pessimistic for 5 weeks. This is only the 2nd year they've been pessimistic during the first 4 weeks of December. That kind of behavior has preceded mostly positive returns for stocks, even when they're holding a high allocation to stocks.
FORECAST / TIMEFRAME
SPY -- Up, Medium-Term
|
Key points:
- Despite a rising market, the AAII Bull Ratio has been low for 5 weeks
- Pessimism during an uptrend has preceded positive 3-month returns 91% of the time
- It's been less reliable, but still positive, when investors were pessimistic in December
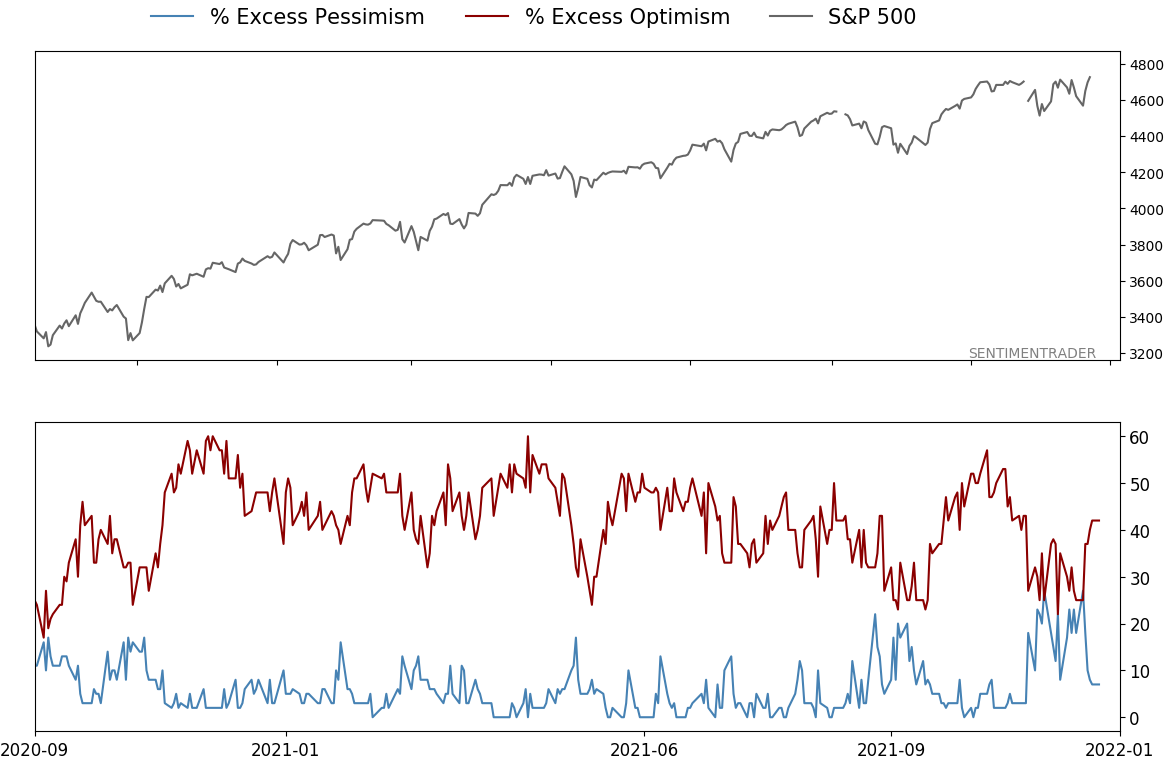
Despite a good market, individuals are pessimistic
Sentiment toward stocks reached its peak soon after the beginning of the year. The speculative orgy heading into February coincided with a peak in some higher-risk assets but not the major indexes.
Even as those indexes have trudged higher, sentiment hasn't become as optimistic as it was early in the year. In particular, the crabby old folks who frequent the surveys from the American Association of Individual Investors have been faithful to their nature. The AAII Bull Ratio has held below 50% for 5 straight weeks.
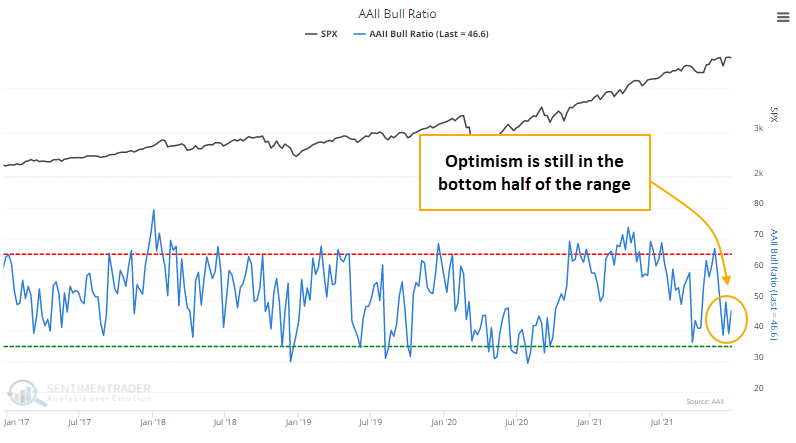
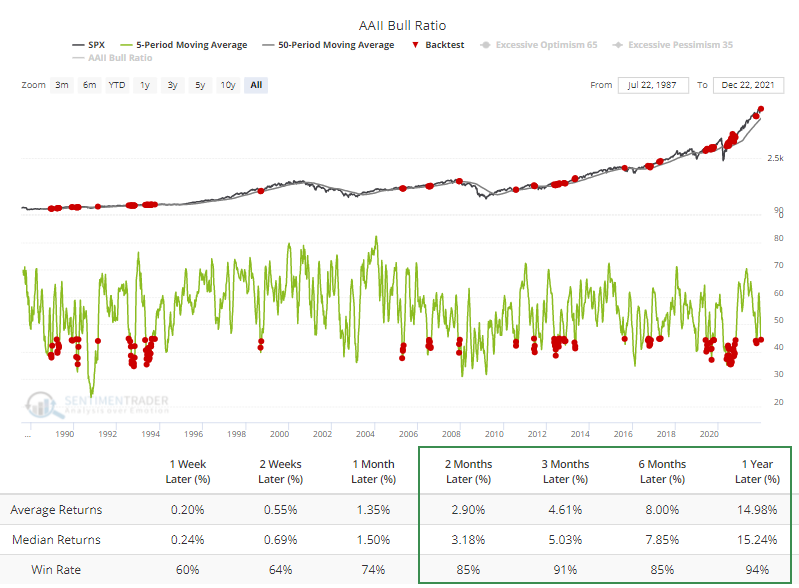
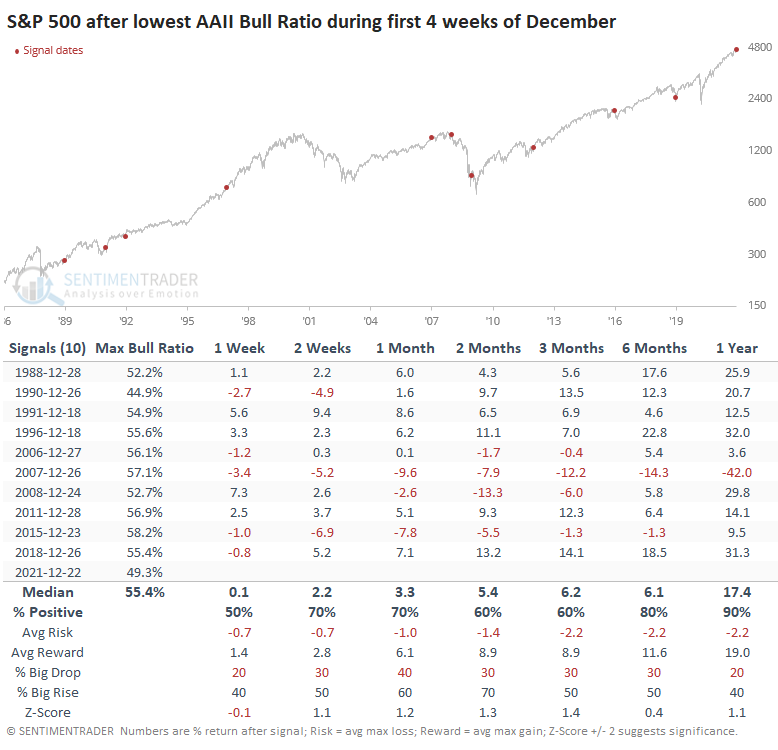
When the 5-week average Bull Ratio is below 45% while the S&P 500 is above its rising 50-week moving average, the Backtest Engine shows that the S&P gained 91% of the time, 123 out of 135 weeks, over the next 3 months. There was a nasty loss during the 2008 financial crisis, but other than that, returns were mostly pristine.
This is only the 2nd year with December pessimism
Not only is it unusual to see this behavior when the S&P 500 is holding near all-time highs, but even crabby people tend to turn more optimistic during the holidays. Not this year - this is only the 2nd year time the inception of the AAII survey that the Bull Ratio was negative for the first 4 weeks of December. The other was the recessionary year of 1990.
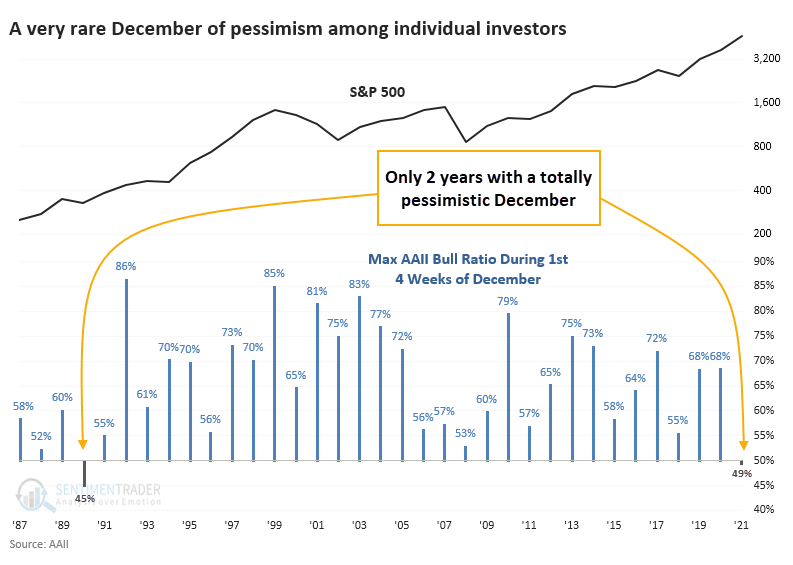
After the Decembers with the least optimistic investors, the S&P 500 performed well. Stocks stumbled following the 1990 bout of pessimism, then soared. Short-term returns were mixed, but over the next 6-12 months, the S&P only showed a rare loss.
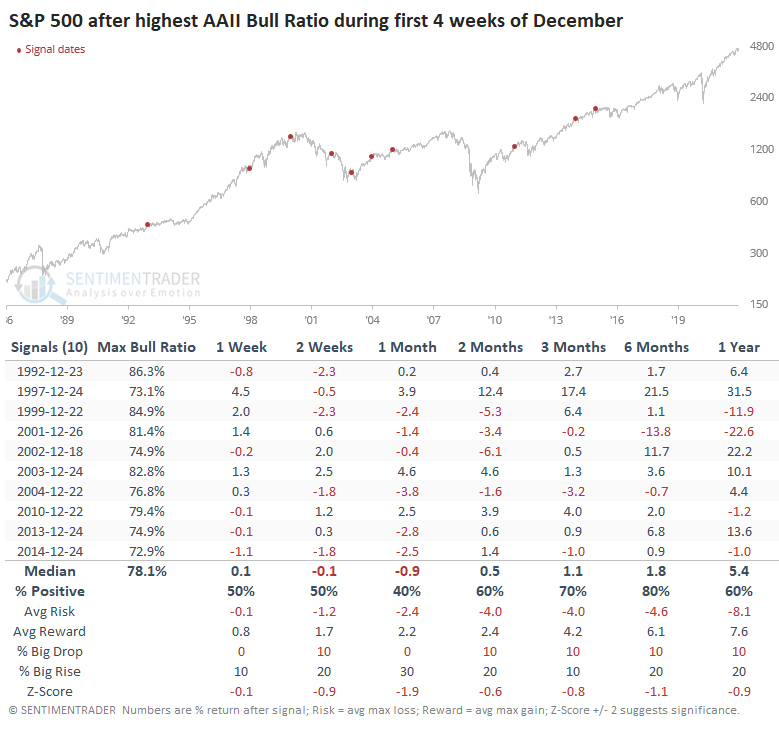
Returns were significantly more muted following Decembers with the most optimism.
They're buying stocks despite their pessimism
There is often a disconnect between what these folks say and what they do. Despite tepid optimism in recent months, their stock allocation is near all-time highs. Go figure.
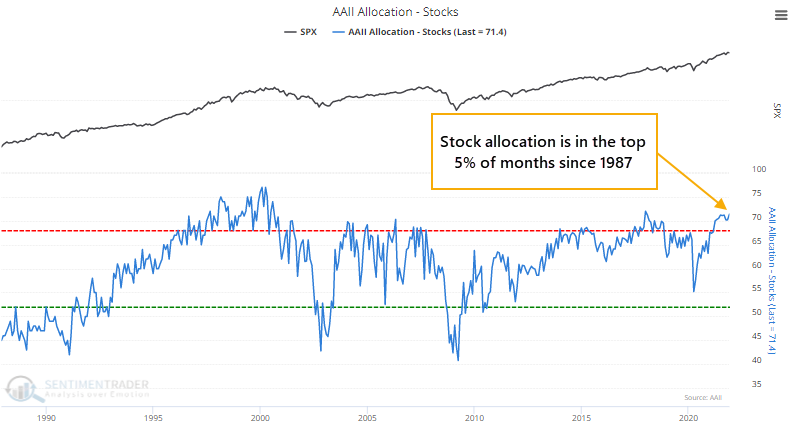
Their monthly allocation to assets tends to get stuck at extremes for extended periods, and using it as a guide to future returns is tricky. When there was a wide disparity between their allocation and their opinion, it favored their allocation. Besides the financial crisis, their high stock allocation was rewarded more than their pessimism.
What the research tells us...
It's sketchy to rely on the AAII survey as representing "sentiment." It's a niche poll of a relatively homogenous group, with noisy gyrations that have little correlation to past or future market movements. Moving averages of the data have been more helpful, and low levels of optimism like we see now have had a good record at preceding good returns in stocks. The current low optimism given a mostly healthy market environment, especially during this time of year, suggests higher prices.
Active Studies
| Time Frame | Bullish | Bearish | | Short-Term | 0 | 0 | | Medium-Term | 9 | 2 | | Long-Term | 9 | 4 |
|
Indicators at Extremes
Portfolio
| Position | Description | Weight % | Added / Reduced | Date | | Stocks | RSP | 10.7 | Added 6.4% | 2021-10-01 | | Bonds | 32.7% BND, 7.1% SCHP | 39.8 | Added 8.3% | 2021-10-26 | | Commodities | GCC | 2.4 | Reduced 2.1%
| 2020-09-04 | | Precious Metals | GDX | 4.6 | Reduced 4.2% | 2021-05-19 | | Special Situations | 9.8% KWEB, 4.7% XLE, 2.9% PSCE | 17.3 | Added 9.78% | 2021-10-01 | | Cash | | 24.1 | | |
|
Updates (Changes made today are underlined)
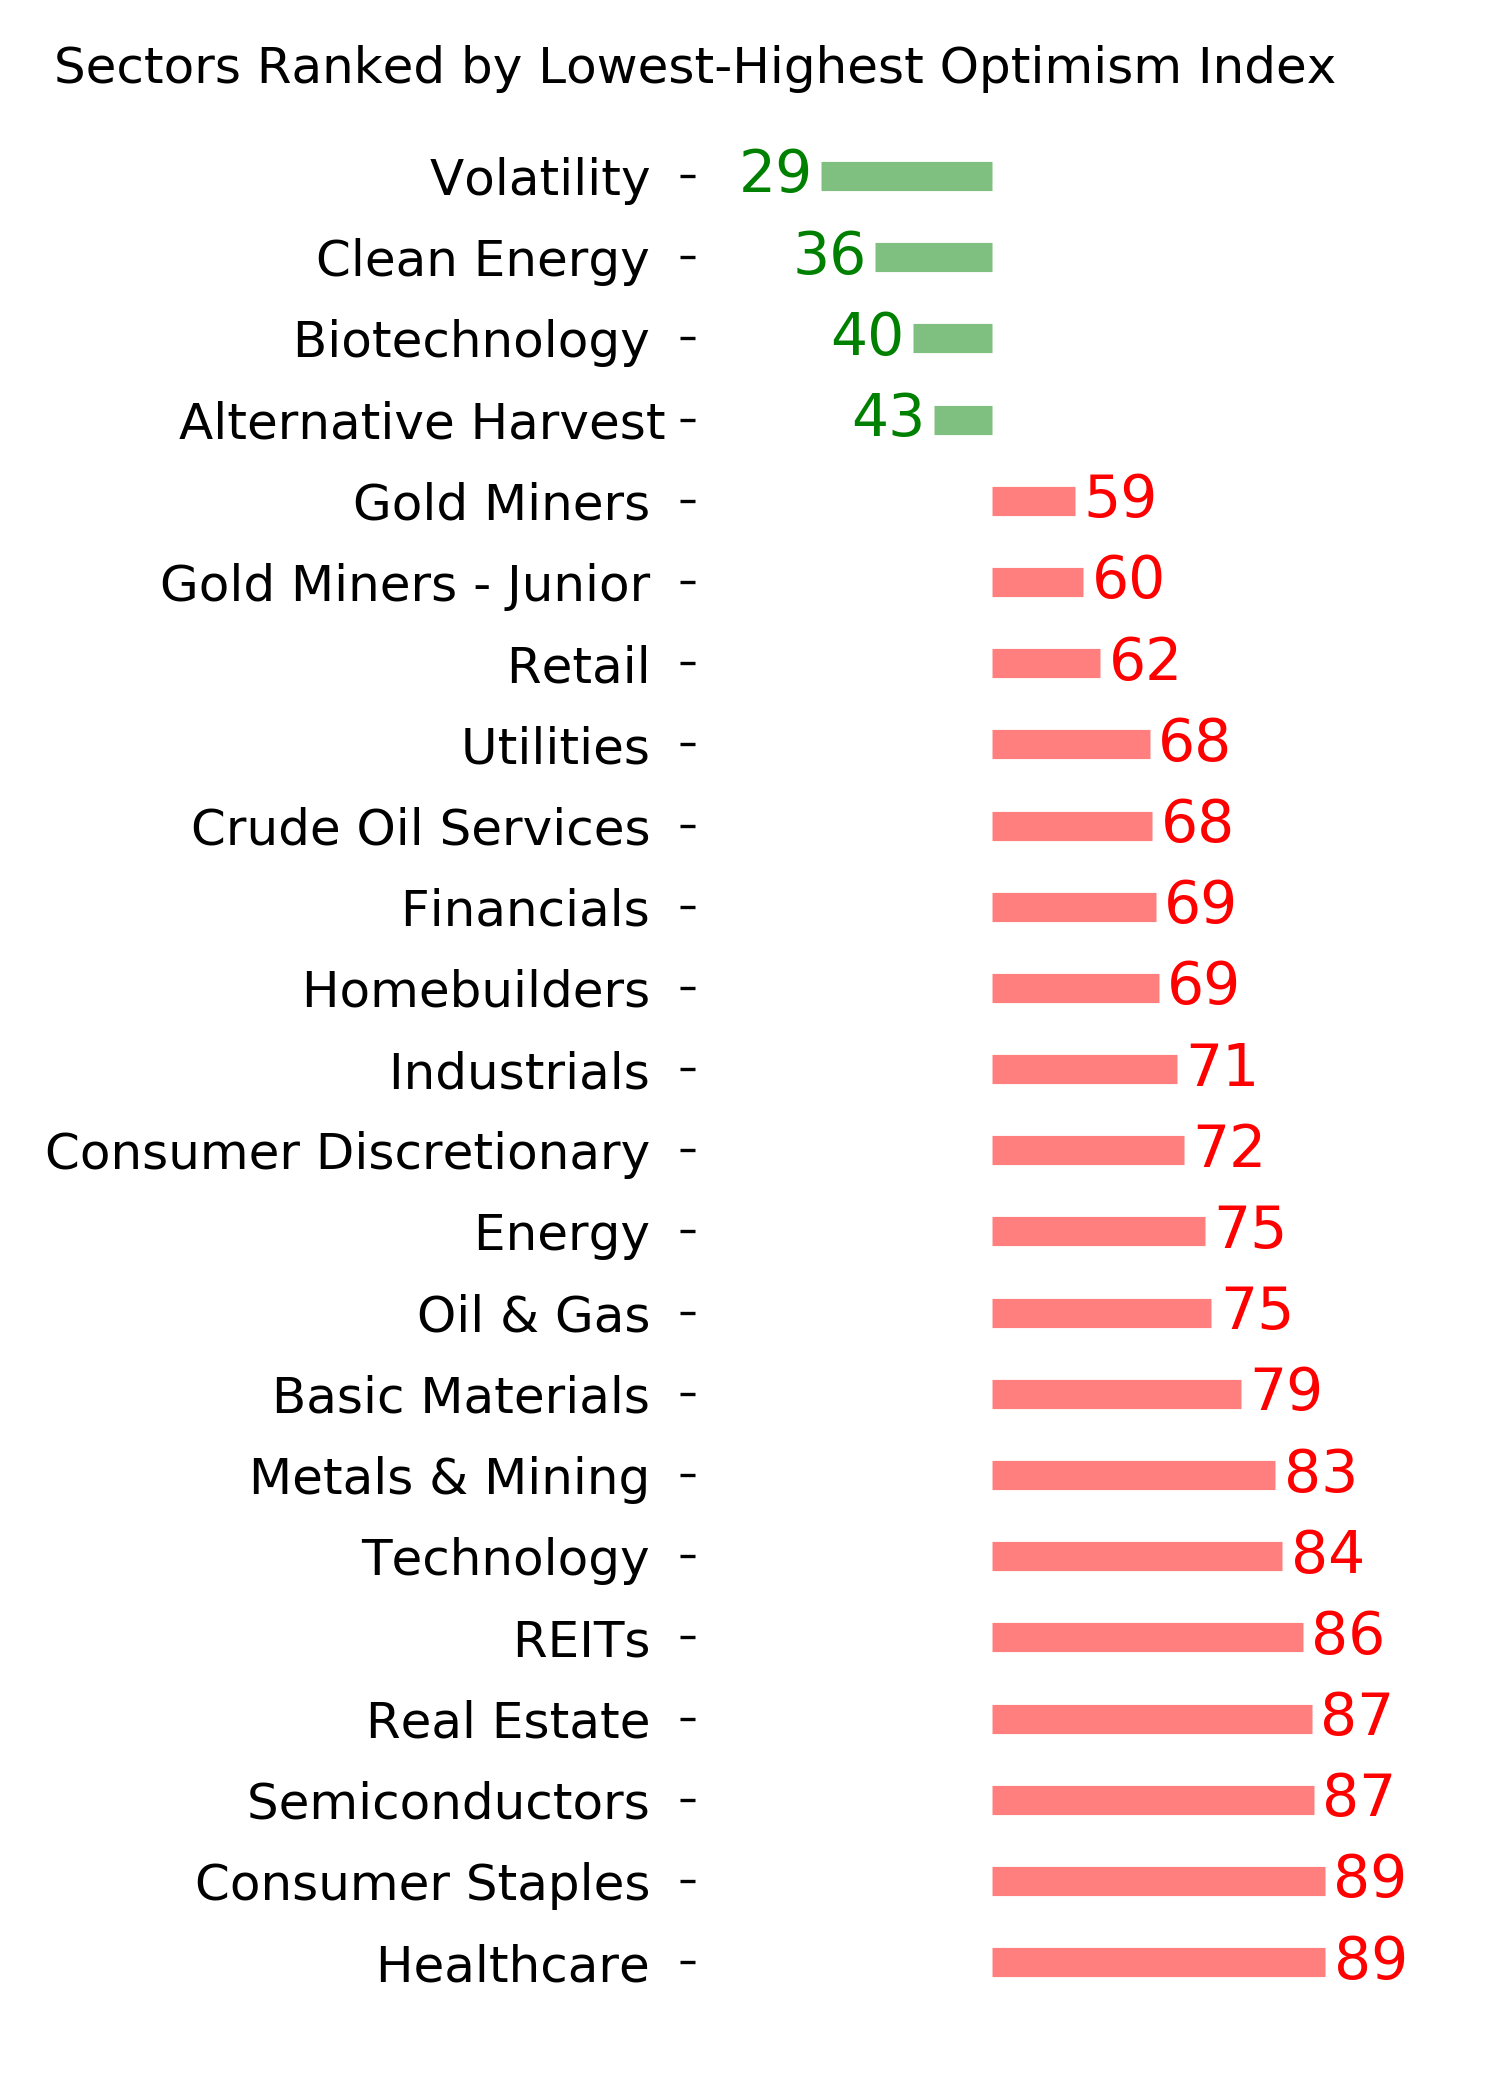
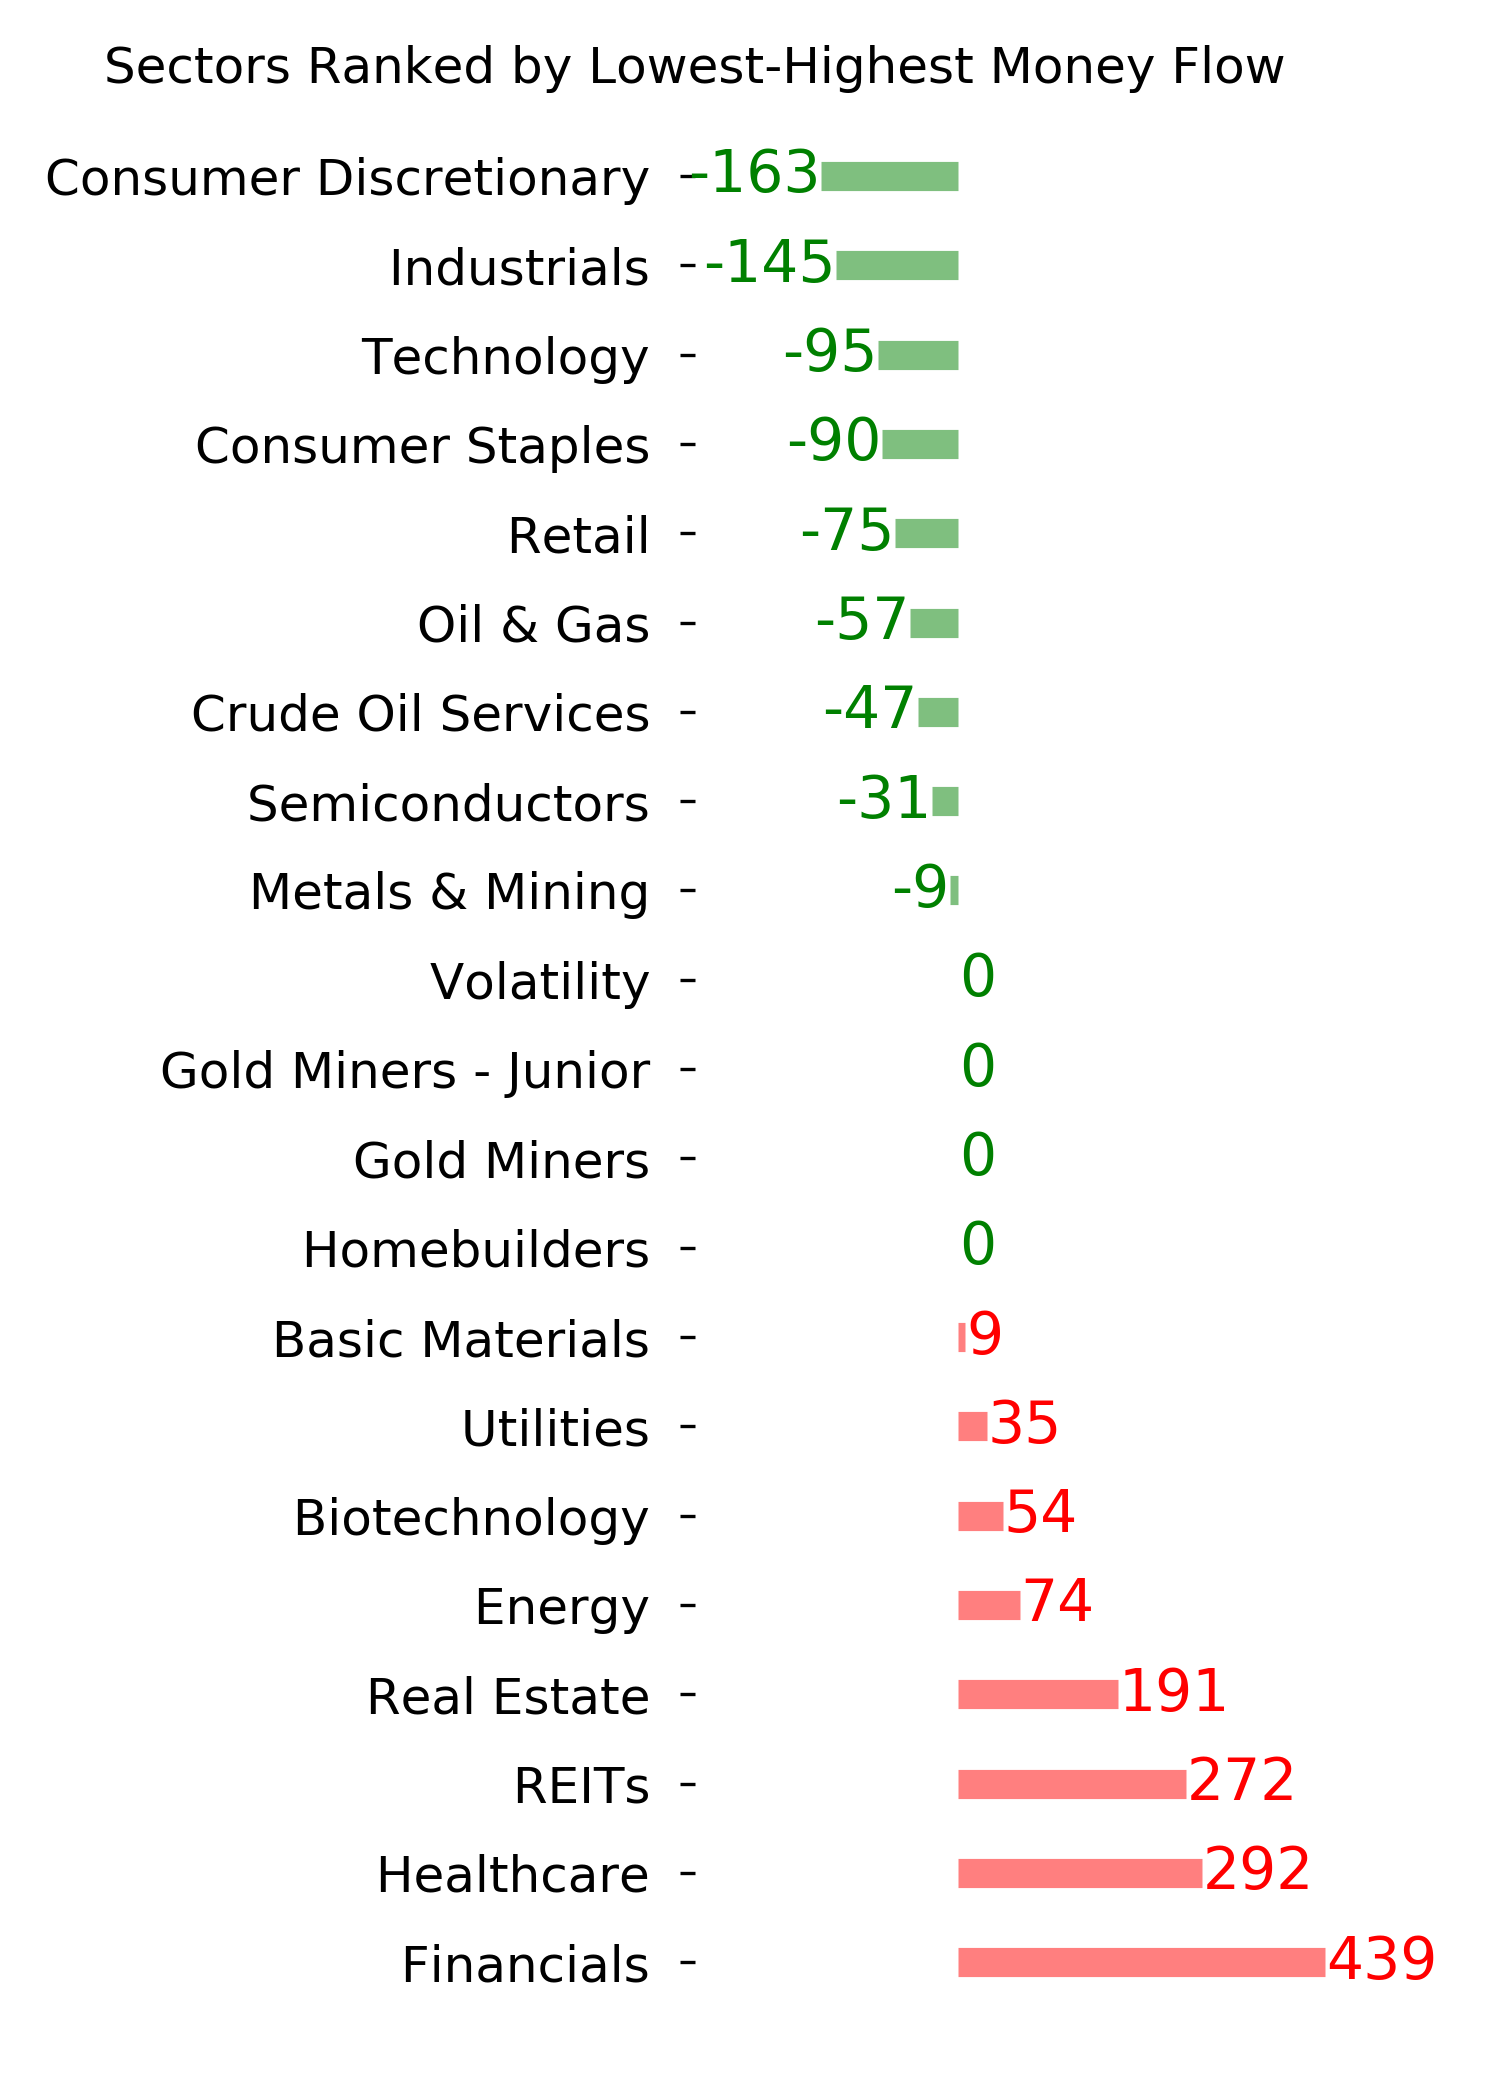
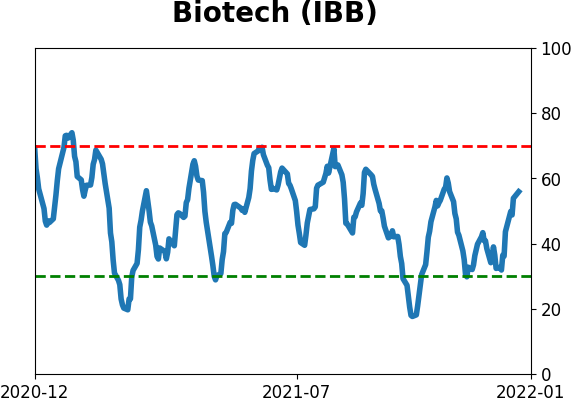
No surprise for 2021, but we're seeing conflicting messages in some of what has developed lately. There was a jump in pessimism heading into December, which has been relieved to some degree. The subsequent breadth thrust has extremely positive implications for forward returns, especially longer-term. The negatives are mostly sector-related, especially the negative divergences among Nasdaq 100 stocks. Consumer Staples have seen an impressive surge, and Biotech may be oversold, but otherwise there are a whole lot of crosscurrents and seemingly not much edge. Bond sentiment is trying to recover from a recent bout of pessimism, and gold stocks are doing their thing which is not much at all. They've been flat for six months. Chinese tech stocks were doing exactly what they're supposed to do, then did *not* by plunging to new lows. This is troubling on a shorter-term time frame, but this was never meant for a trade, rather a multi-year investment. Recent behavior is troubling and I will not be adding any exposure as long as that's the case. RETURN YTD: 8.2% 2020: 8.1%, 2019: 12.6%, 2018: 0.6%, 2017: 3.8%, 2016: 17.1%, 2015: 9.2%, 2014: 14.5%, 2013: 2.2%, 2012: 10.8%, 2011: 16.5%, 2010: 15.3%, 2009: 23.9%, 2008: 16.2%, 2007: 7.8%
|
|
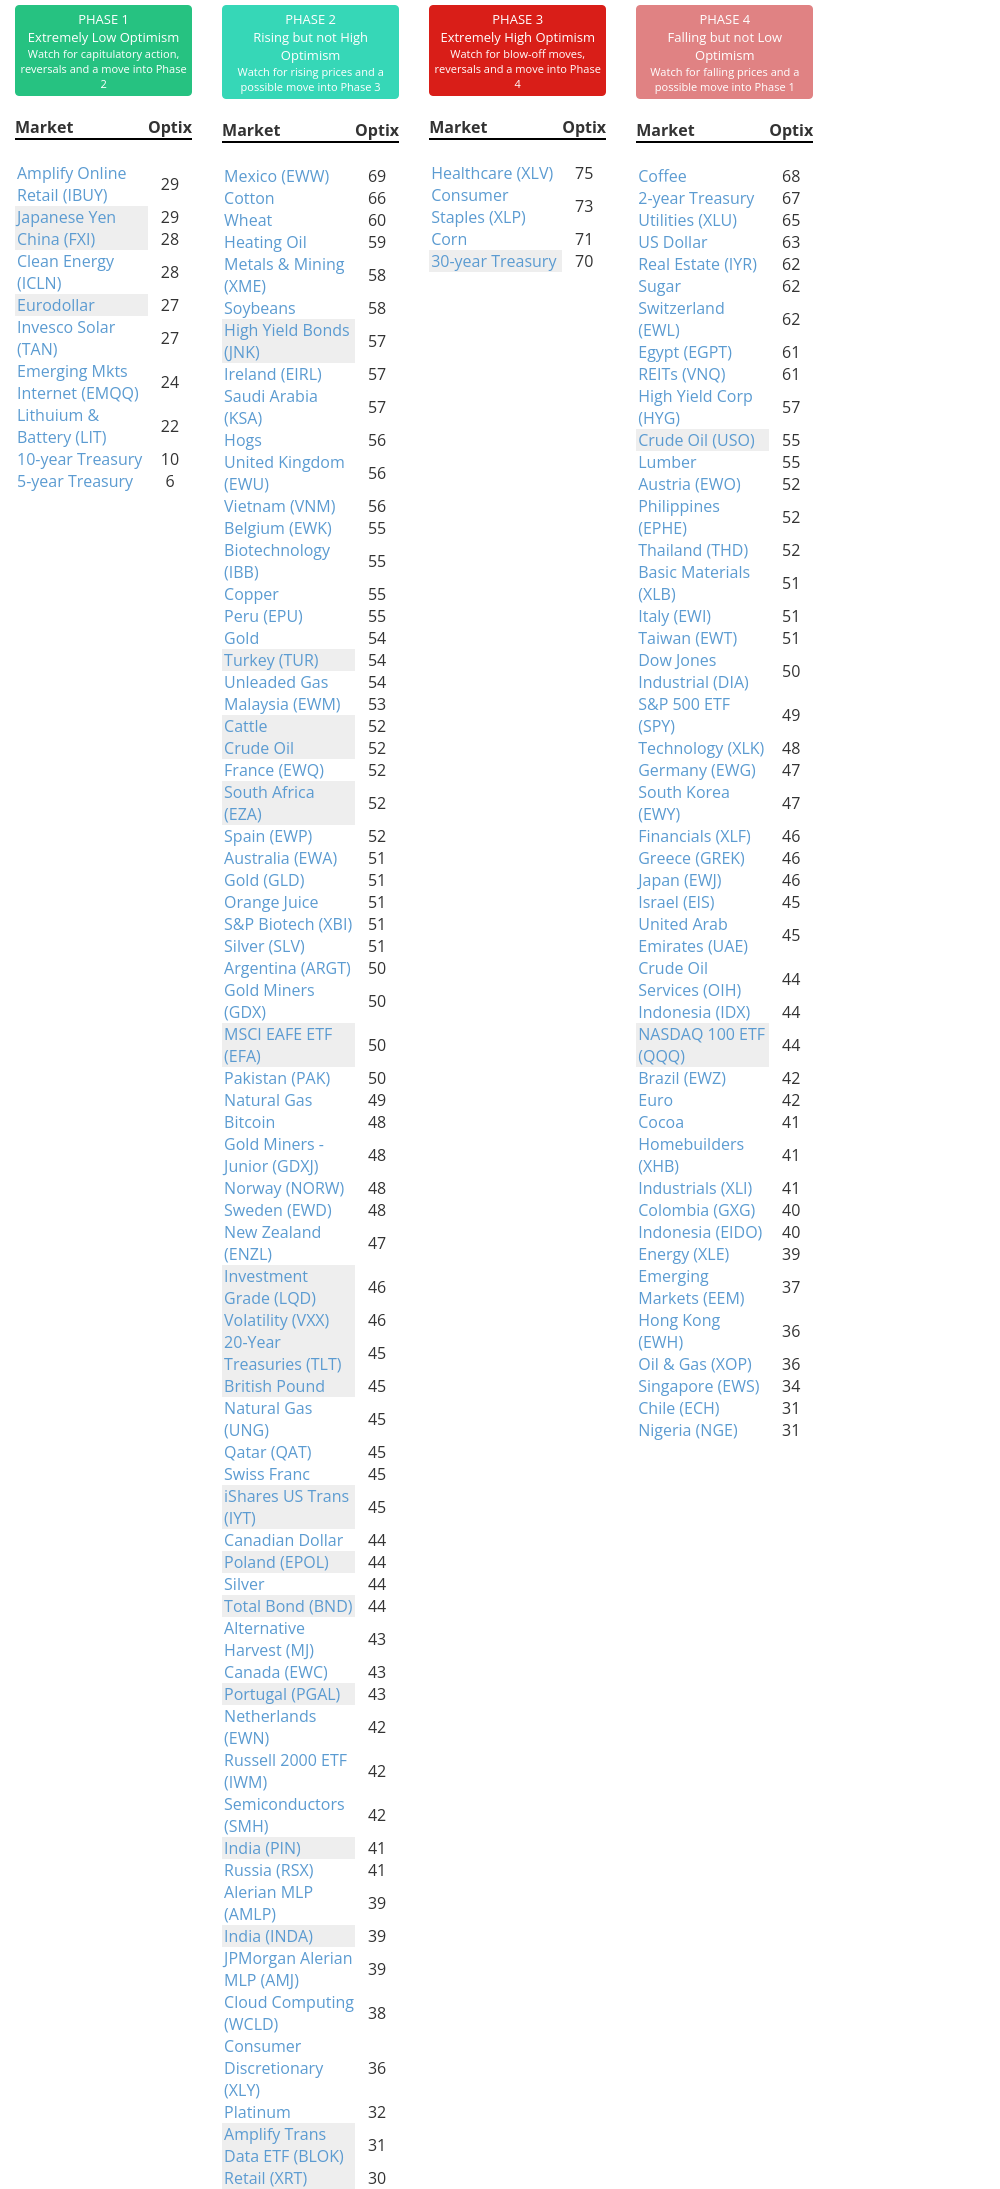
Phase Table
Ranks
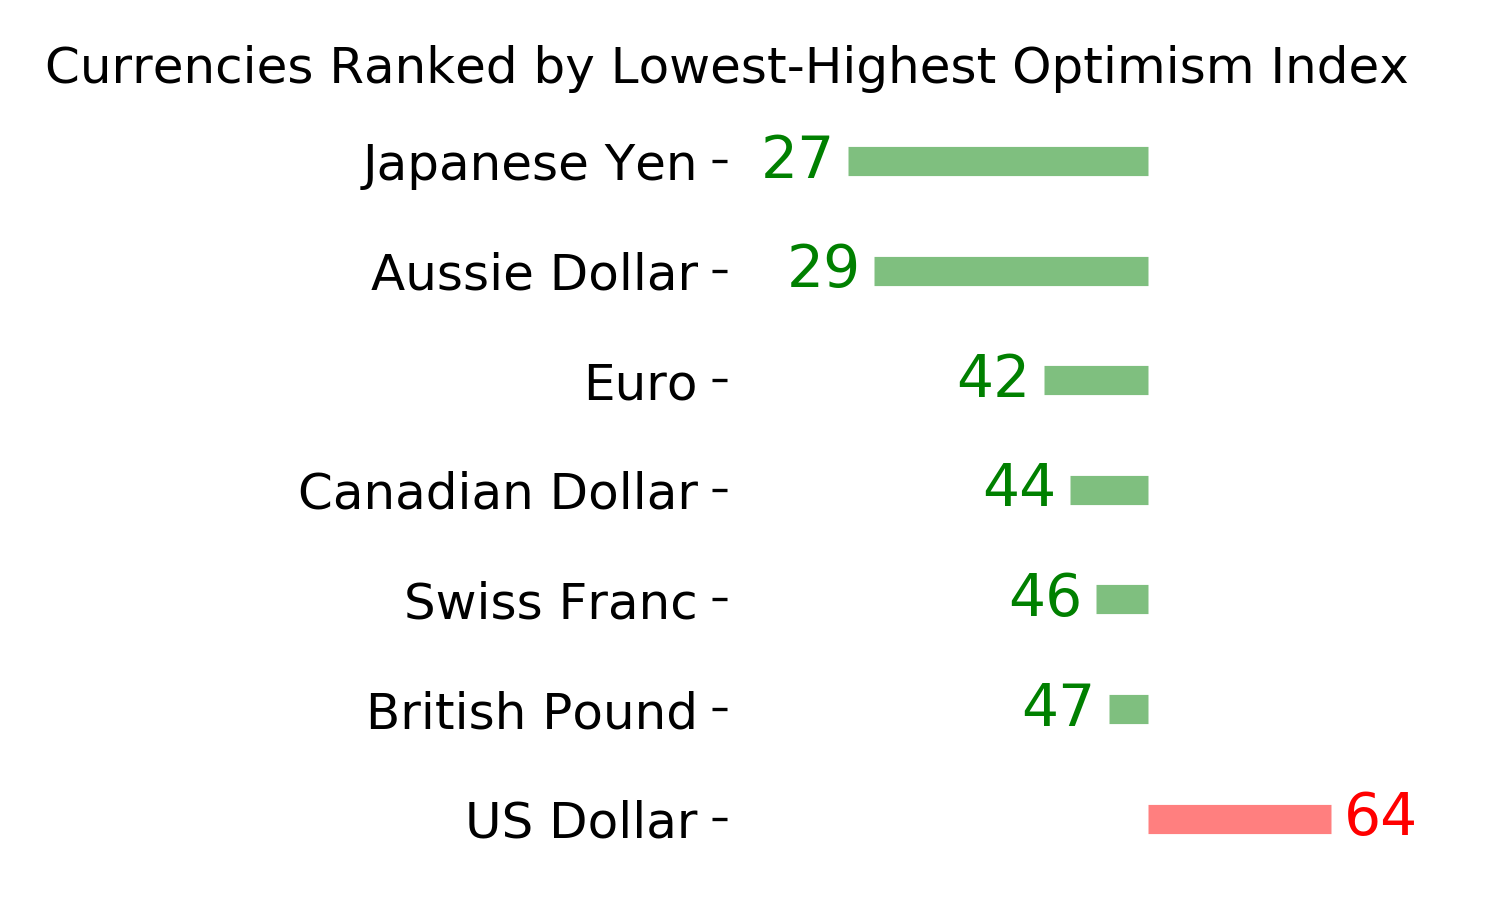
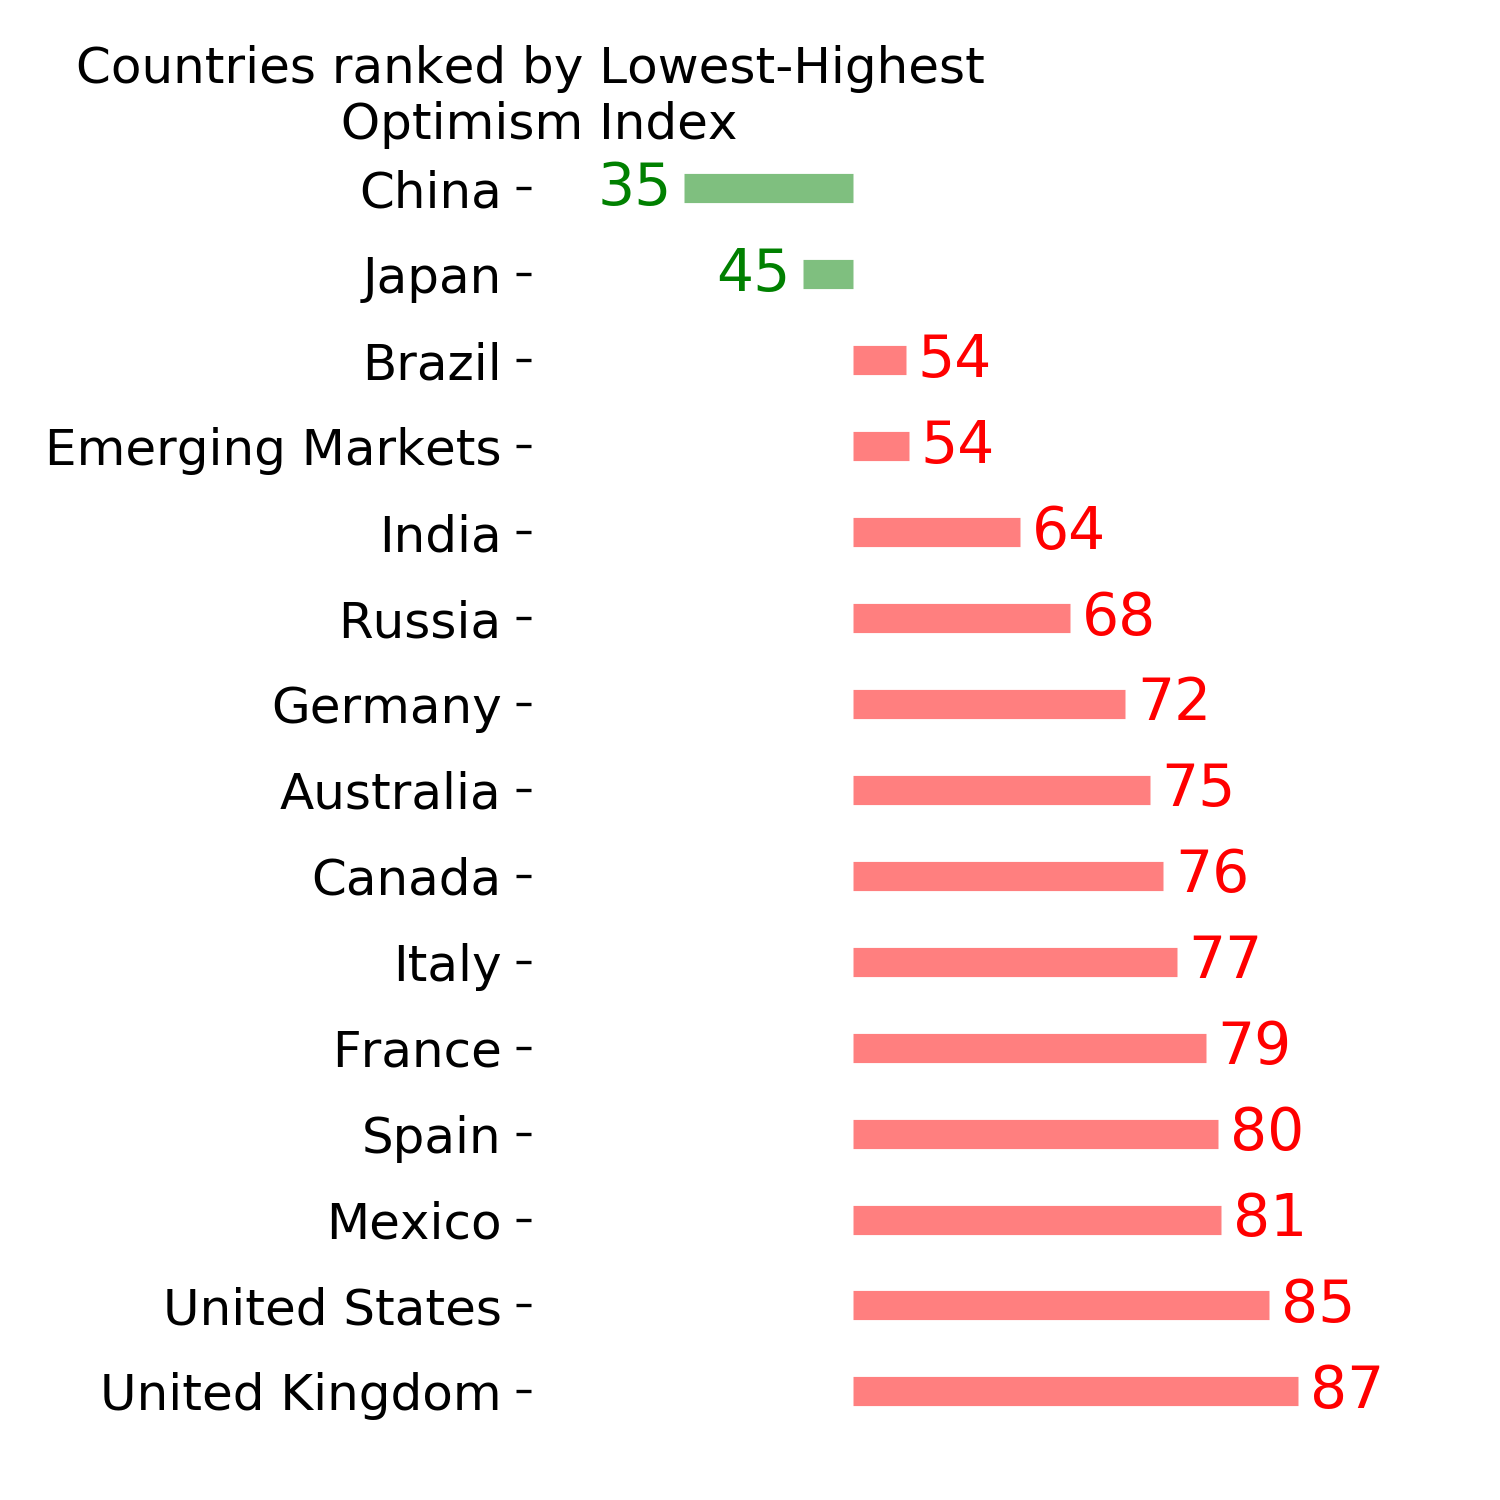
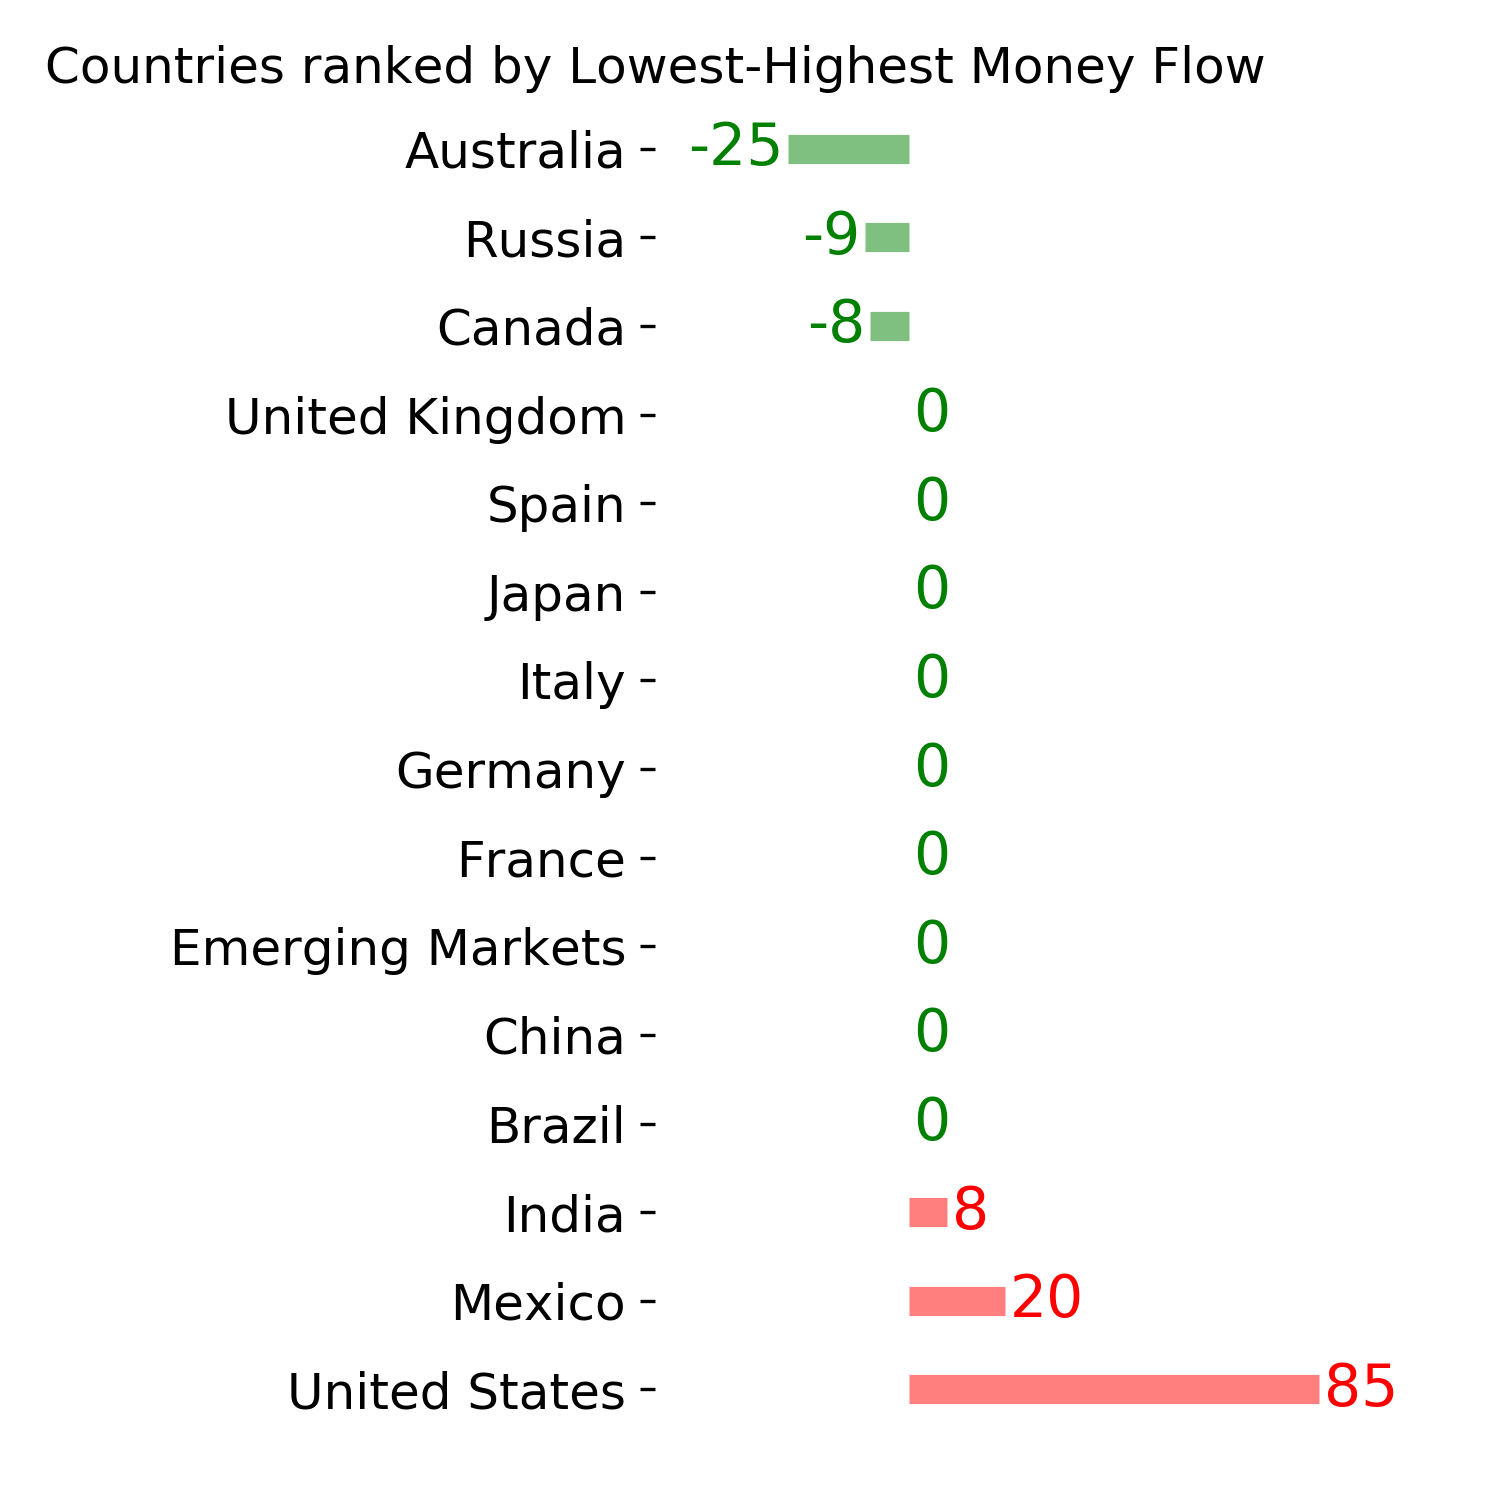
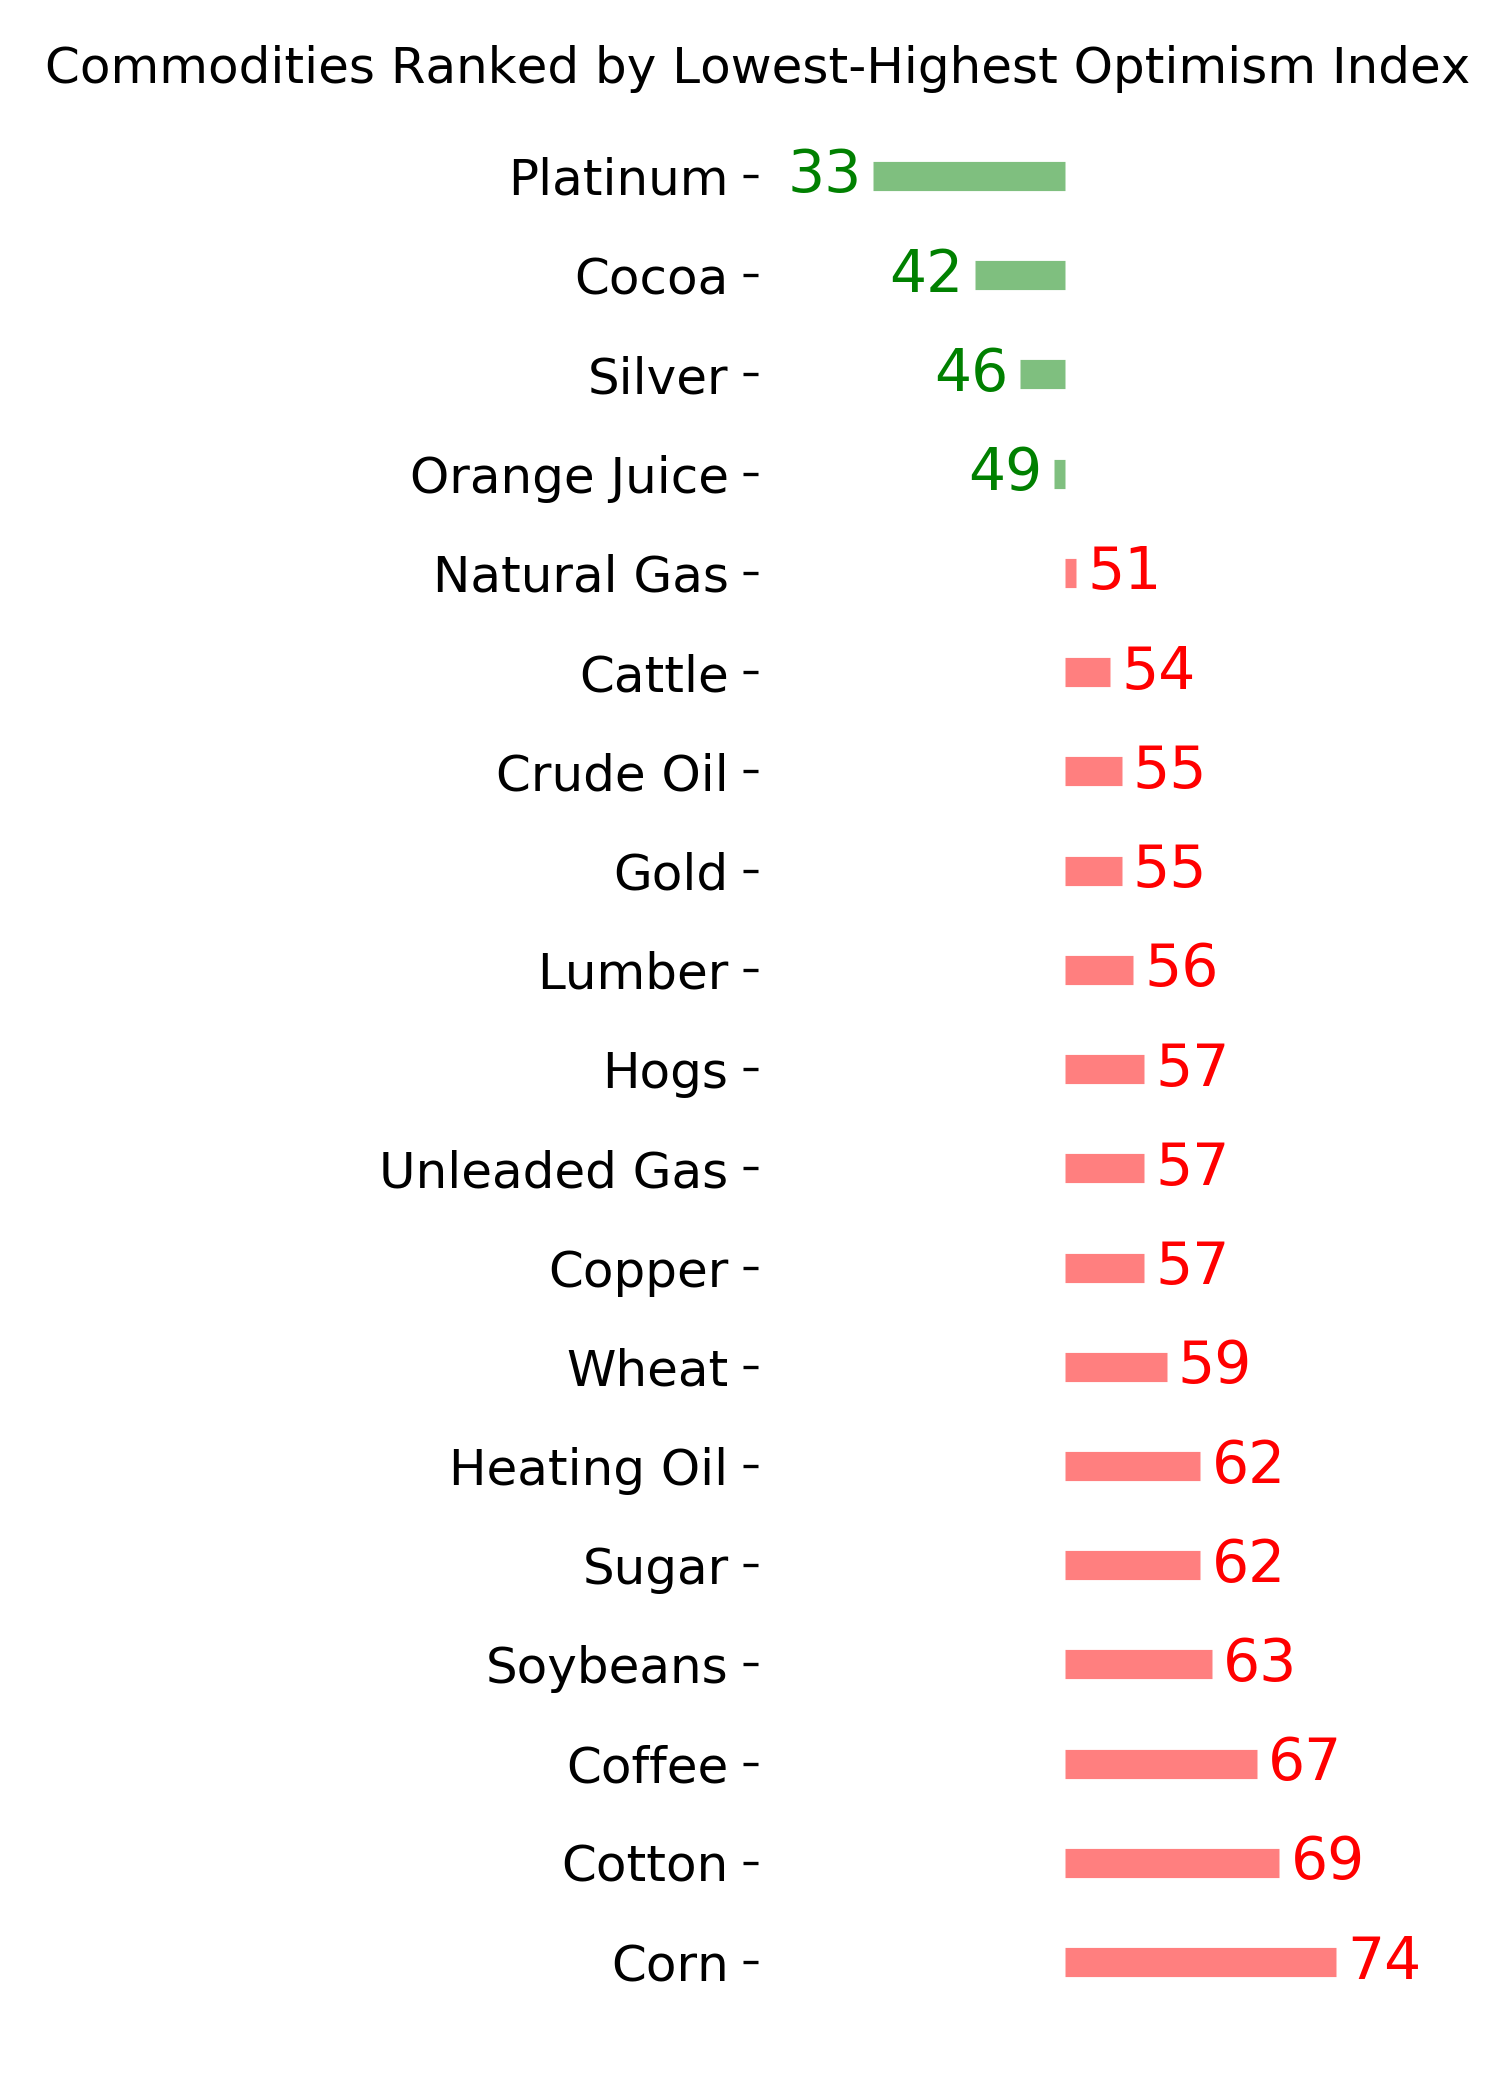
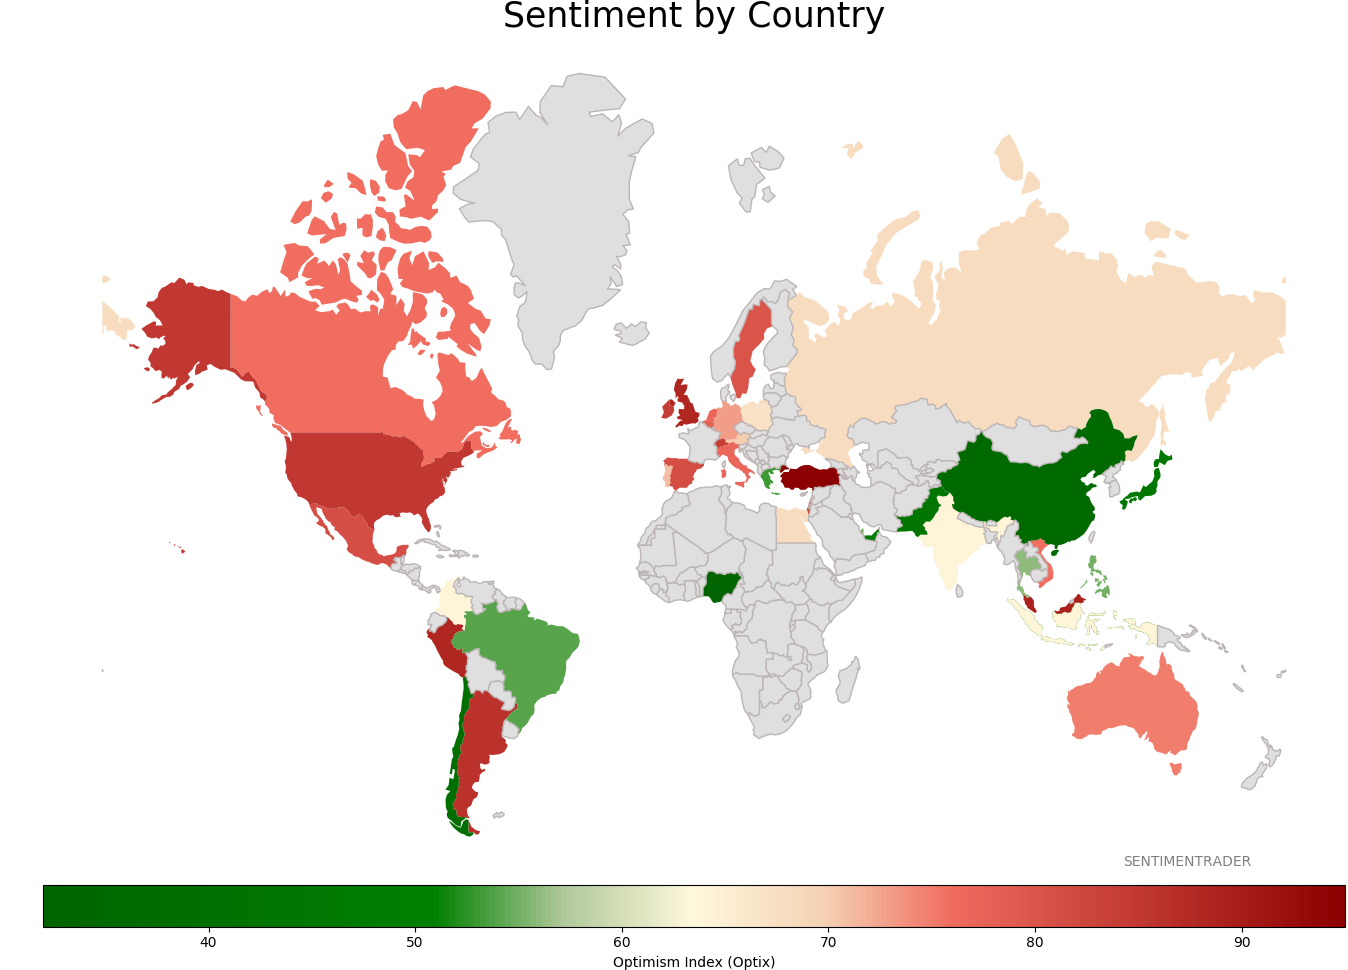
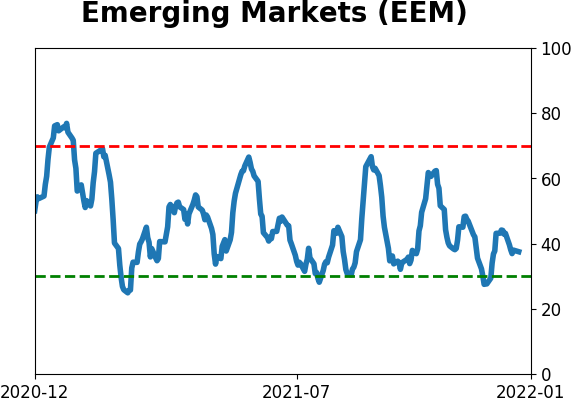
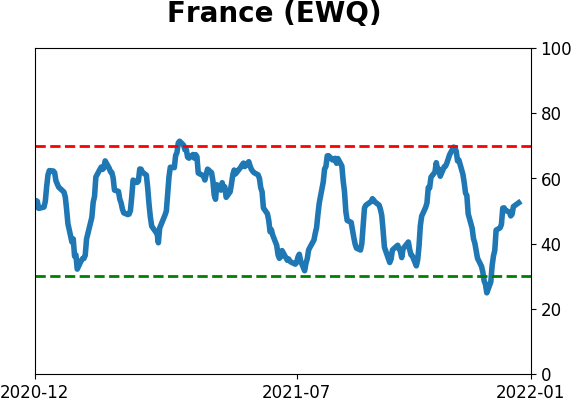
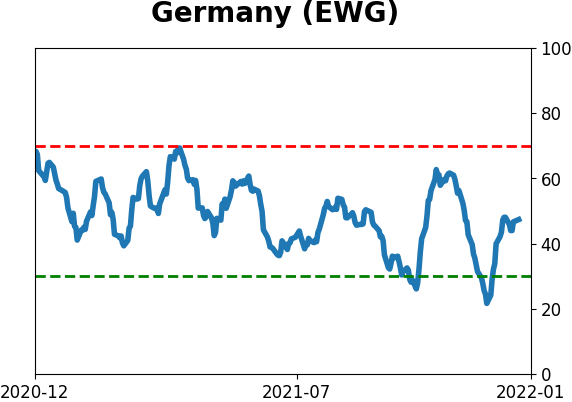
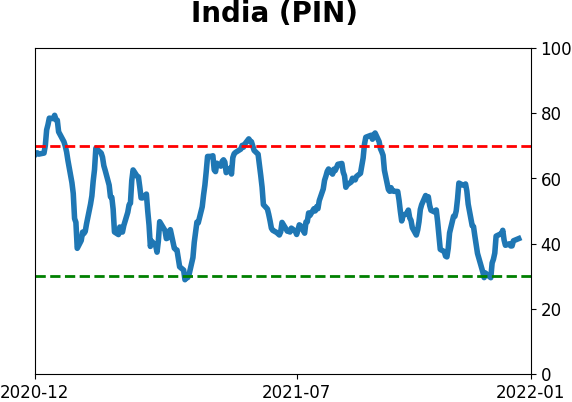
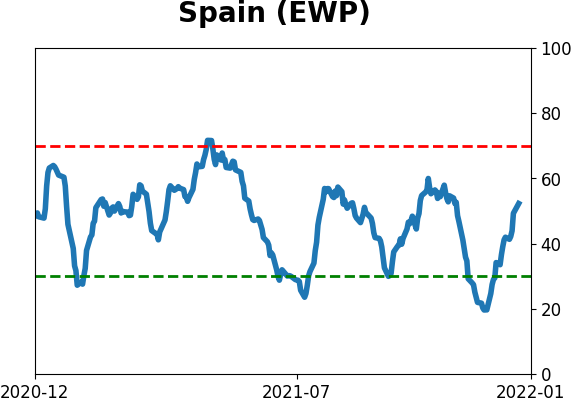
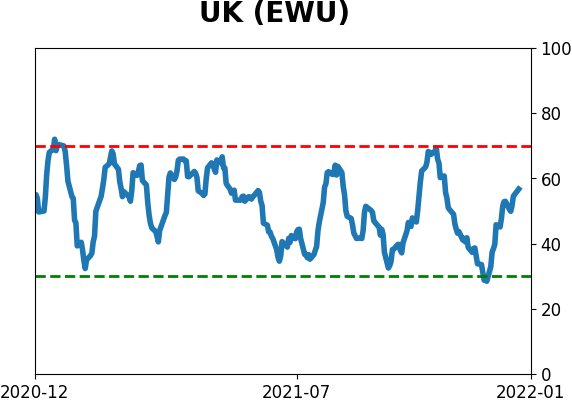
Sentiment Around The World
Optimism Index Thumbnails
|
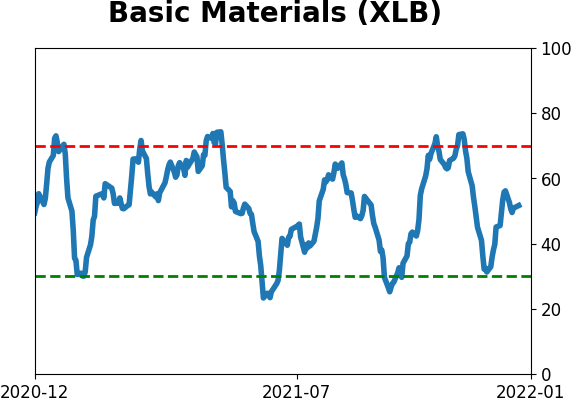
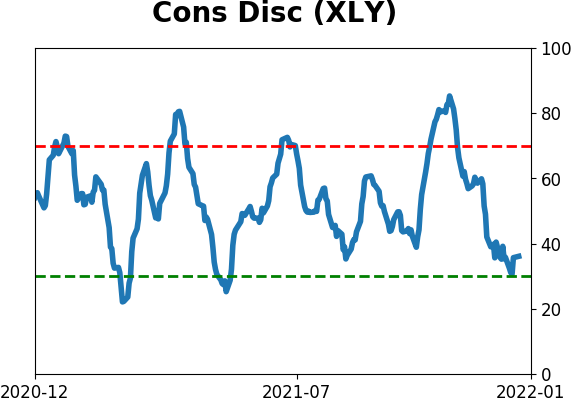
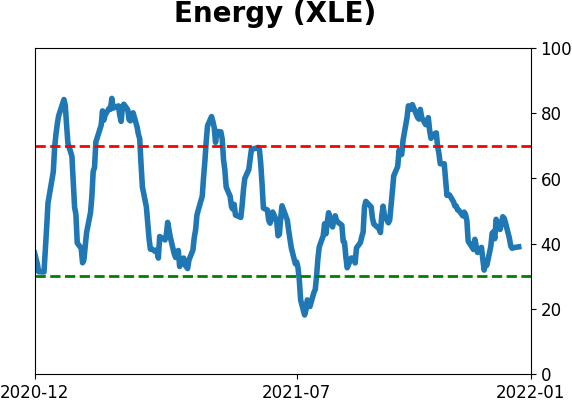
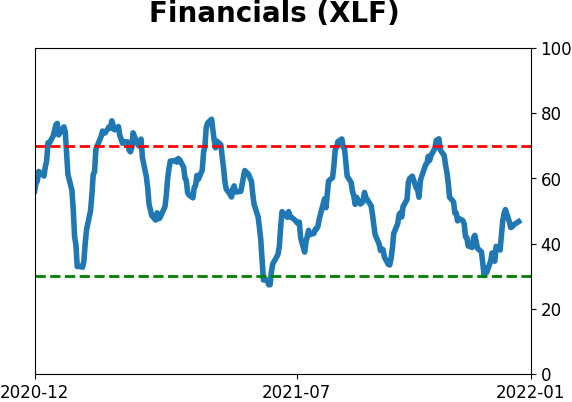
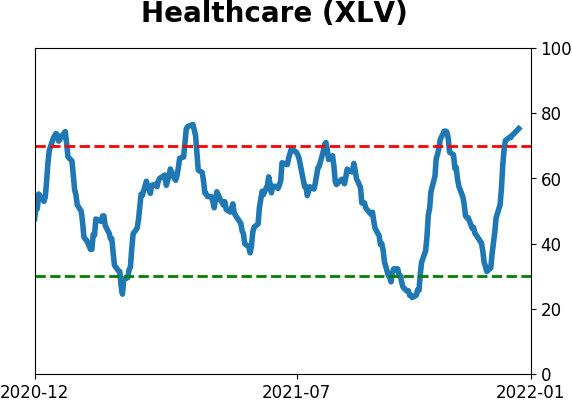
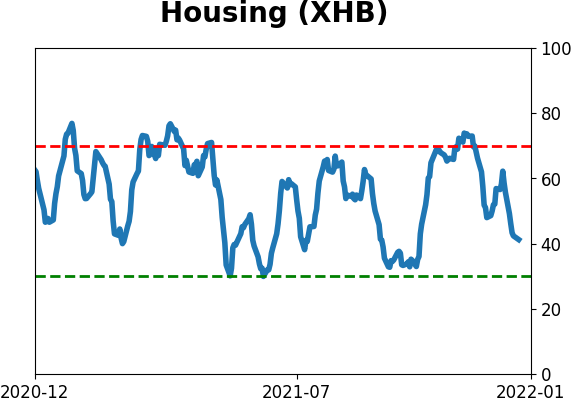
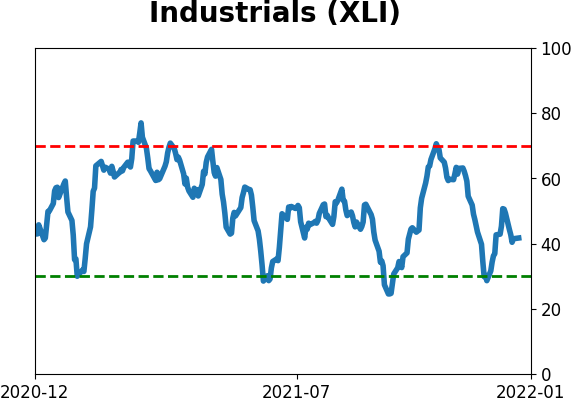
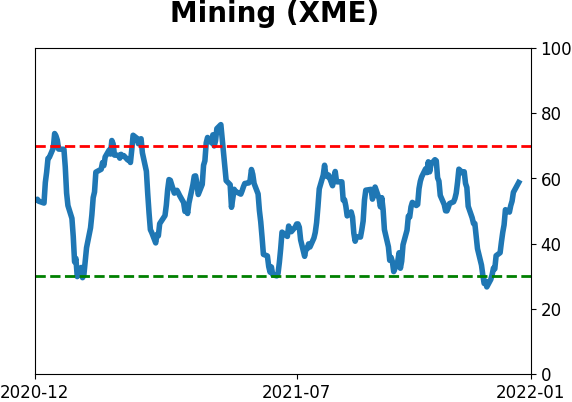
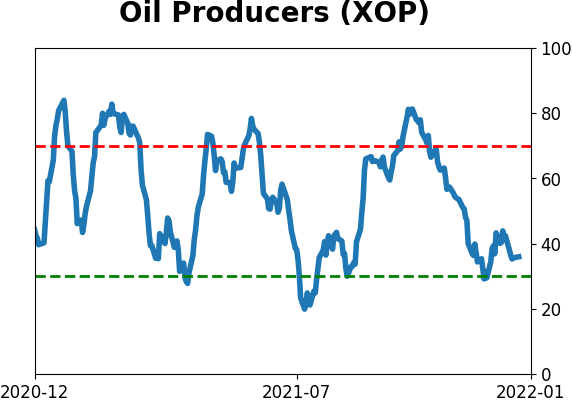
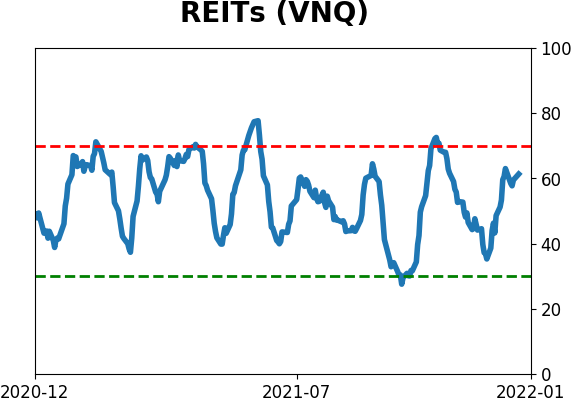
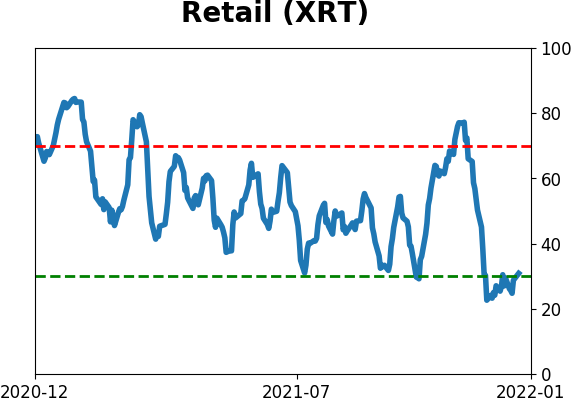
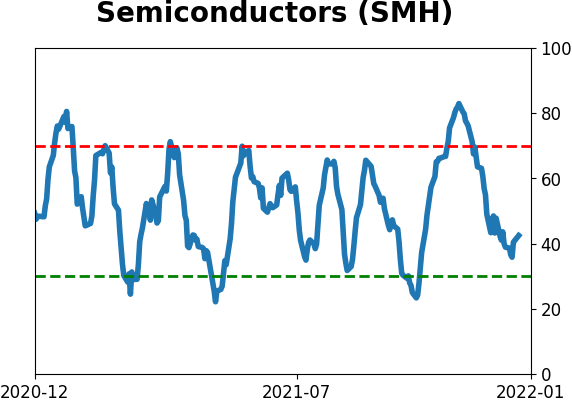
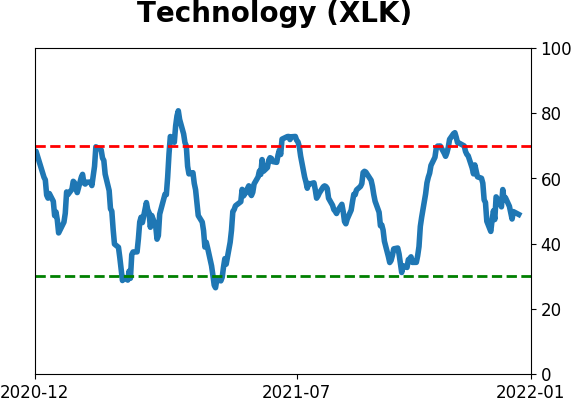
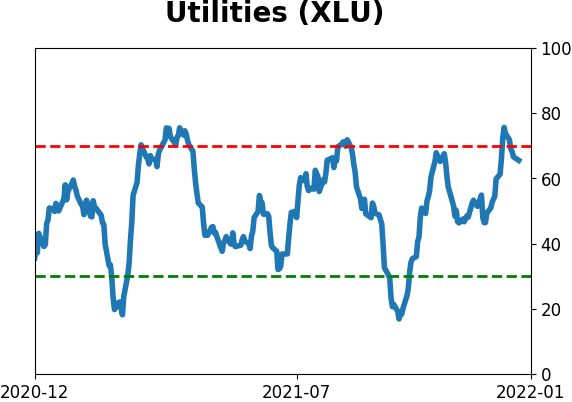
Sector ETF's - 10-Day Moving Average
|
|
|
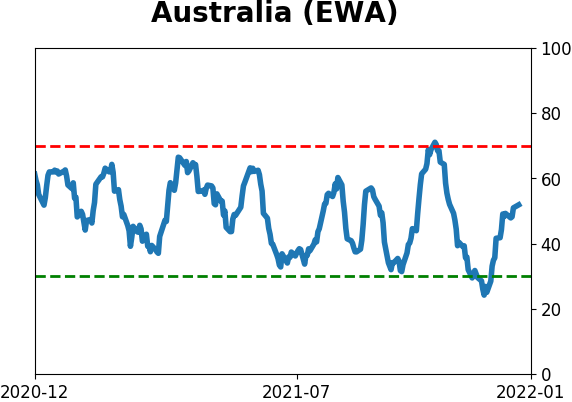
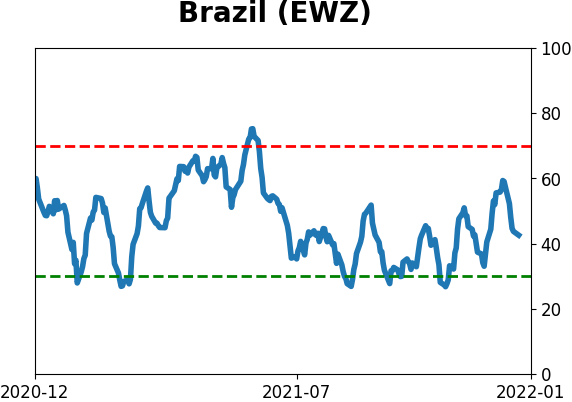
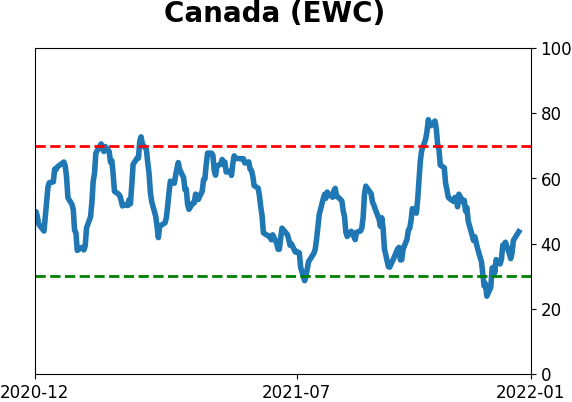
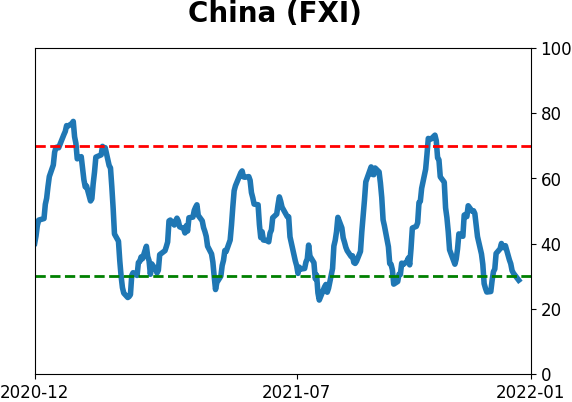
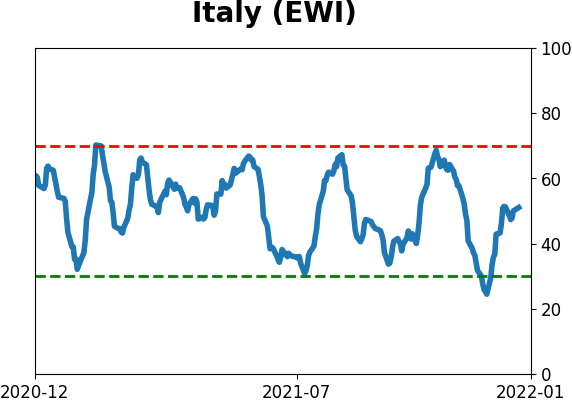
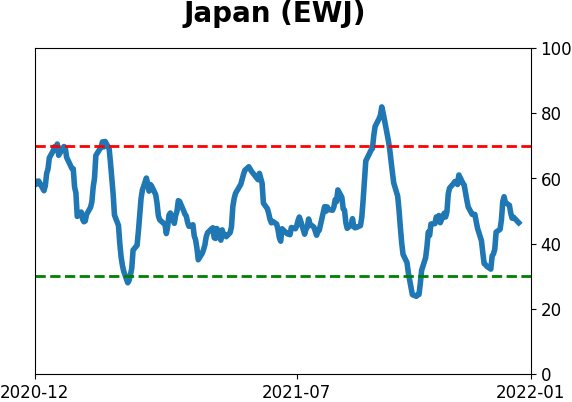
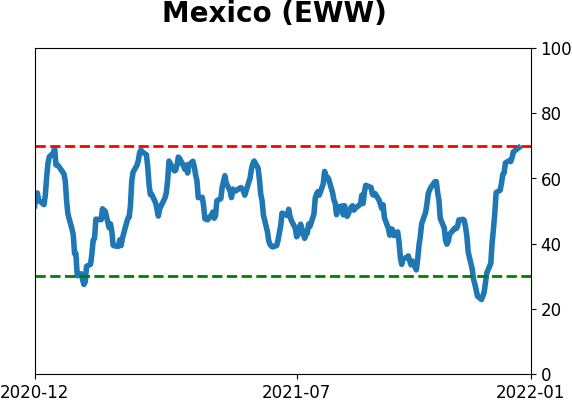
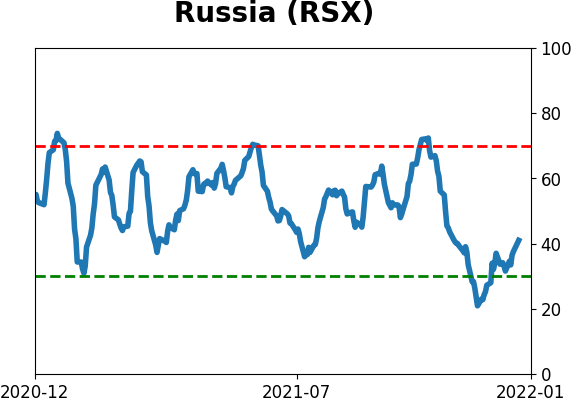
Country ETF's - 10-Day Moving Average
|
|
|
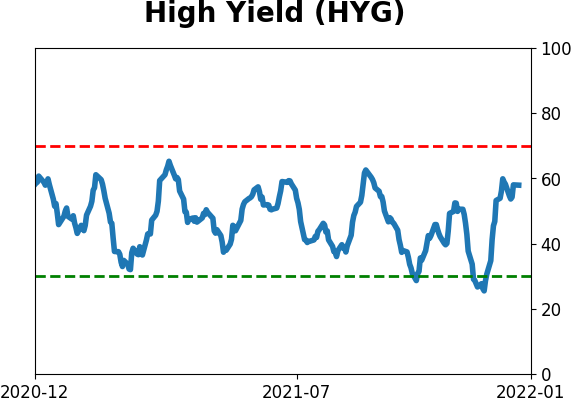
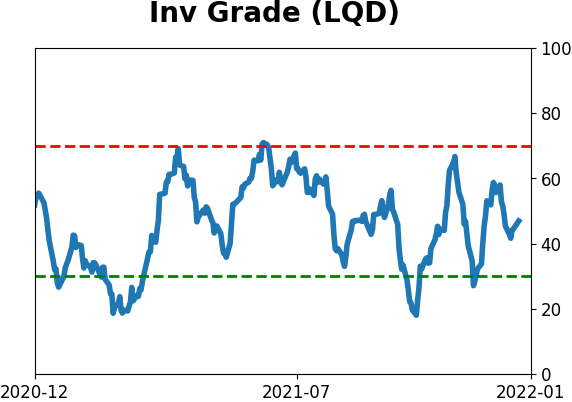
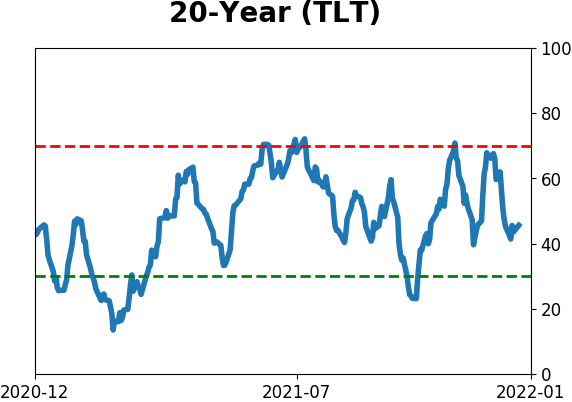
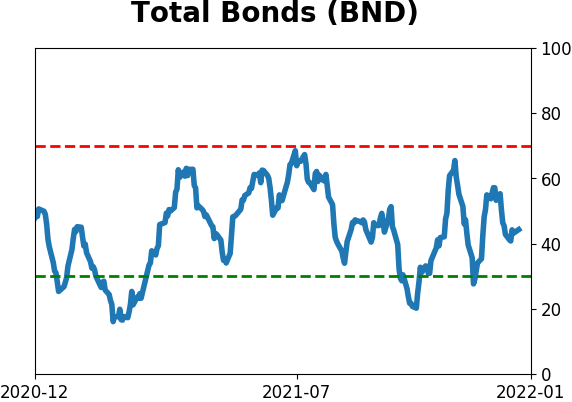
Bond ETF's - 10-Day Moving Average
|
|
|
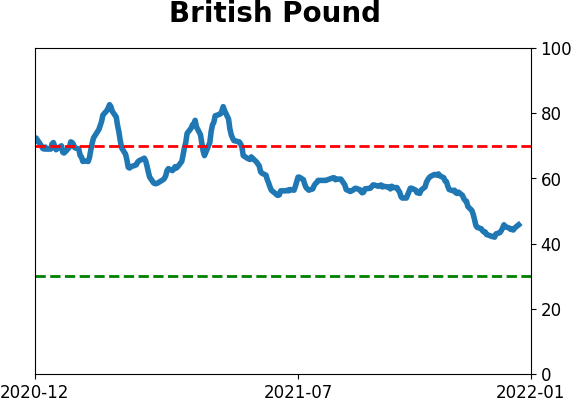
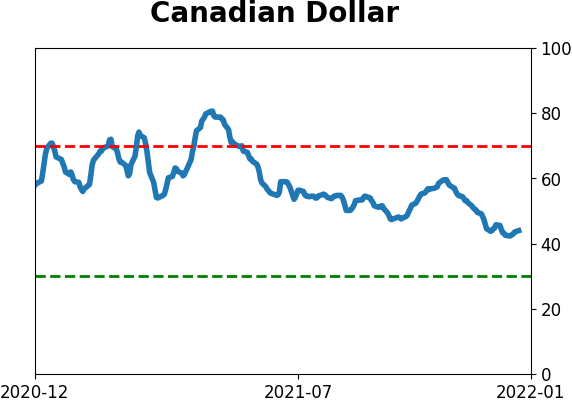
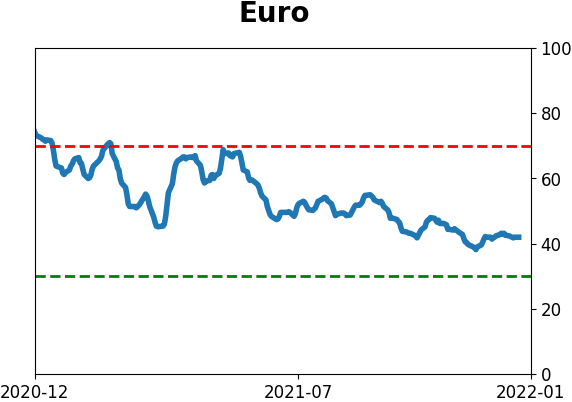
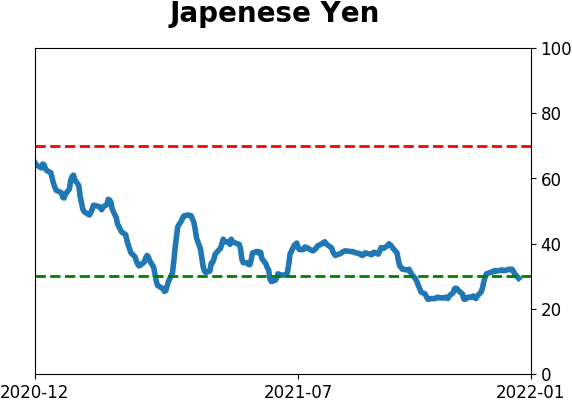
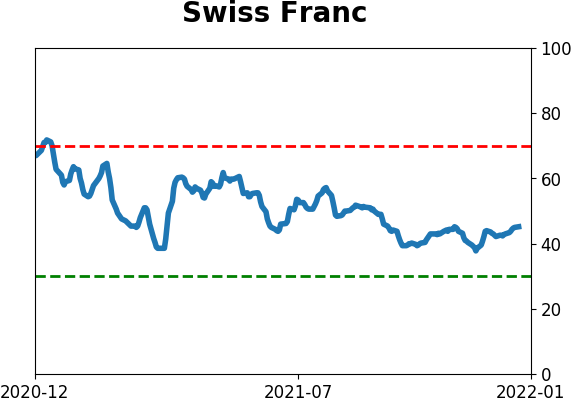
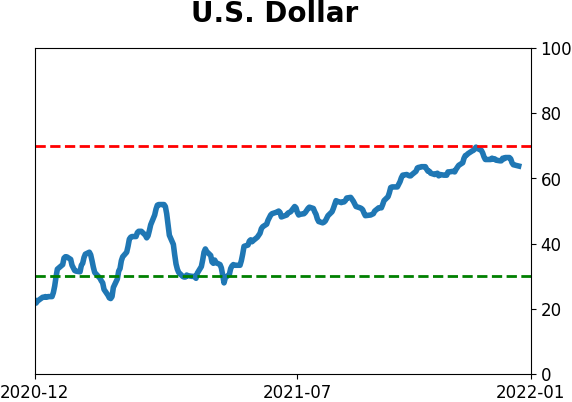
Currency ETF's - 5-Day Moving Average
|
|
|
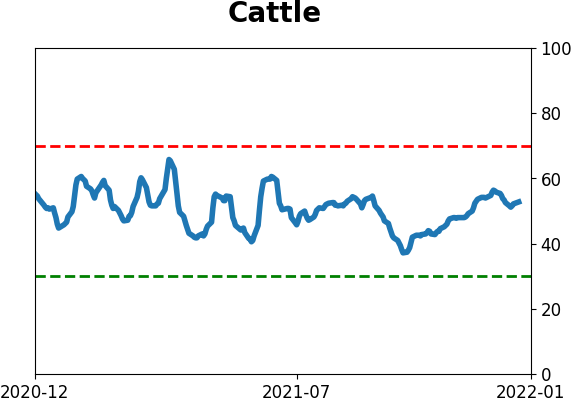
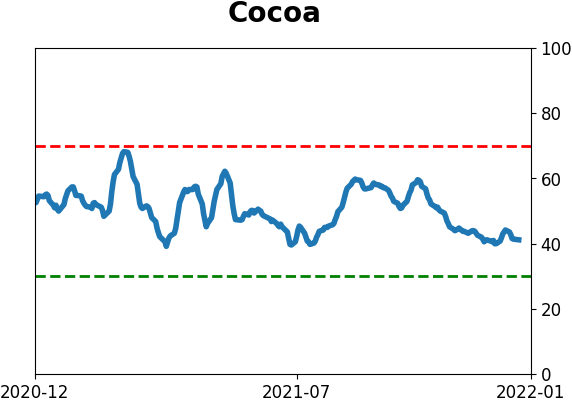
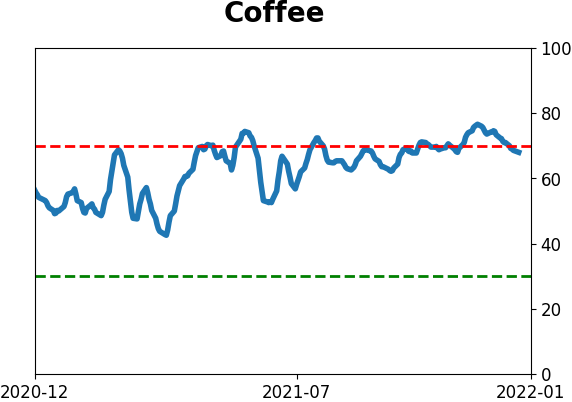
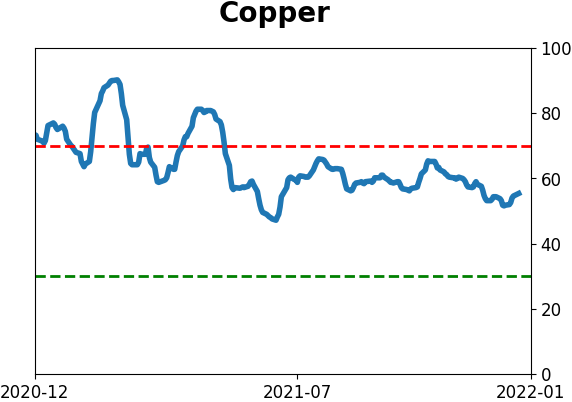
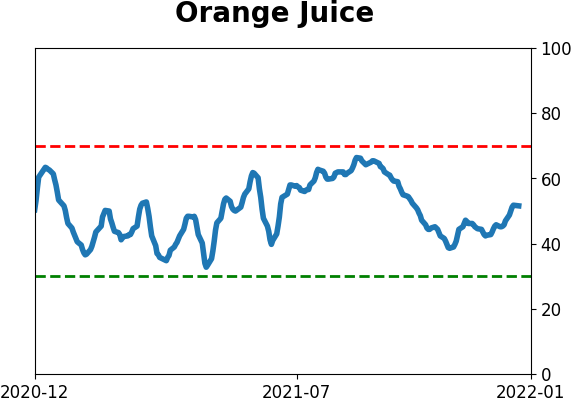
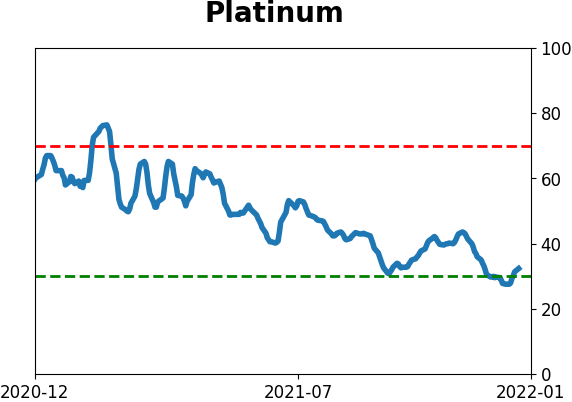
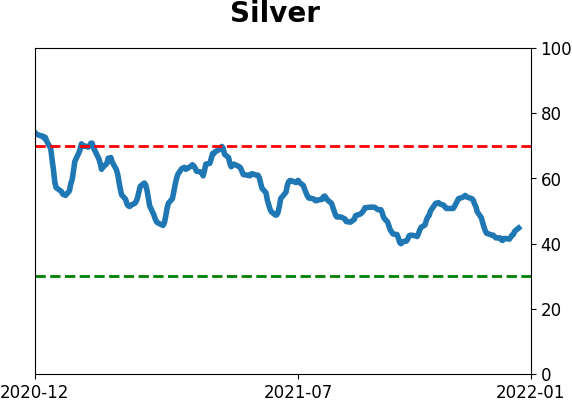
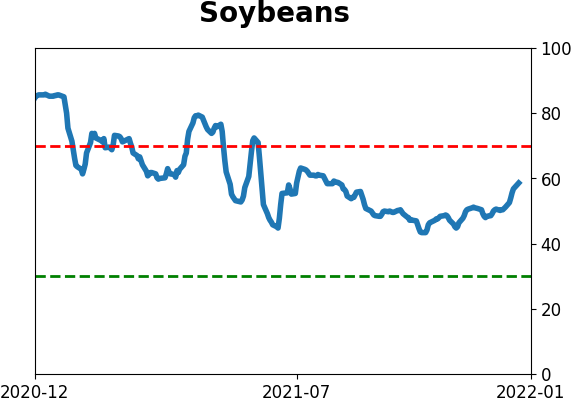
Commodity ETF's - 5-Day Moving Average
|
|