Headlines
|
|
The DAX gives the Dow a run for its money:
The German DAX index has been propelled by excellent internal participation. The McClellan Summation Index for the DAX has moved to a multi-year high, and other breadth metrics indicate there is "reverse panic" in these stocks. That has been an excellent sign for further long-term gains, even for U.S.-based investors.
|
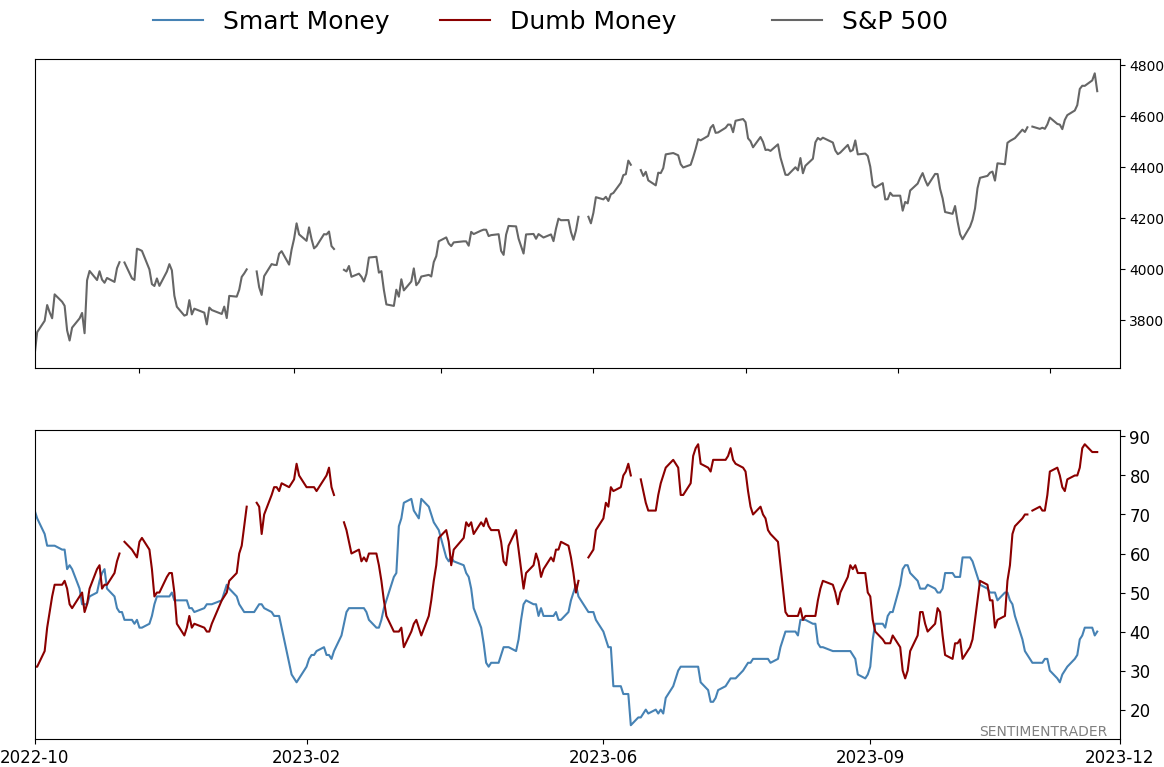
Smart / Dumb Money Confidence
|
Smart Money Confidence: 40%
Dumb Money Confidence: 86%
|
|
Risk Levels
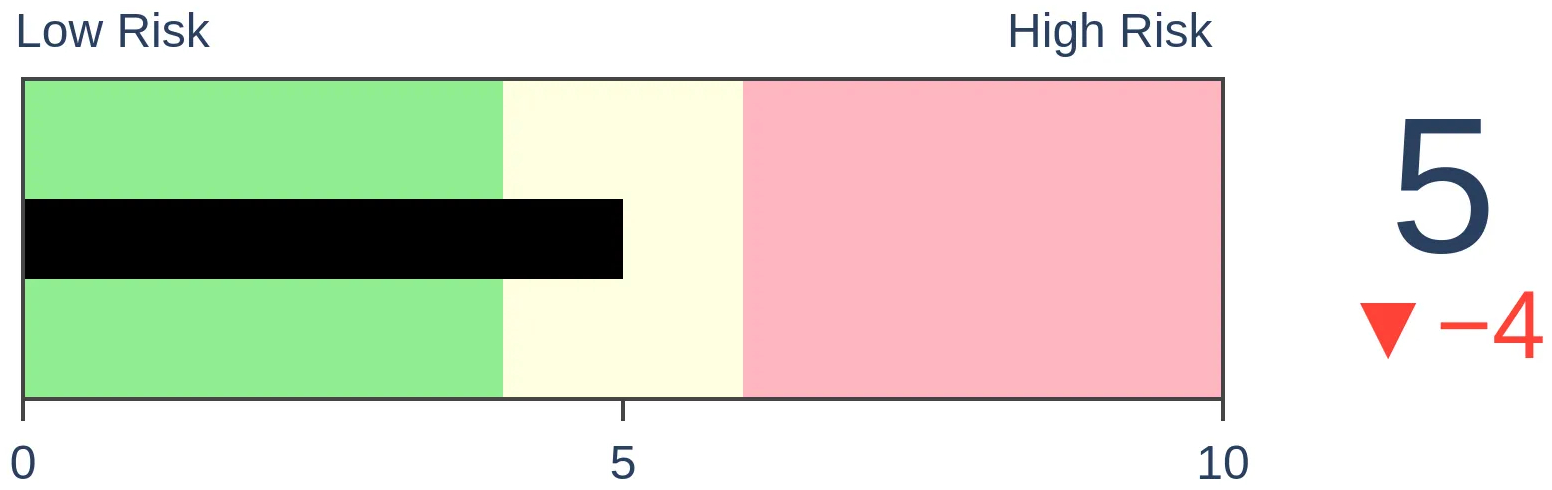
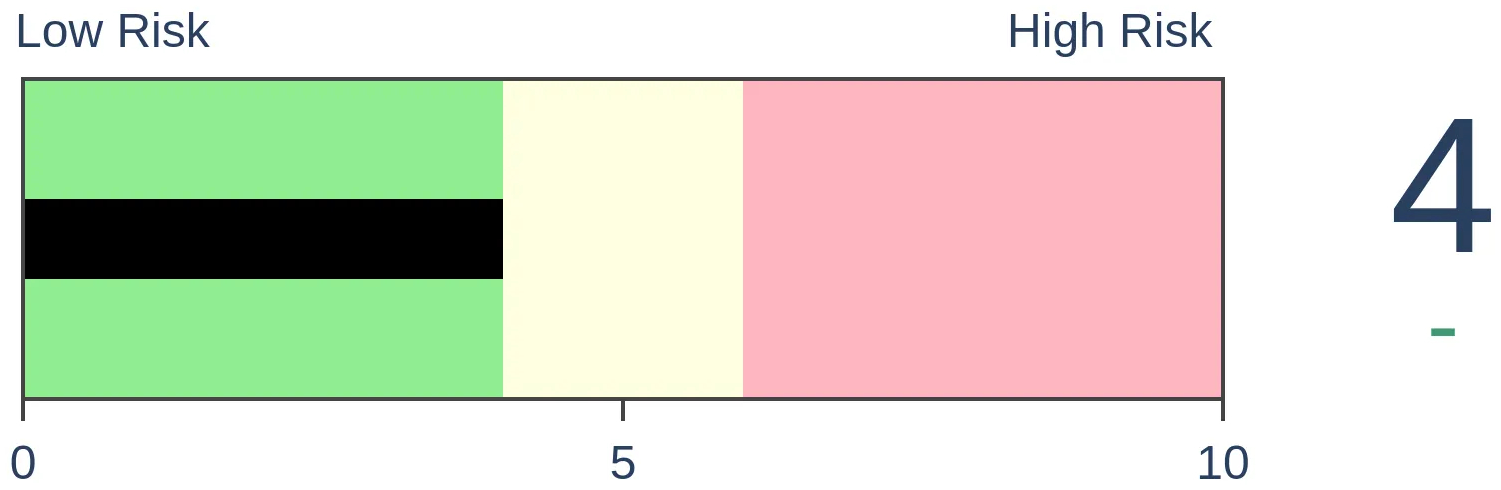
Stocks Short-Term
|
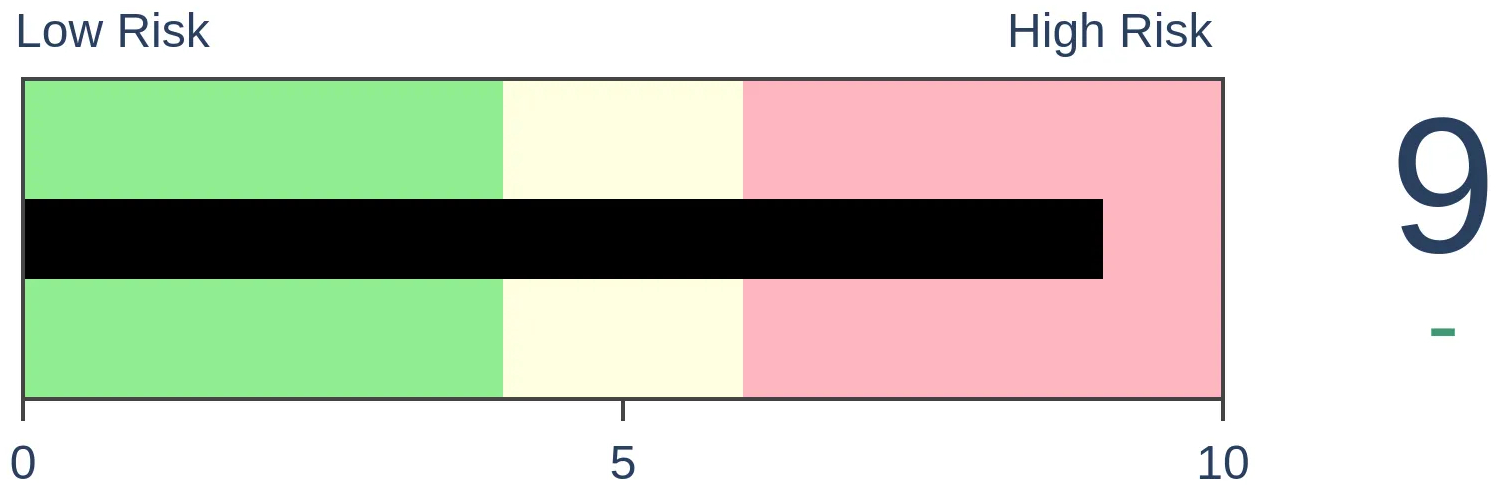
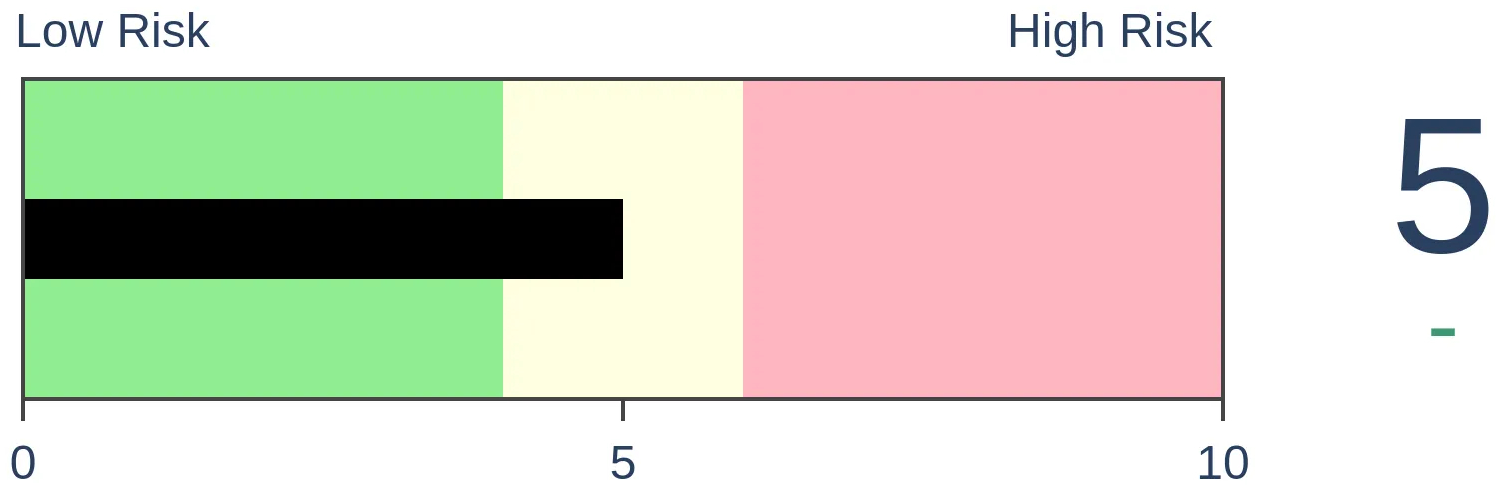
Stocks Medium-Term
|
|
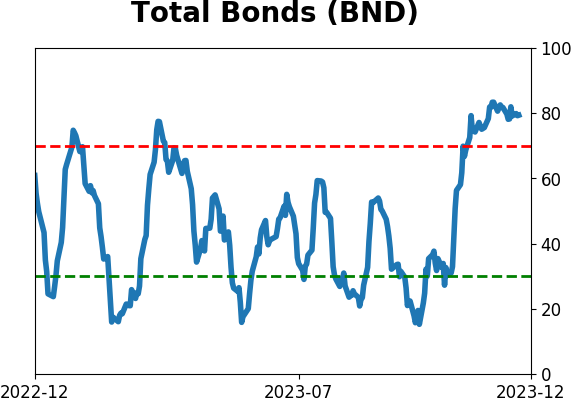
Bonds

|
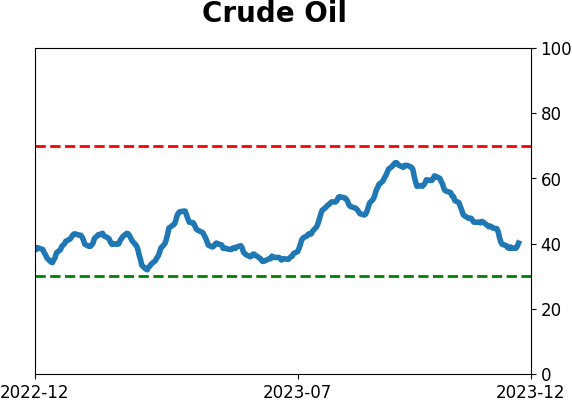
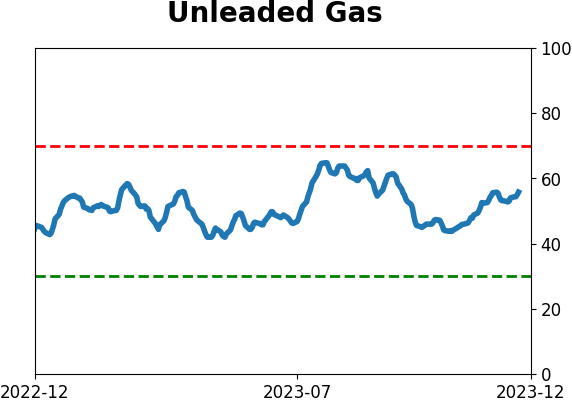
Crude Oil

|
|
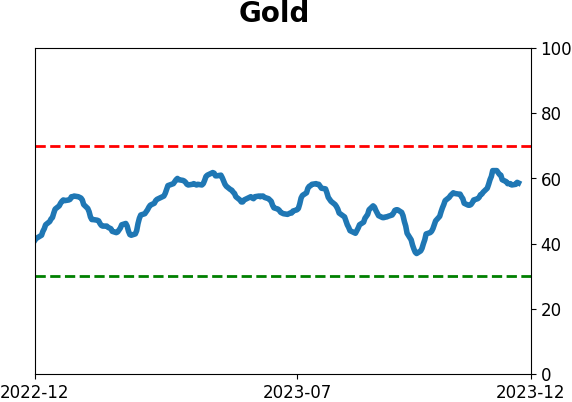
Gold
|
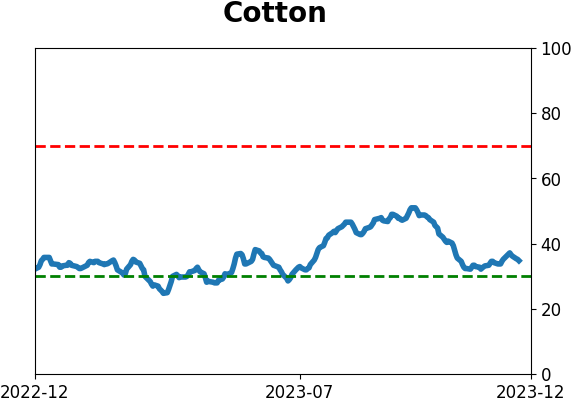
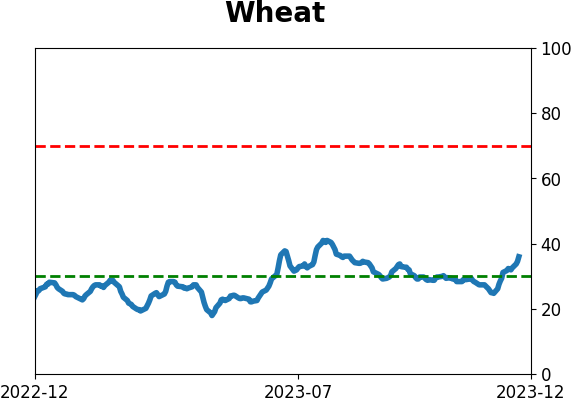
Agriculture
|
|
Research
By Jason Goepfert
BOTTOM LINE
The German DAX index has been propelled by excellent internal participation. The McClellan Summation Index for the DAX has moved to a multi-year high, and other breadth metrics indicate there is "reverse panic" in these stocks. That has been an excellent sign for further long-term gains, even for U.S.-based investors.
FORECAST / TIMEFRAME
None
|
Key points:
- Stocks in the German DAX have enjoyed an impressive rally over the past couple of weeks
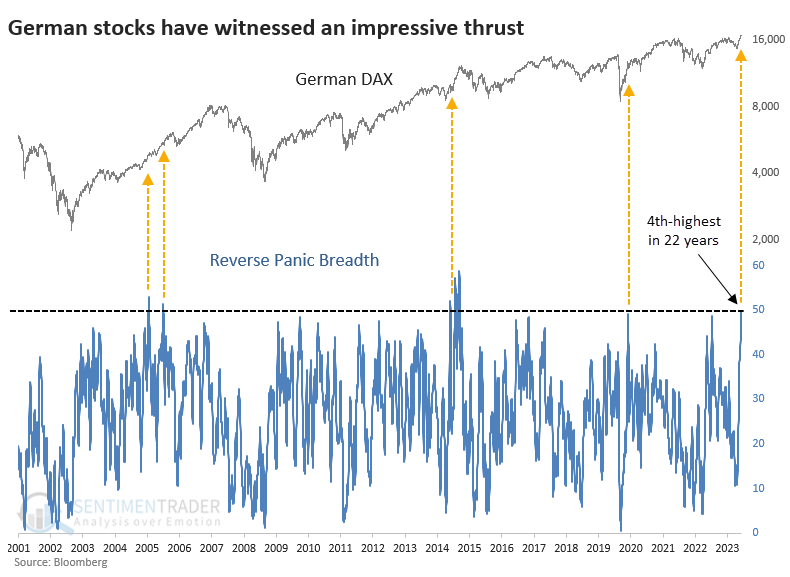
- The Summation Index for that index has surged to the 4th-highest level in nearly 30 years
- Big jumps in other breadth metrics have triggered a "reverse panic breadth" signal, a consistent long-term positive sign
Das Boost
We've spent a lot of time over the past couple of weeks documenting the impressive recovery across markets. It has been broad-based and persistent, which are hallmarks of lasting rallies.
Among the most impressive performers have been non-U.S. stocks, which is a change. Indexes in many developed markets have been reaching new highs, but even more notable is that the underlying participation in those indexes has been excellent.
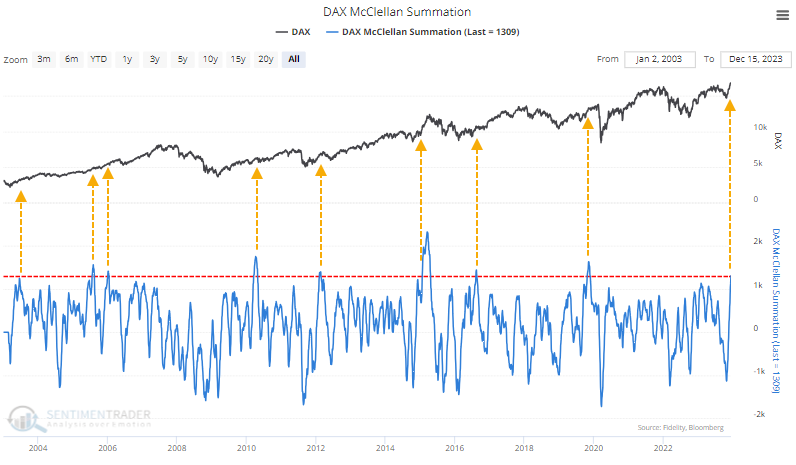
Take the German DAX, for example. The Teutonic version of the Dow Jones Industrial Average recently soared to new highs, and it hasn't just been seven stocks propelling the gains; the McClellan Summation Index for the DAX has jumped to its highest level in four years. This is similar behavior to what we're seeing in the Dow Industrials.
We touched on this indicator in June 2020 as part of a broad recovery across markets, which had reliably preceded sustained gains, and which did so once again.
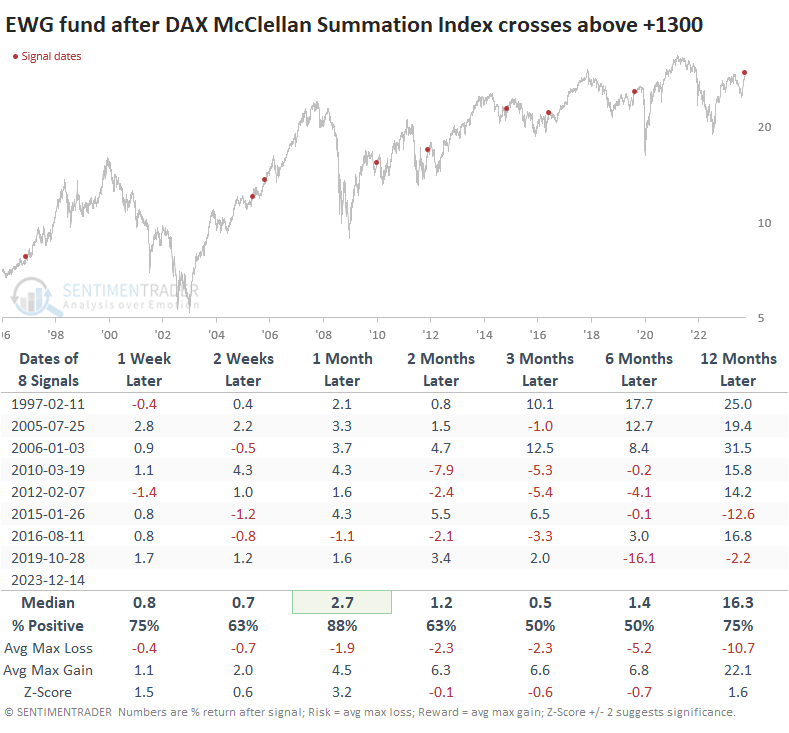
The table below shows every time in the past 27 years when the Summation Index for the DAX climbed above +1300, a lofty level that requires many stocks to rise over a long period.
Returns in the index were pretty good, mostly above average, and with an excellent risk-to-reward ratio, but some losses were scattered among the time frames. The pandemic interrupted what would have been a perfect record of gains in the six months following these signals.
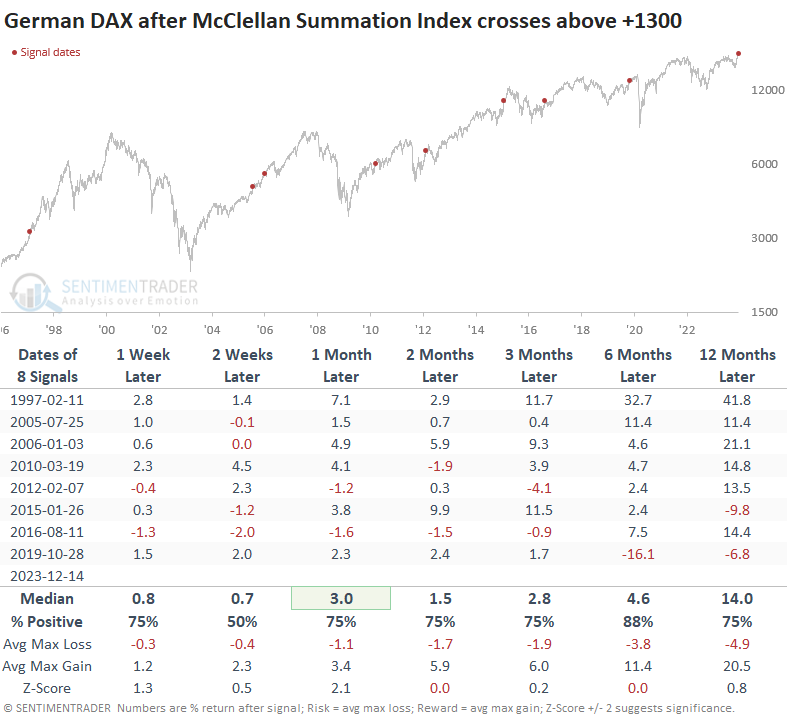
The EWG fund is the closest, most liquid, investible product for U.S. investors. Over the next month, EWG rallied every time but once, then gave back those gains several times. Currency fluctuations substantially hurt returns over the next 3-6 months.
The reverse of "panic breadth"
The Summation Index is an excellent representation of long-term internal participation in an index. But other breadth metrics help flesh out the short- and medium-term behavior of stocks underlying an index or sector.
We've looked at a Panic Breadth composite many times, and sometimes, its opposite. The Reverse Panic Breadth indicator monitors a half-dozen indicators of breadth, and over the past ten days, it has reached an extreme for the DAX. This composite just jumped to its 4th-highest level in 22 years.
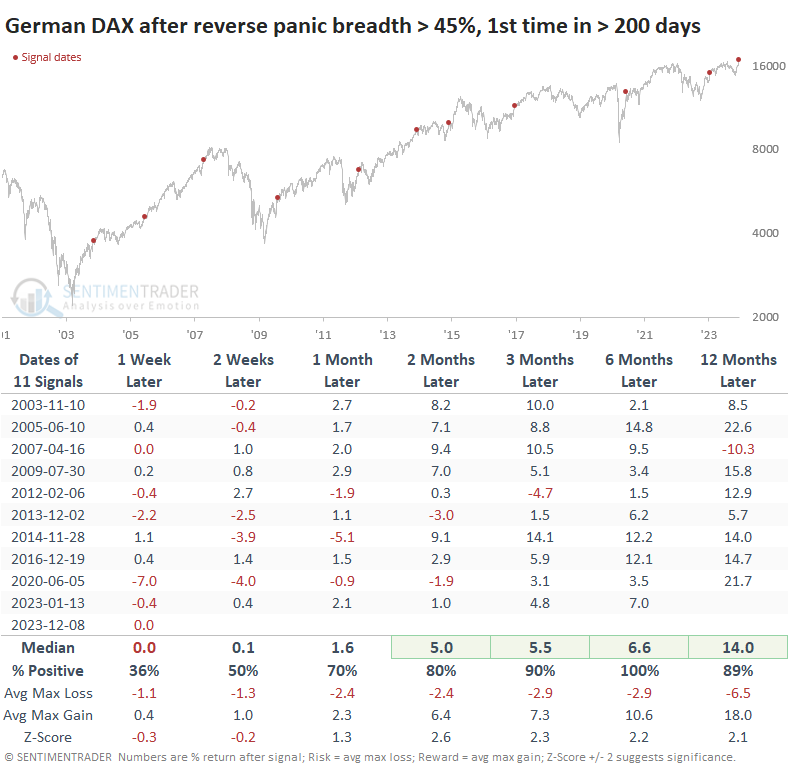
If we relax the parameters, we can get a larger sample size. The table below shows other times when the composite exceeded 45%, which has triggered 11 times since 2001. Notably, the German DAX index added to its gains over the next six months every time, averaging +6.6%.
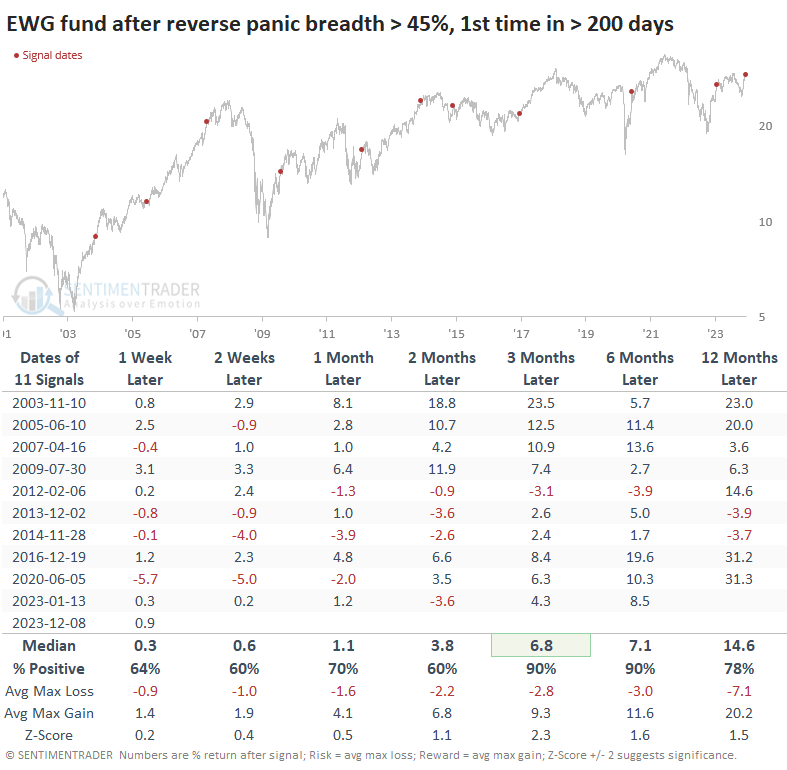
Because of currency fluctuations, returns for U.S.-based investors in the EWG fund were somewhat different, but not necessarily for the worse. The fund showed one loss over the next six months, but median returns from 3-12 months later were higher than for the DAX in euros.
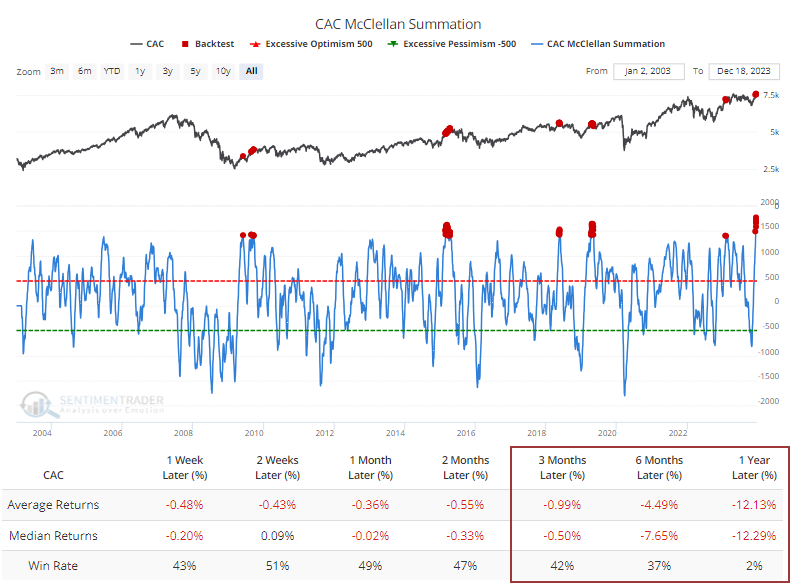
Another primary euro-area index, the French CAC, has also seen its McClellan Summation Index reach an impressive high - a record one, in fact. But unlike the DAX, the French index has shown a strong tendency to surrender (no comment).
What the research tells us...
After big surges in indexes and their underlying stocks, there is a natural inclination to think about overbought conditions. While it might be natural, it's not the most likely outcome except maybe on a very short time frame. Usually, when we see behavior like we have over the last couple of weeks, indexes like the DAX attract more and more buyers willing to take higher and higher offers.
Internal momentum, as the DAX has witnessed recently, has been an excellent sign that those buyers are here and willing. Similar behavior has preceded further gains over the next six months or so with impressive consistency.
Indicators at Extremes
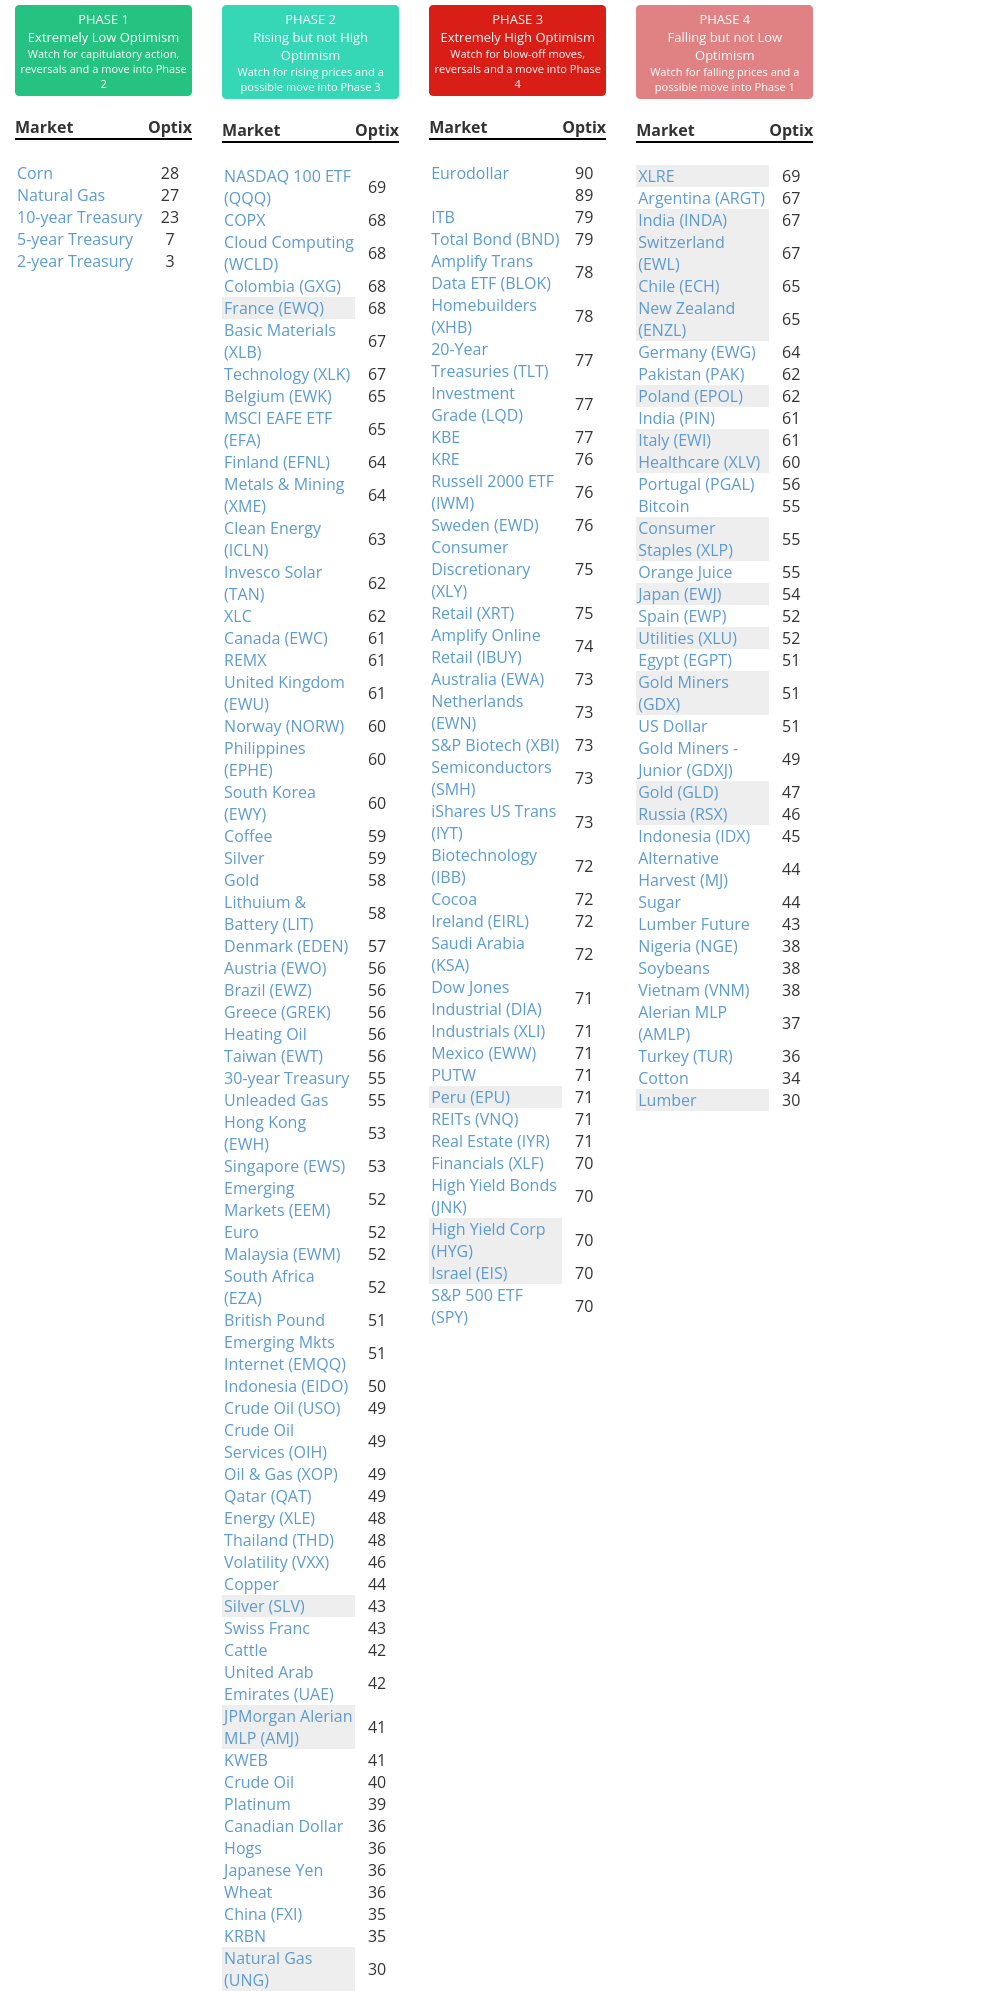
Phase Table
Ranks
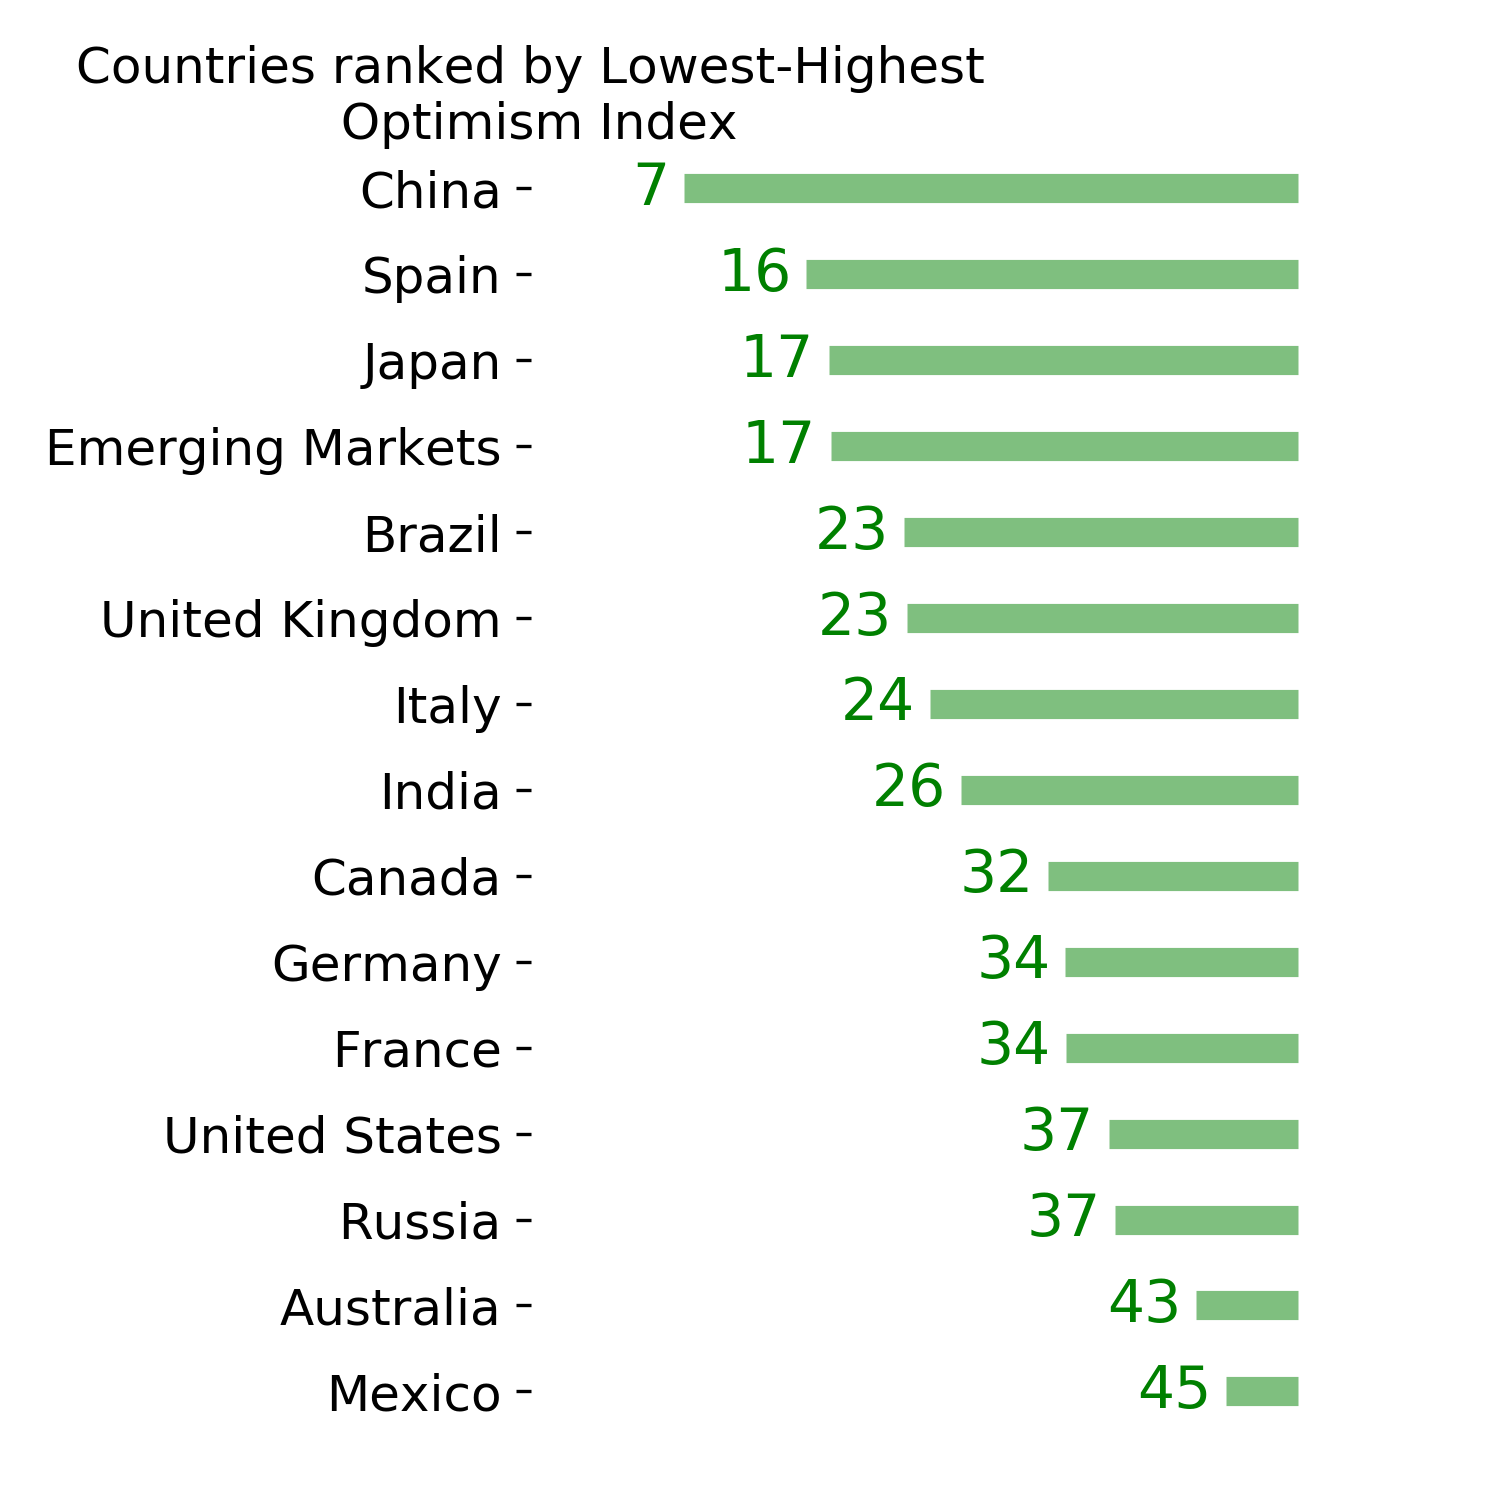
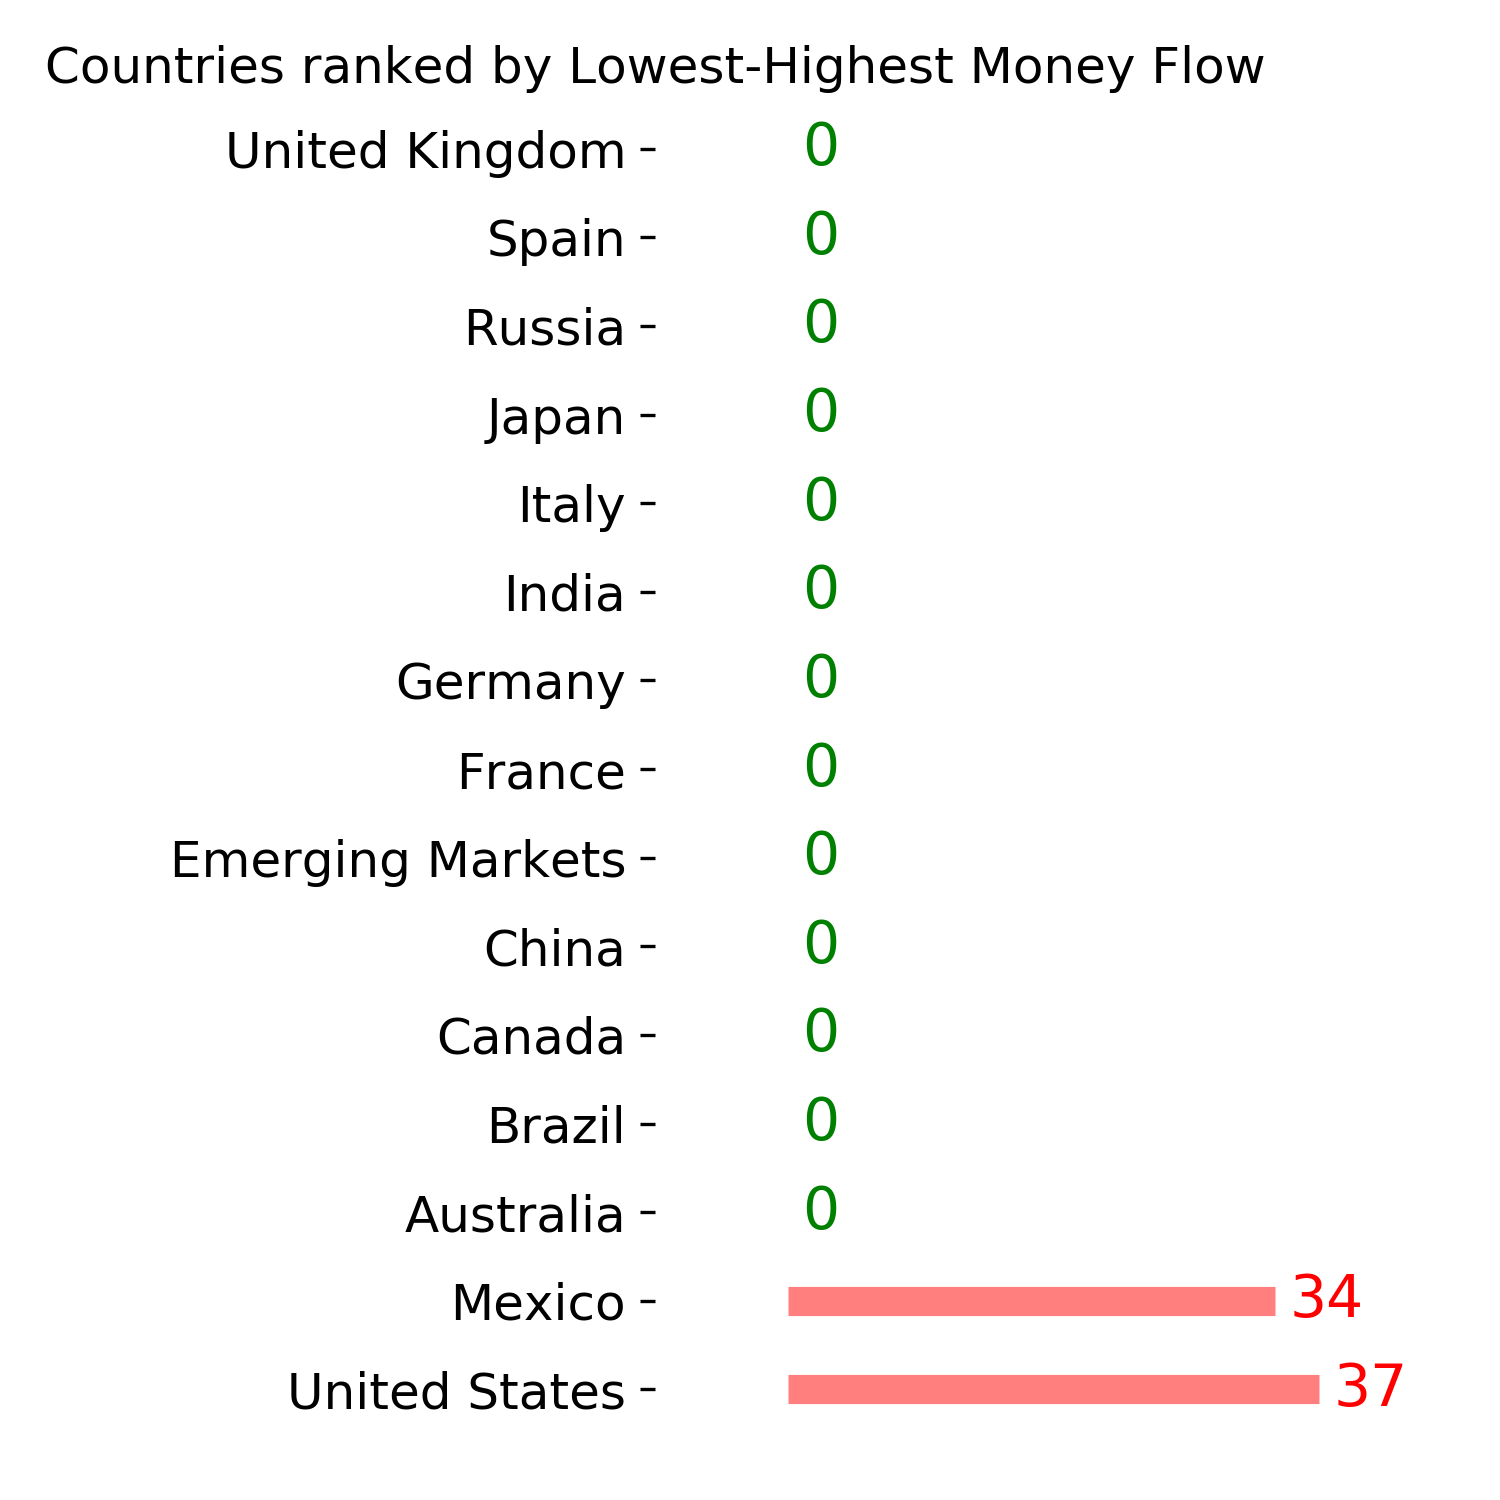
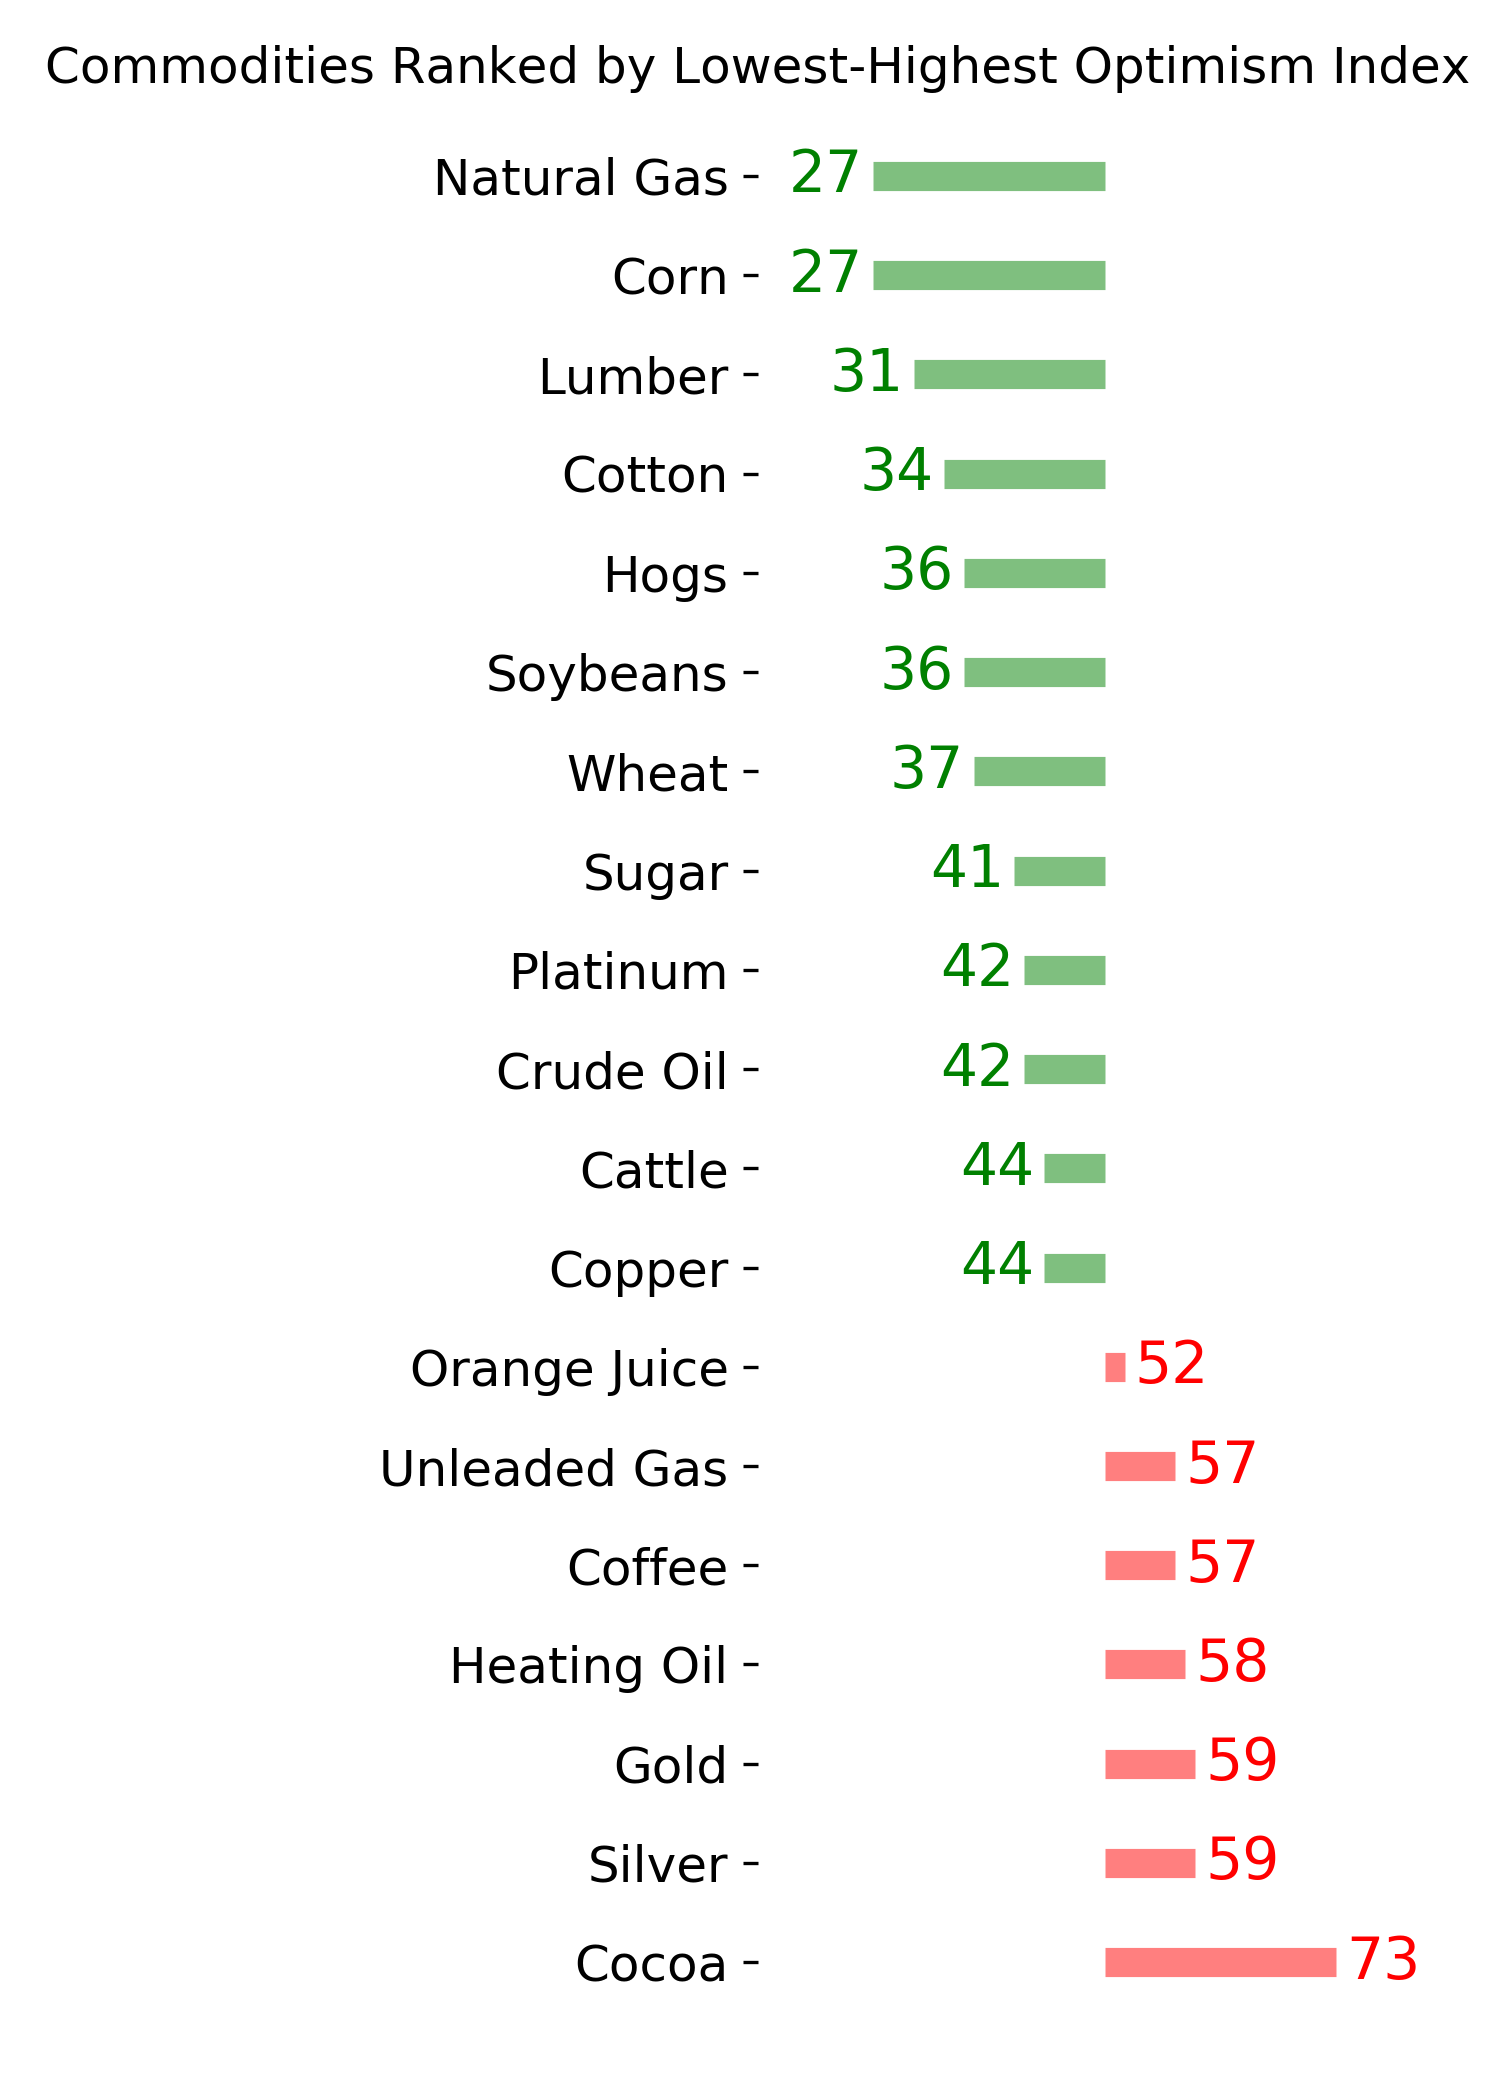
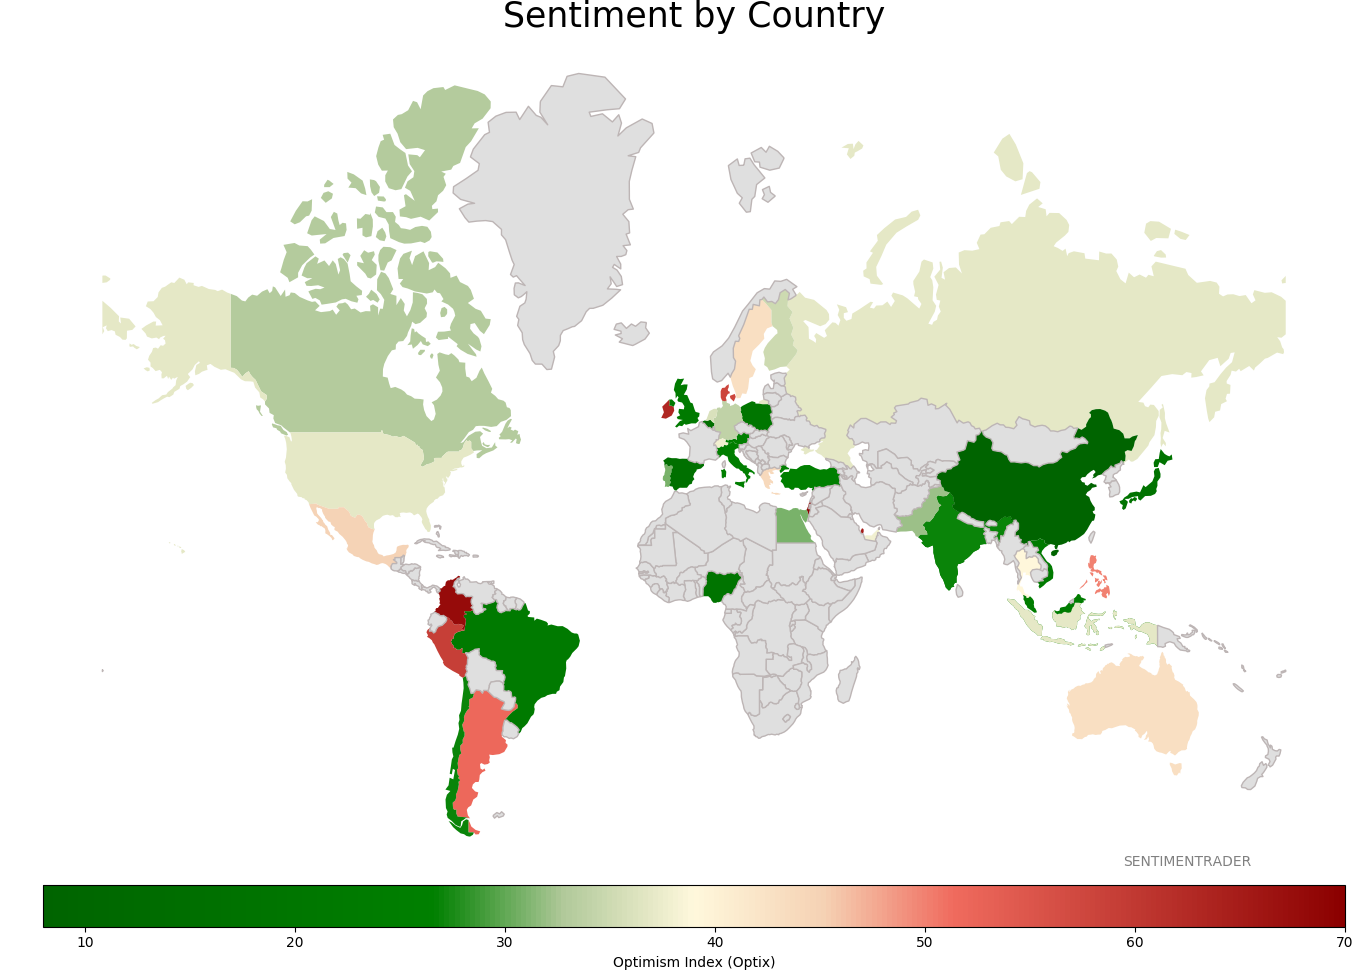
Sentiment Around The World
Optimism Index Thumbnails
|
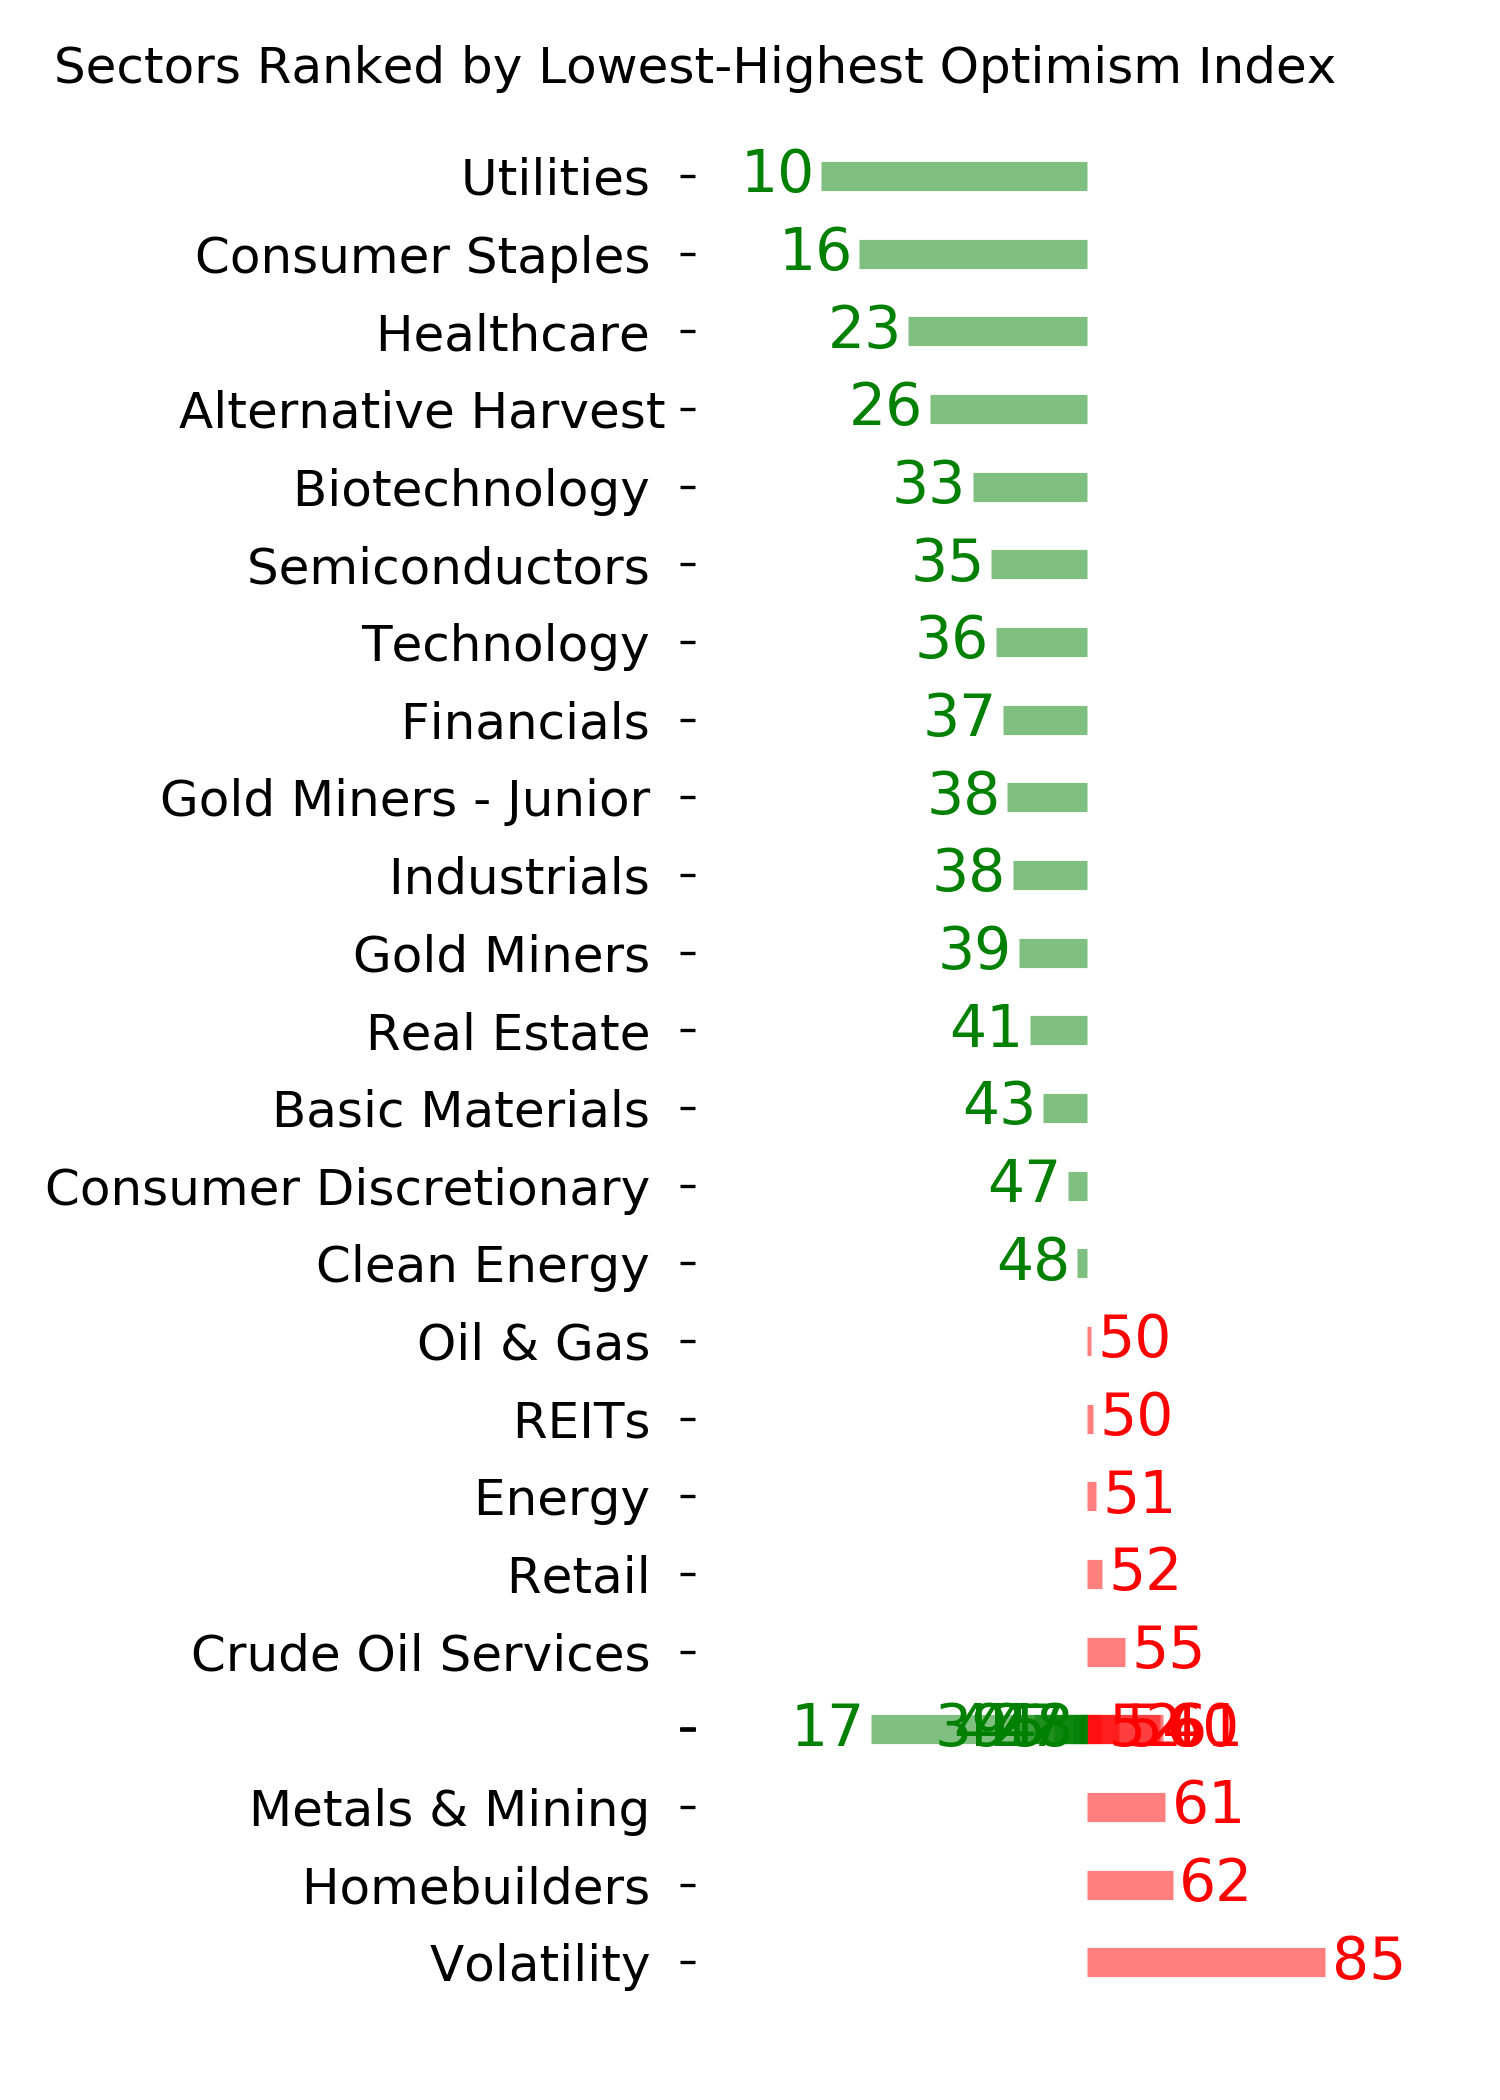
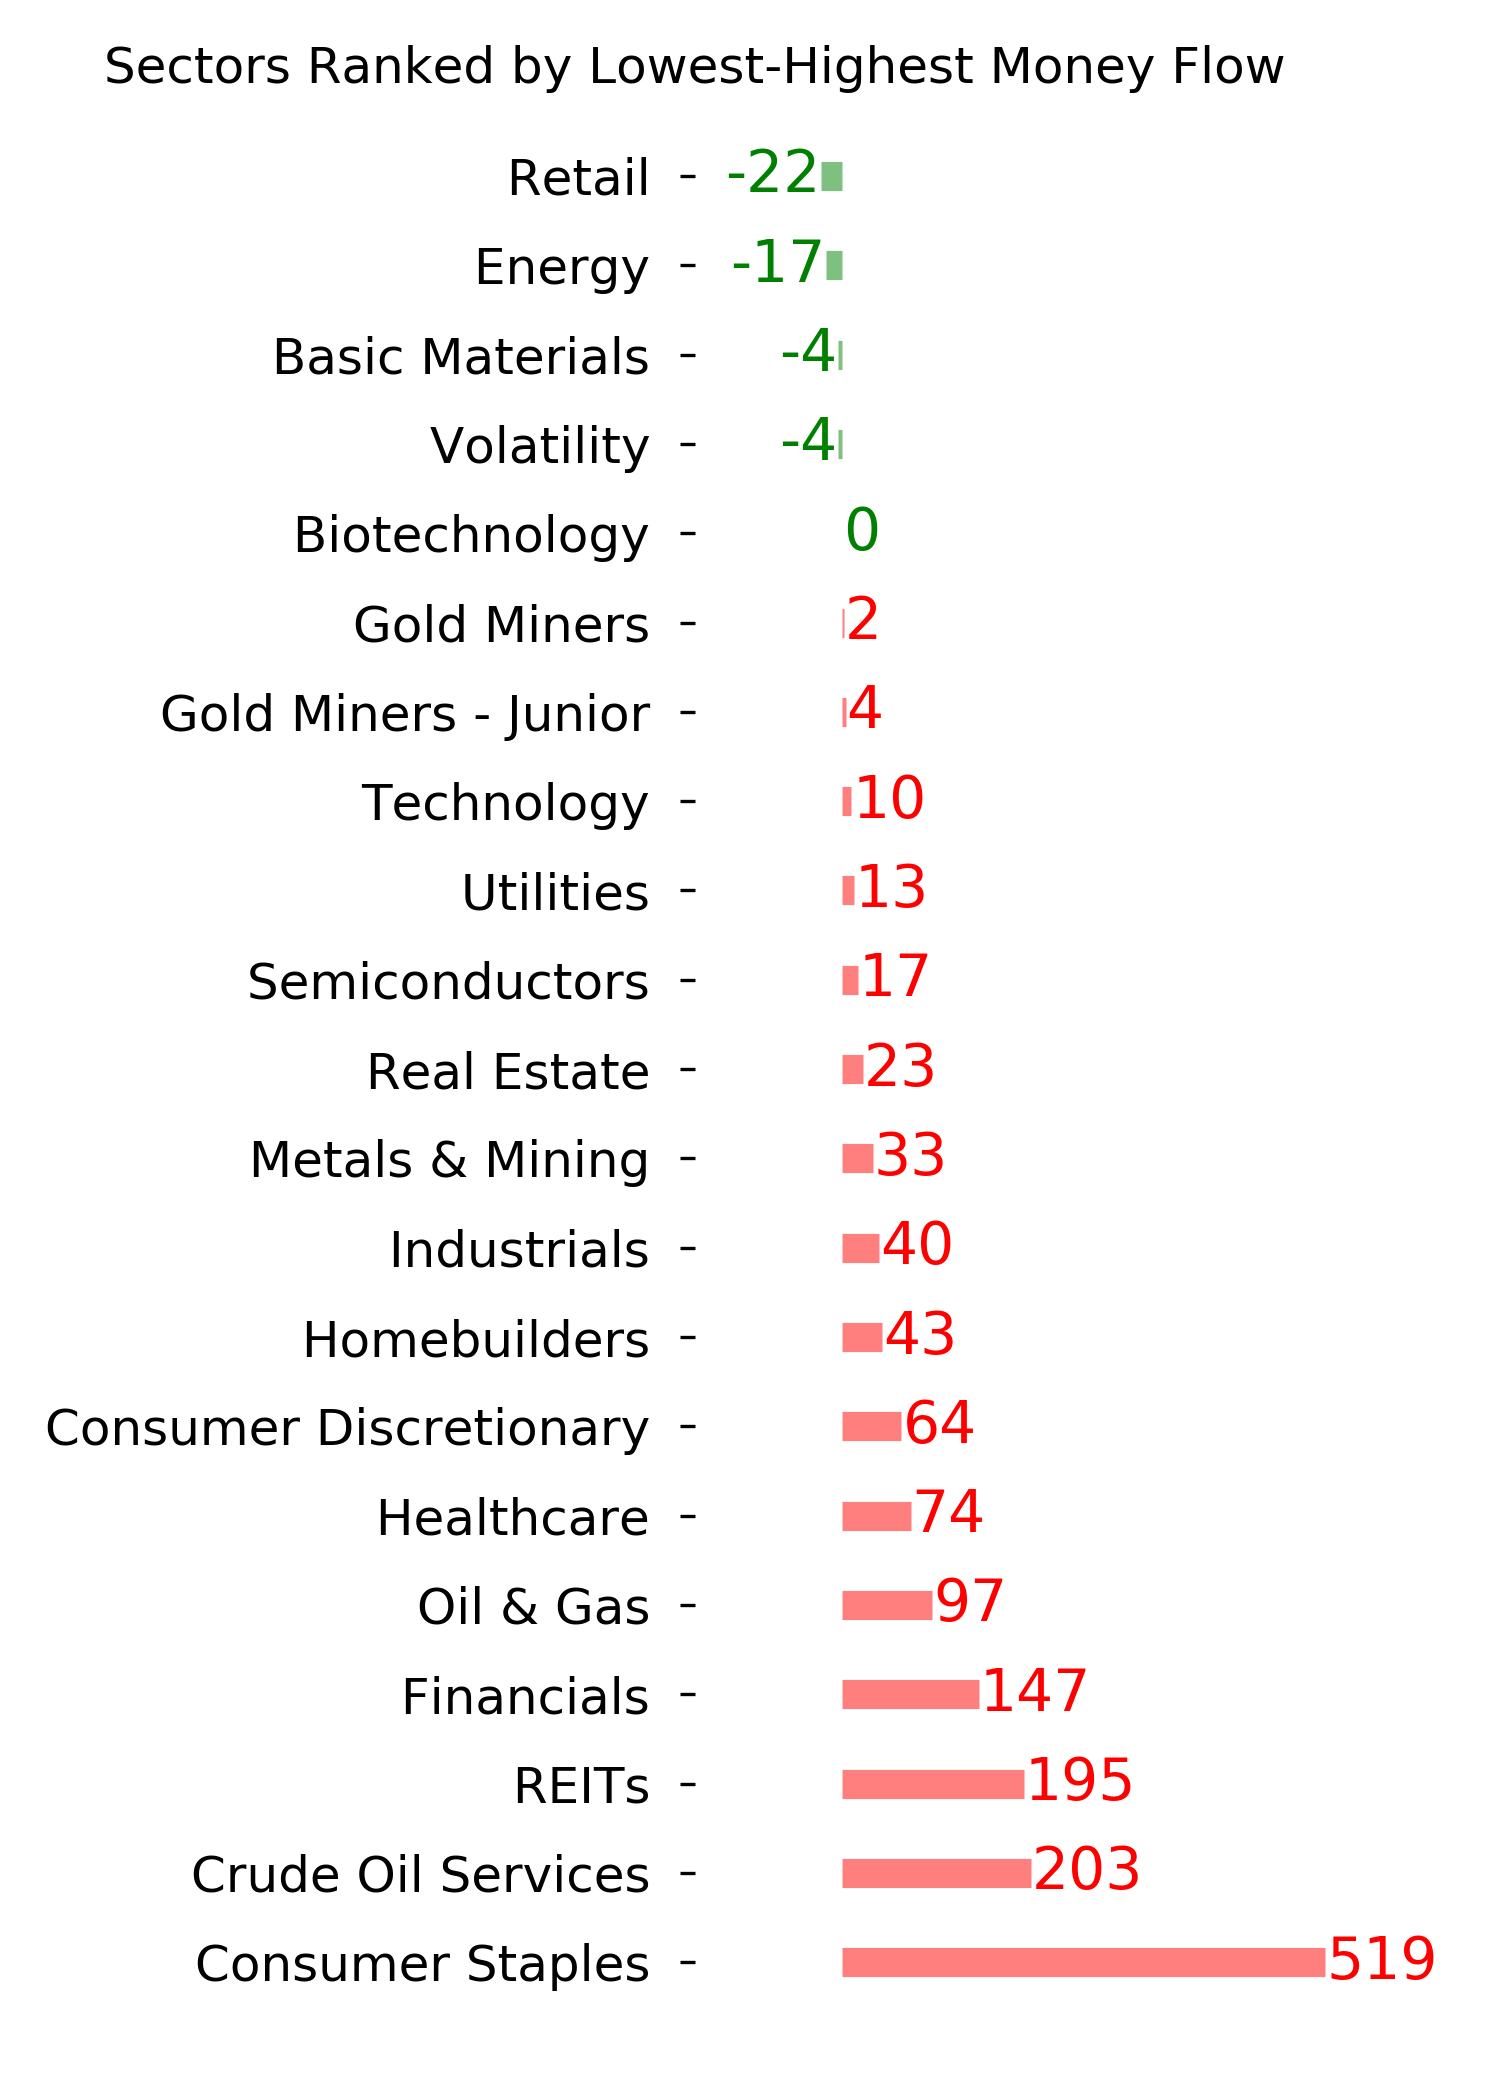
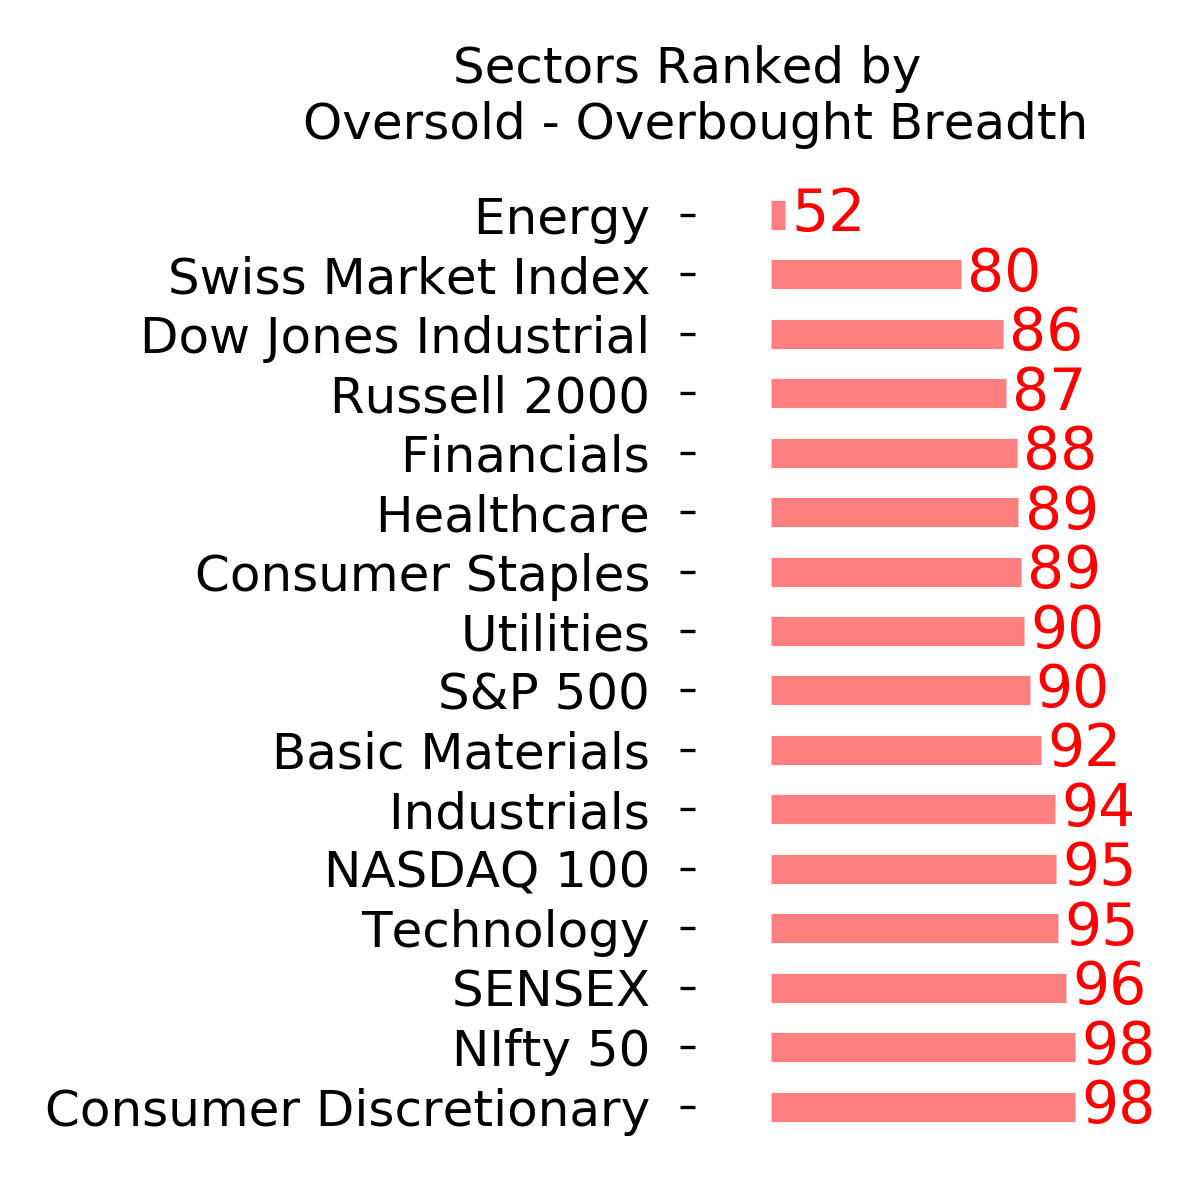
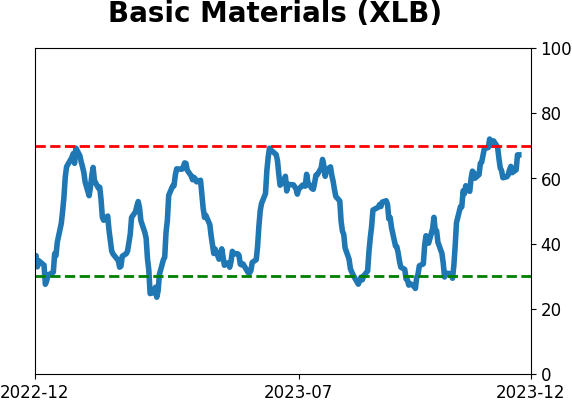
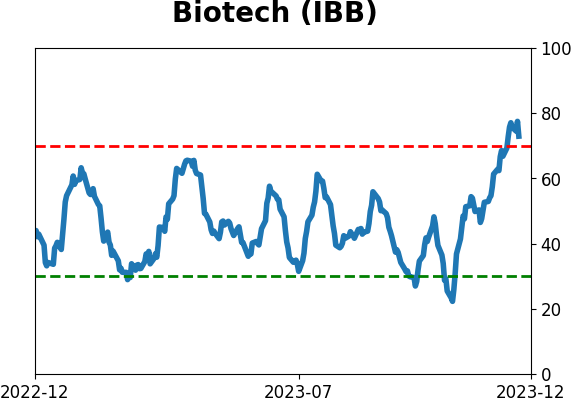
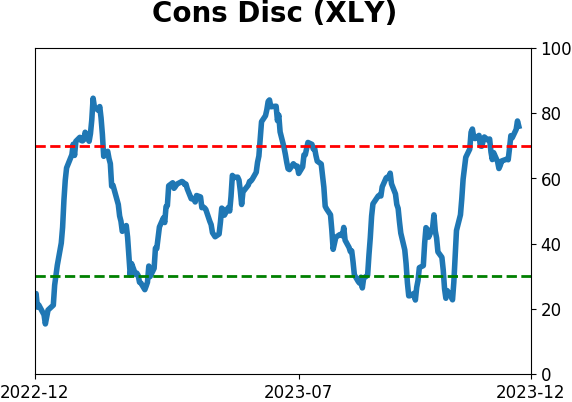
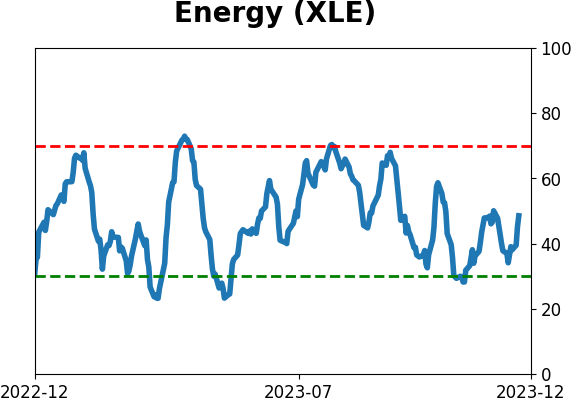
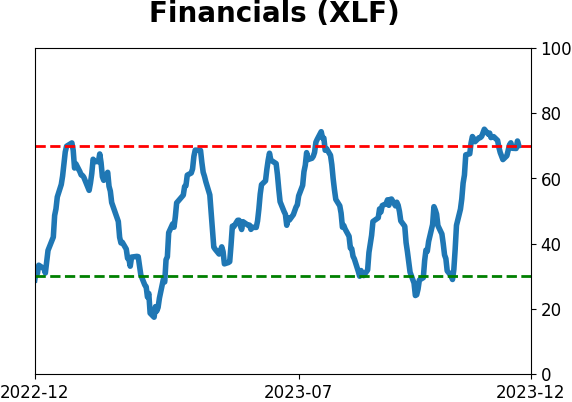
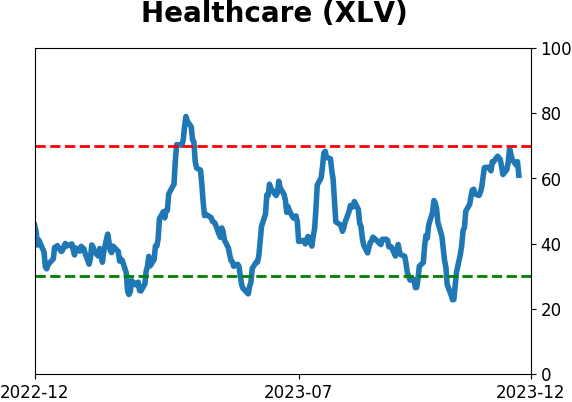
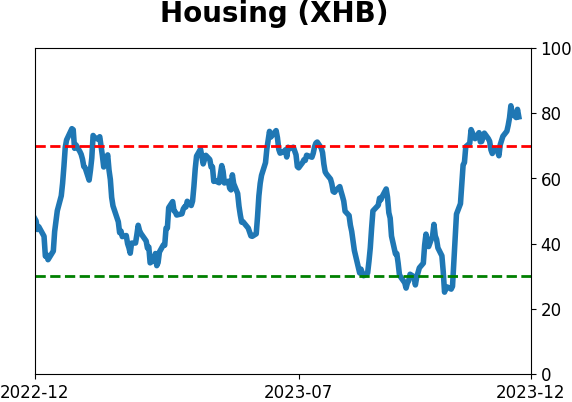
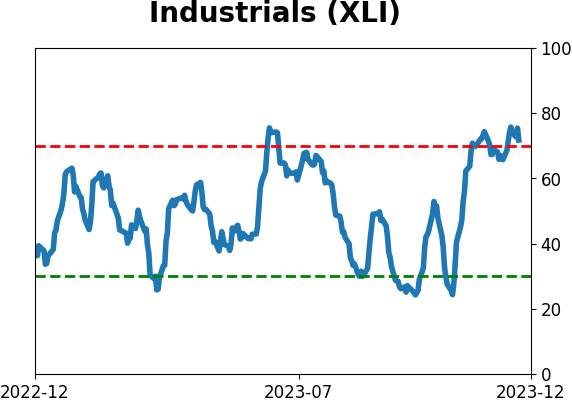
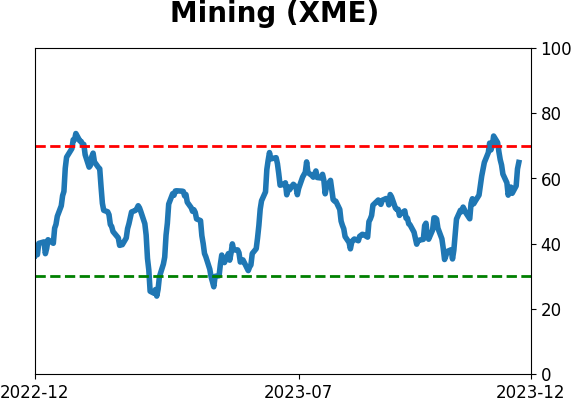
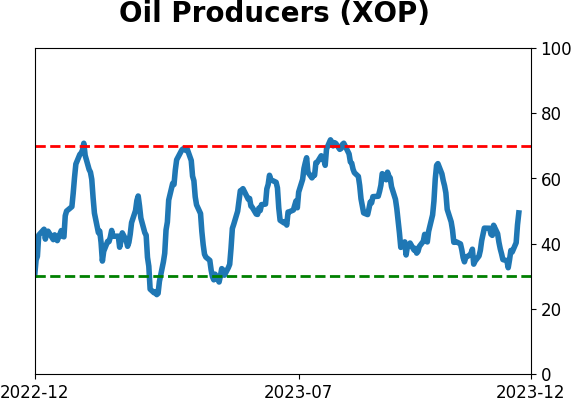
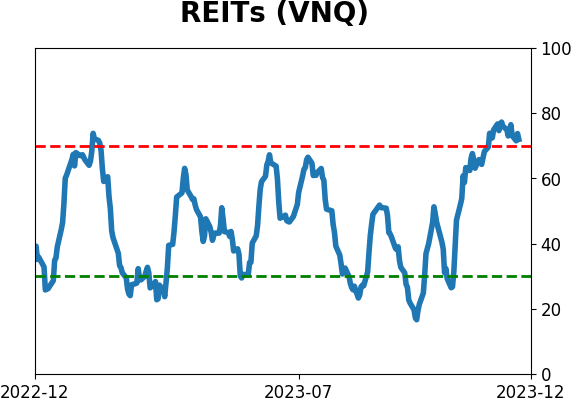
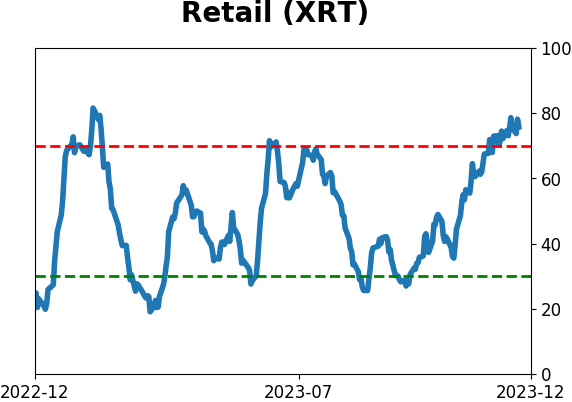
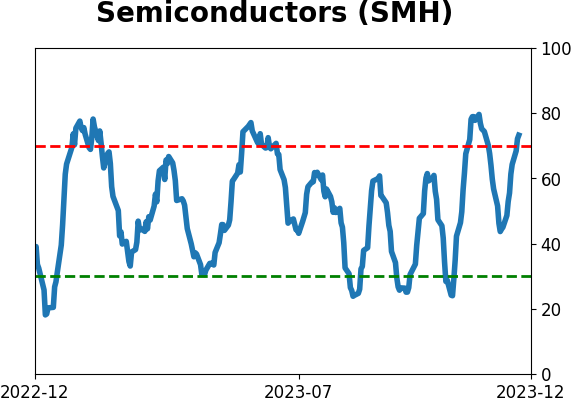
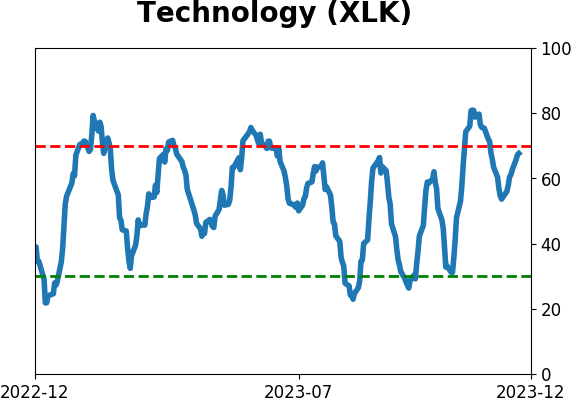
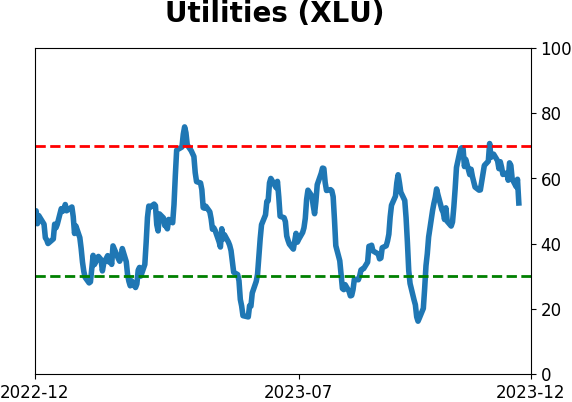
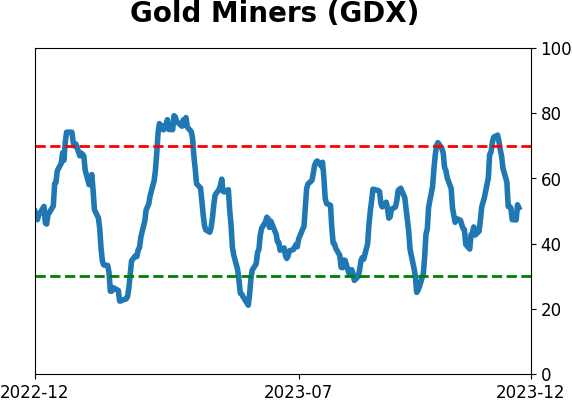
Sector ETF's - 10-Day Moving Average
|
|
|
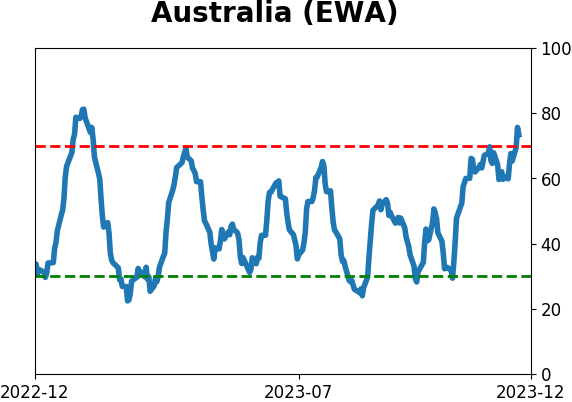
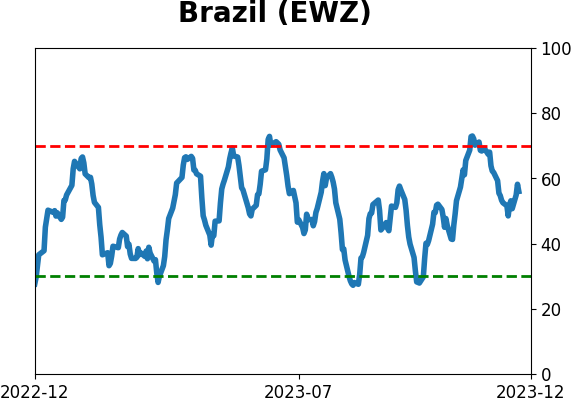
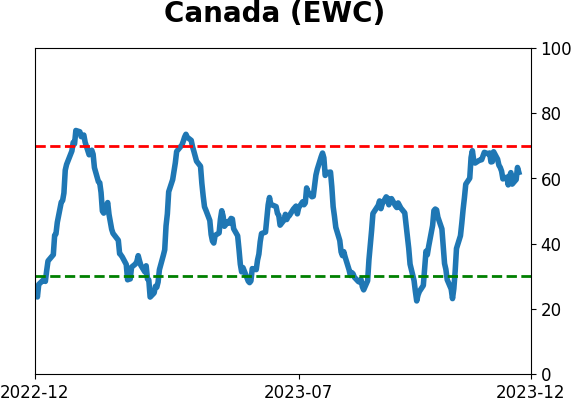
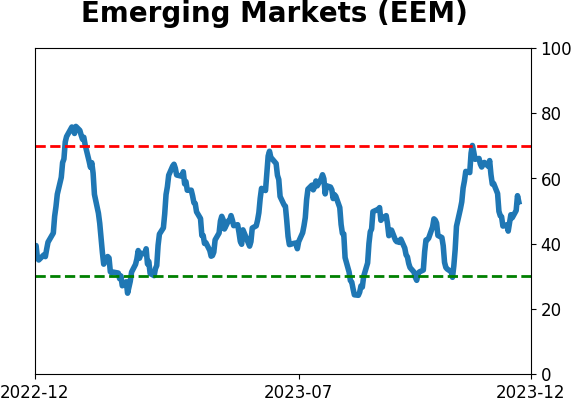
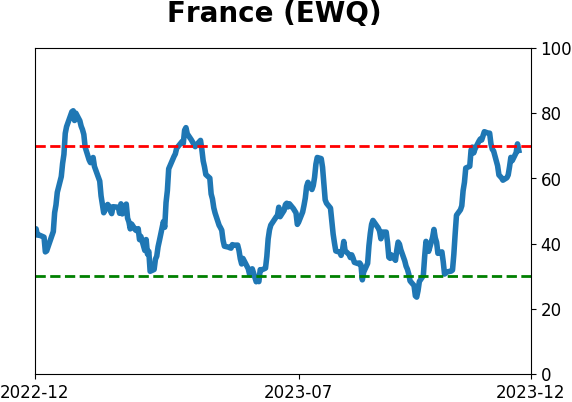
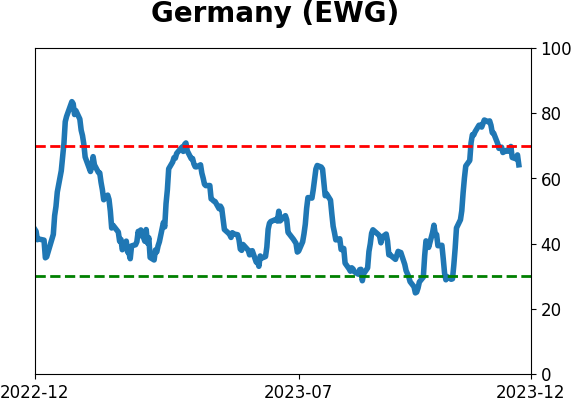
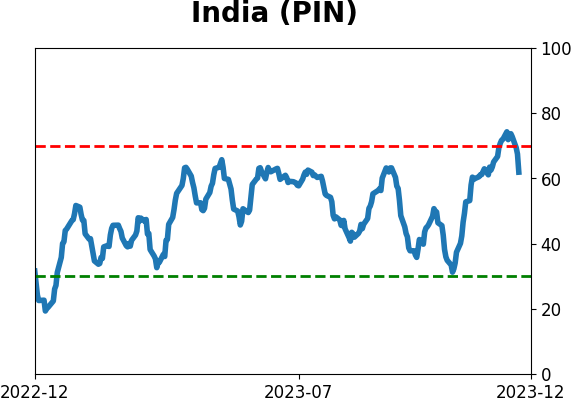
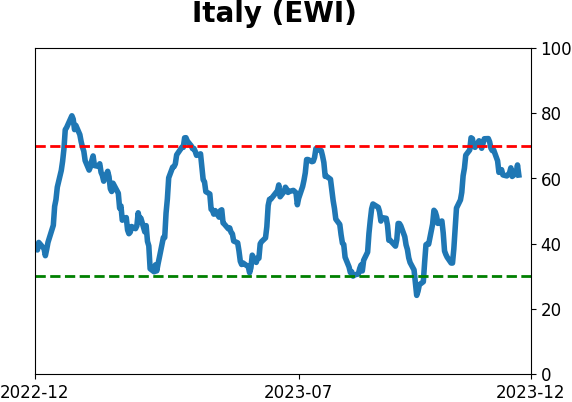
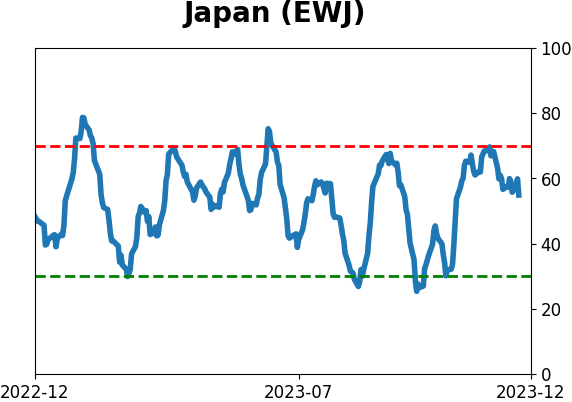
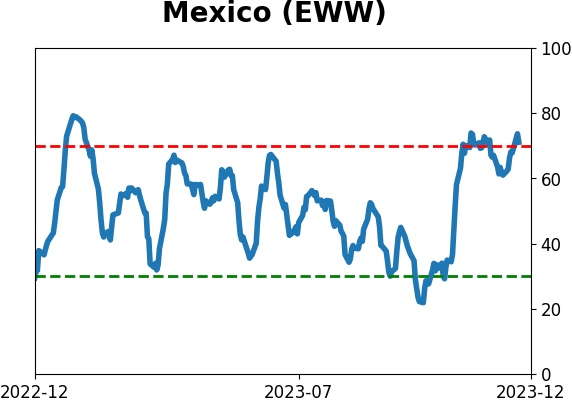
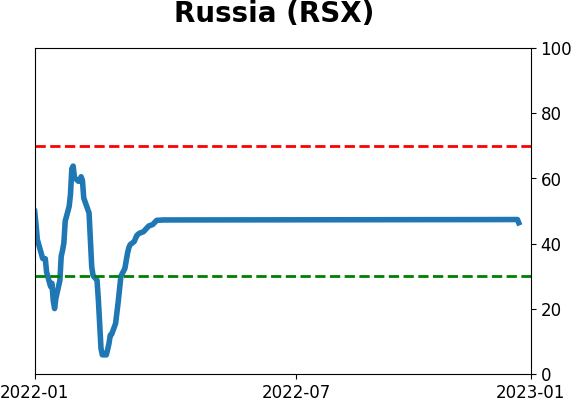
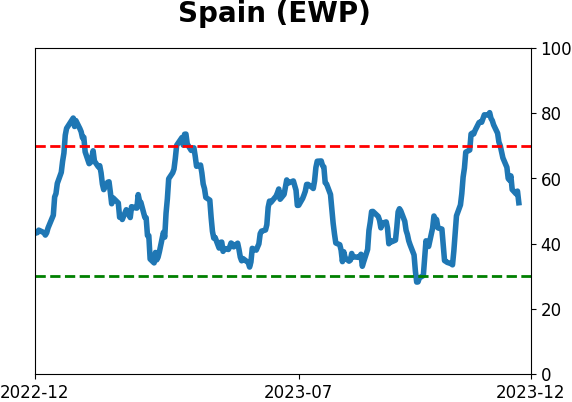
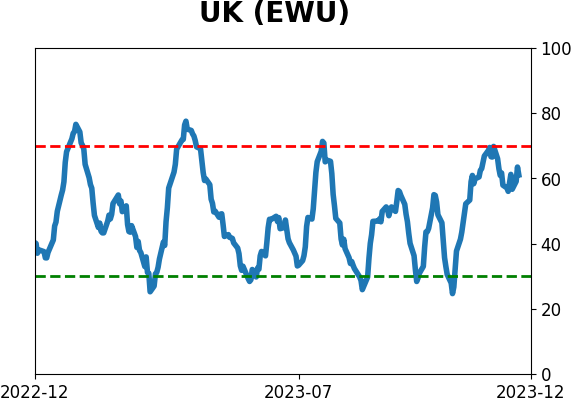
Country ETF's - 10-Day Moving Average
|
|
|
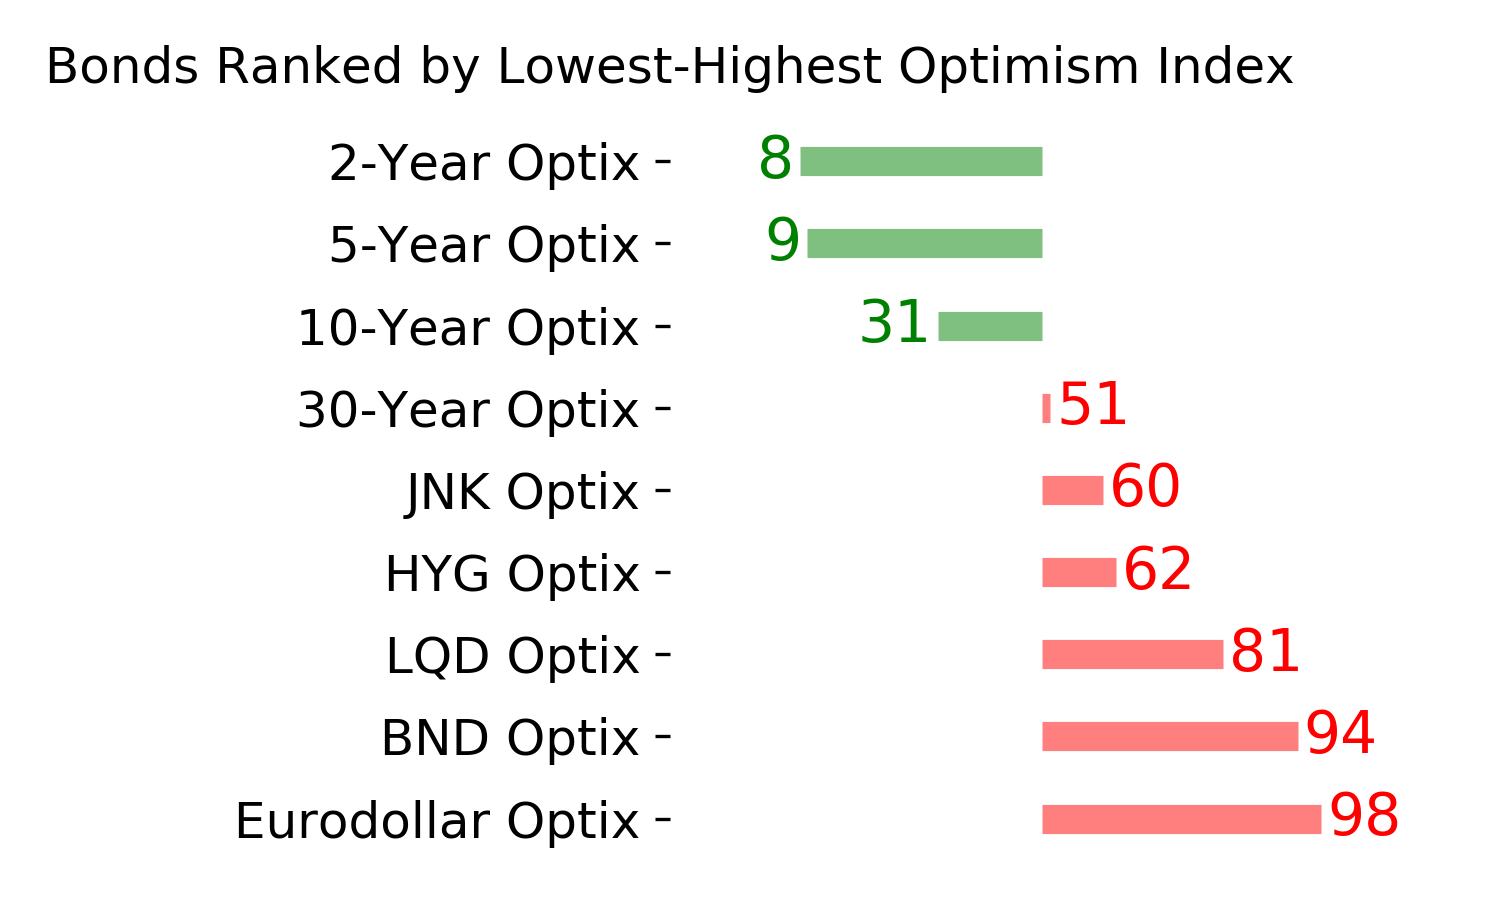
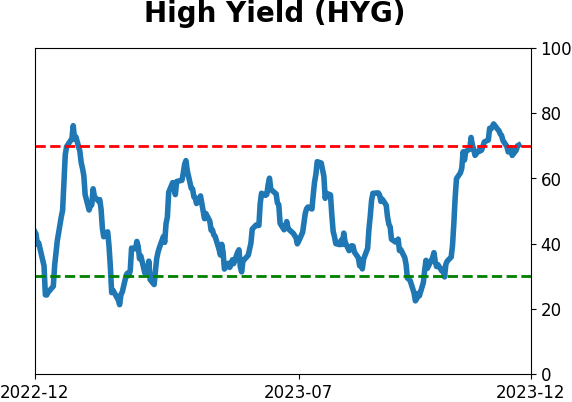
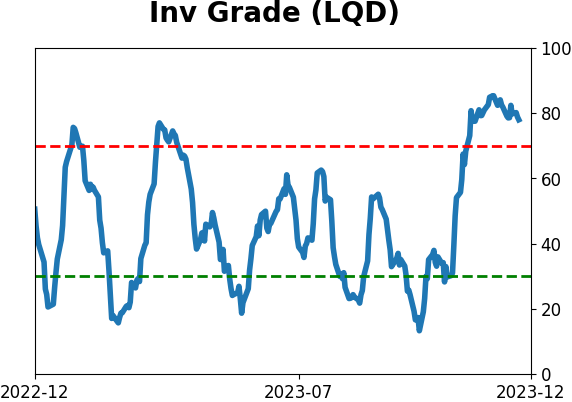
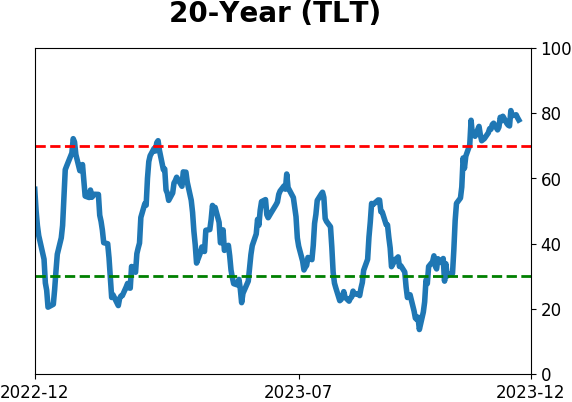
Bond ETF's - 10-Day Moving Average
|
|
|
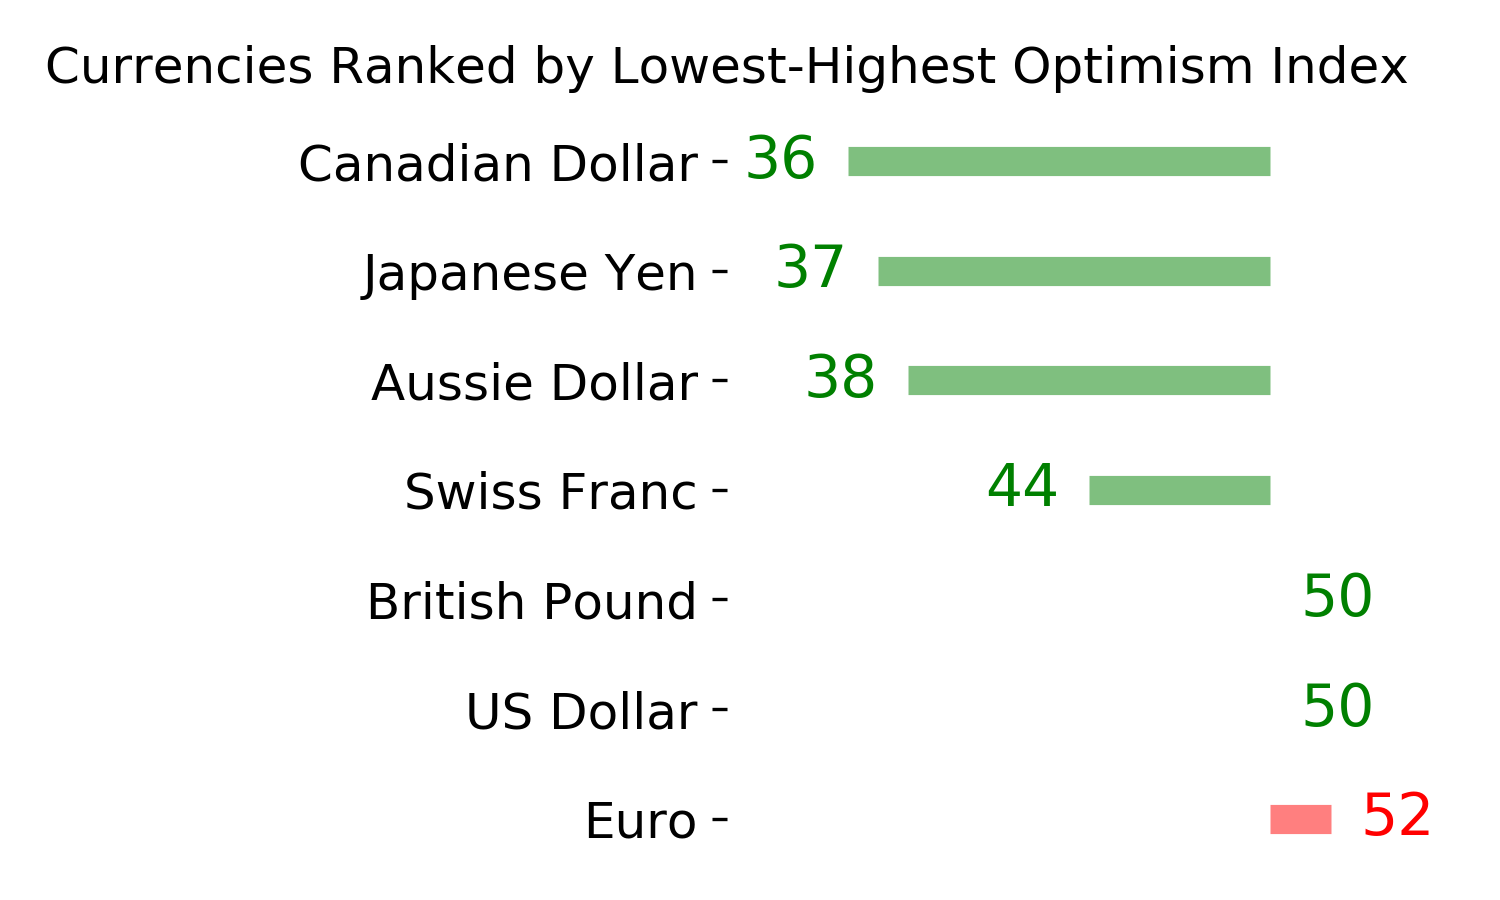
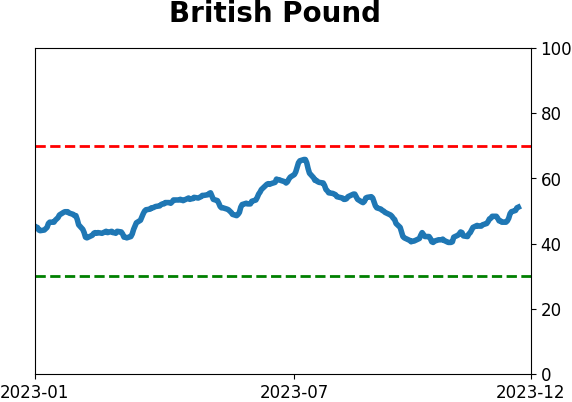
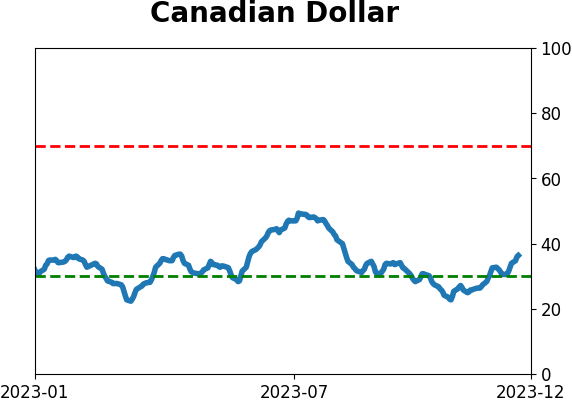
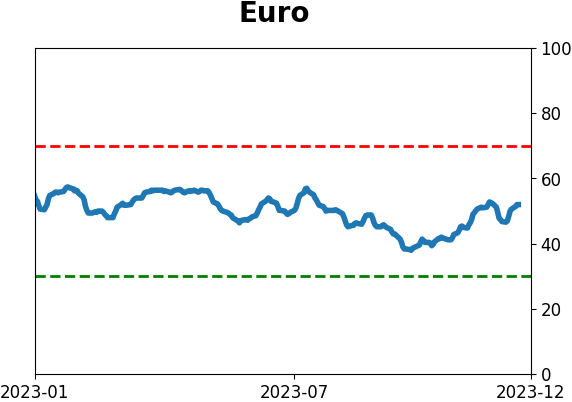
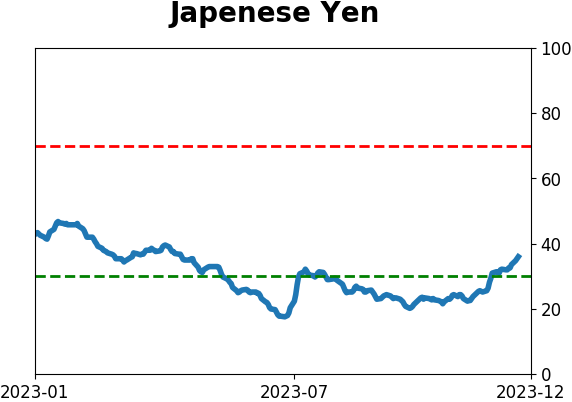
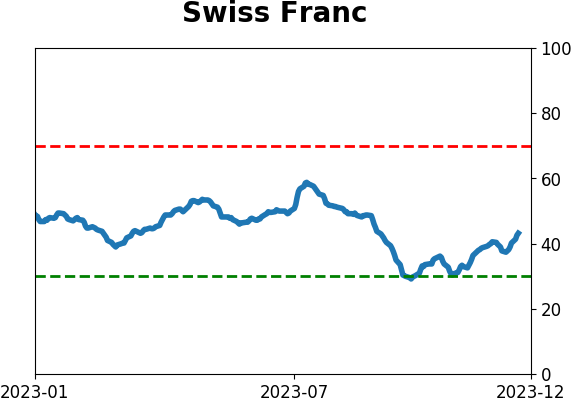
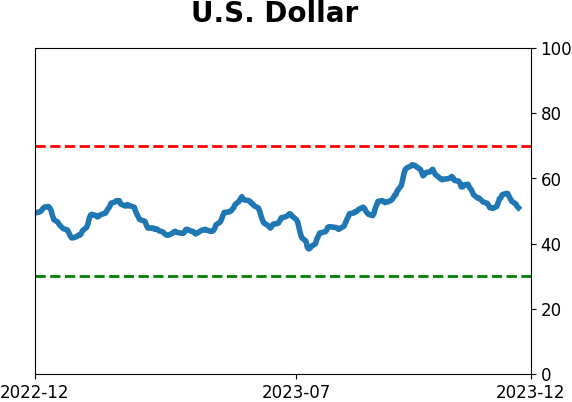
Currency ETF's - 5-Day Moving Average
|
|
|
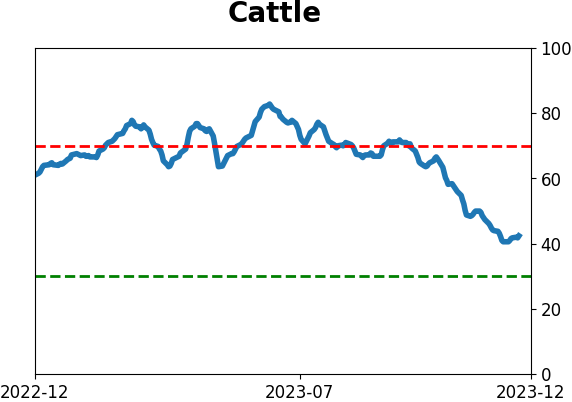
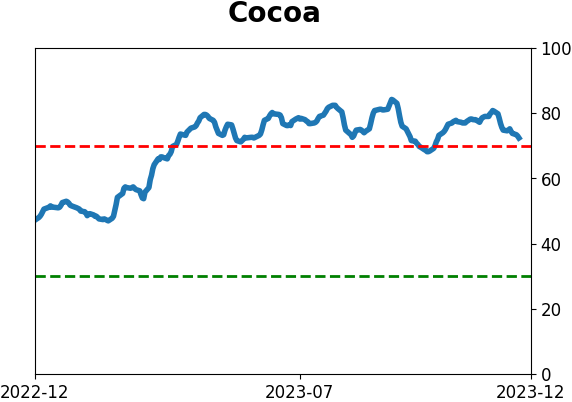
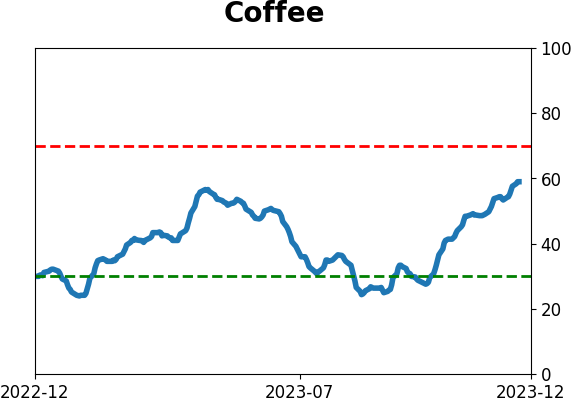
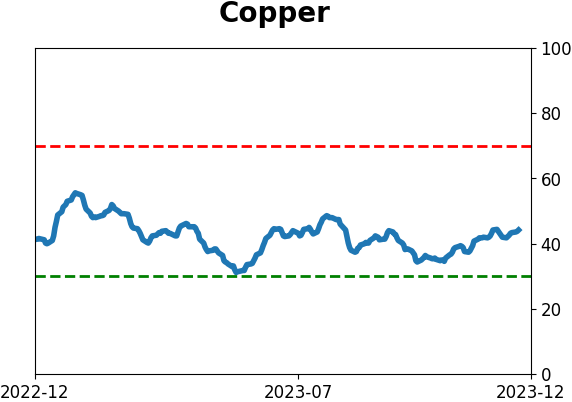
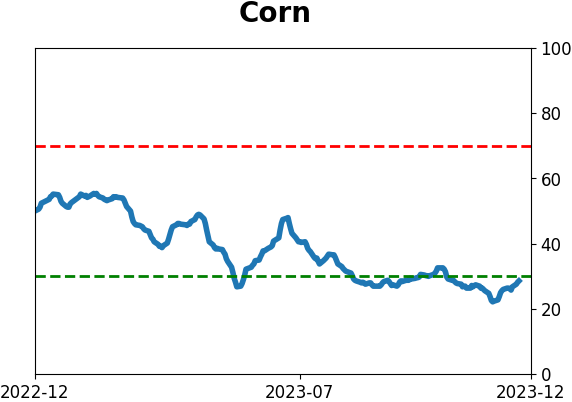
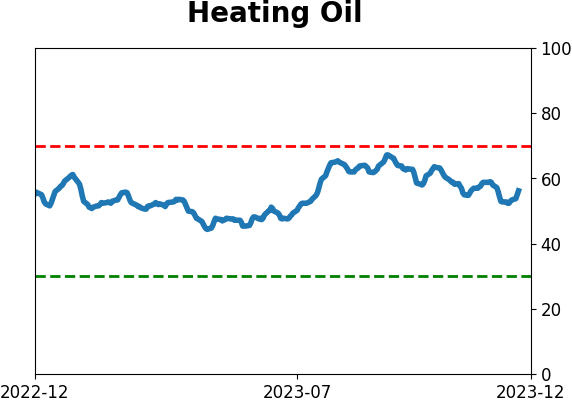
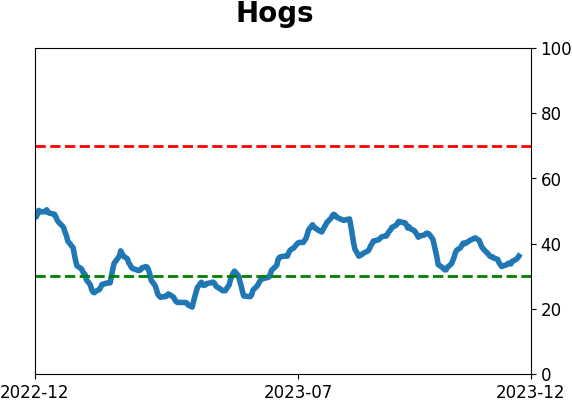
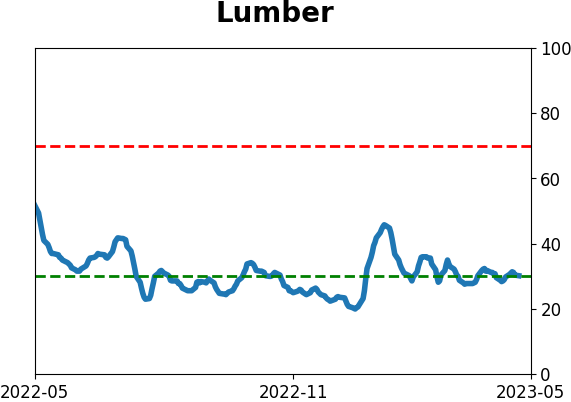
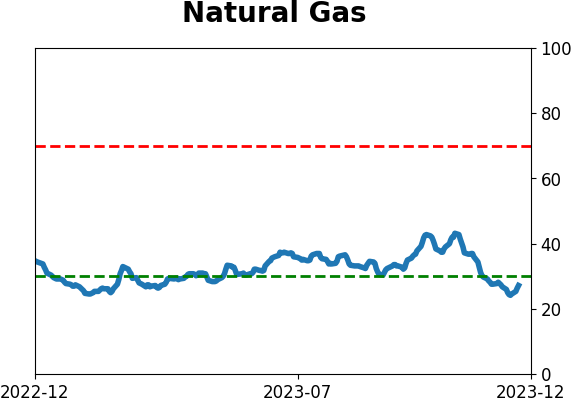
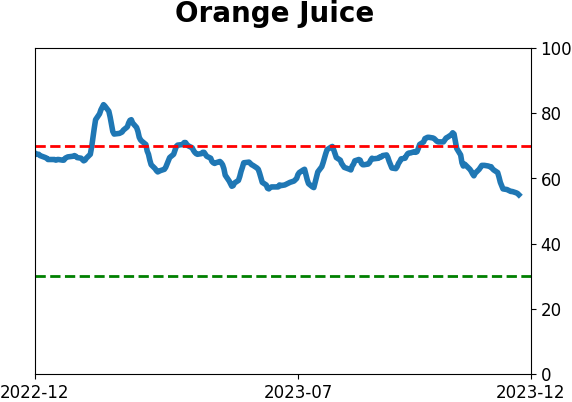
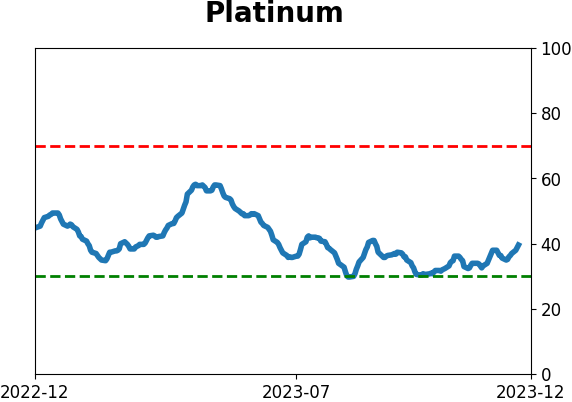
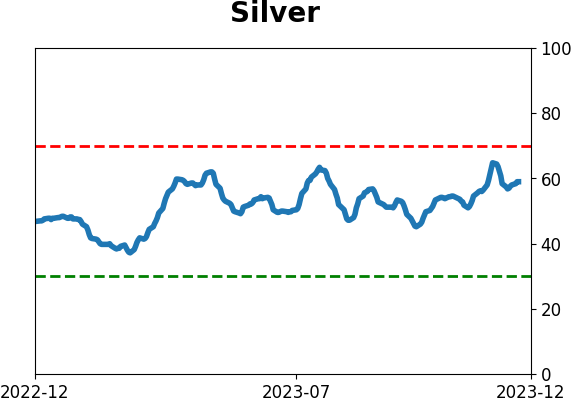
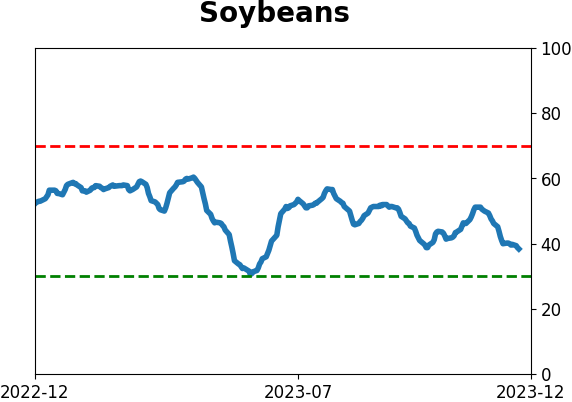
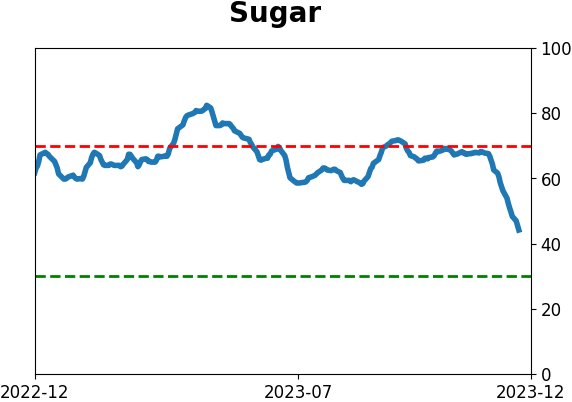
Commodity ETF's - 5-Day Moving Average
|
|