Headlines
|
|
Staples' positive trends reach a record vs Nasdaq stocks:
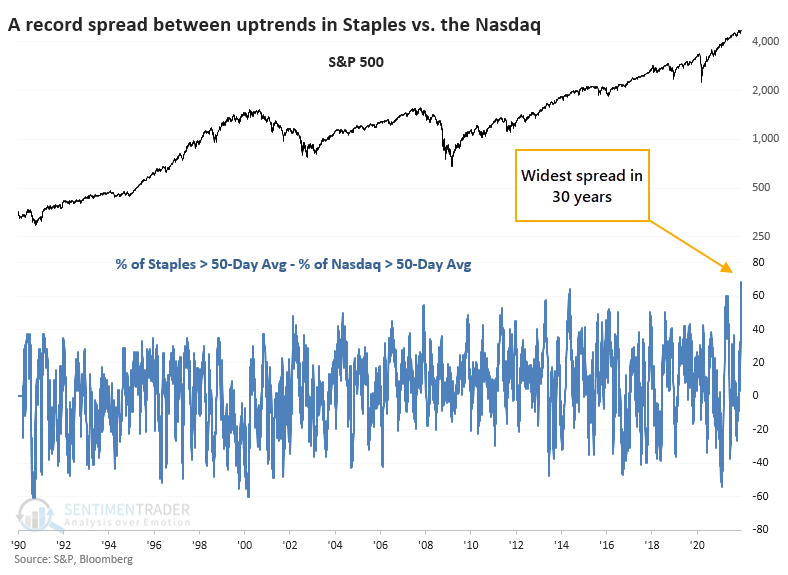
Over the past two weeks, there has been a historic surge in Consumer Staples stocks trading above their 50-day moving averages. At the same time, risk-off behavior among investors trading stocks on the Nasdaq exchange has pushed those stocks into downtrends. There is a record spread between trends in the sectors, but that has not been a consistent warning sign for the market.
Bottom Line:
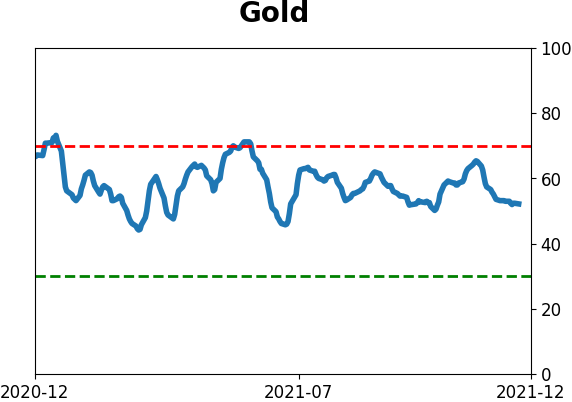
STOCKS: Hold Sentiment hit a pessimistic extreme by early December and then buyers showed enough interest to trigger a thrust in breadth. Those are reliable precursors to higher prices. There is a lot of disagreement among sectors, though, with negative divergences in tech but impressive participation in sectors like consumer staples. We should work higher but it's a bifurcated market. BONDS: Hold Despite mostly steady prices, investors turned pessimistic on bonds to a nearly decade-high degree by late November. Sentiment has recovered since then, which has been a mostly positive sign over the past 20 years, but not necessarily prior to then. GOLD: Hold
Gold and miners were rejected after trying to recover above their 200-day averages in May. Some oversold extremes in breadth measures among miners triggered in late September, and they rebounded strongly then gave those gains back. Still not much of an apparent edge here.
|
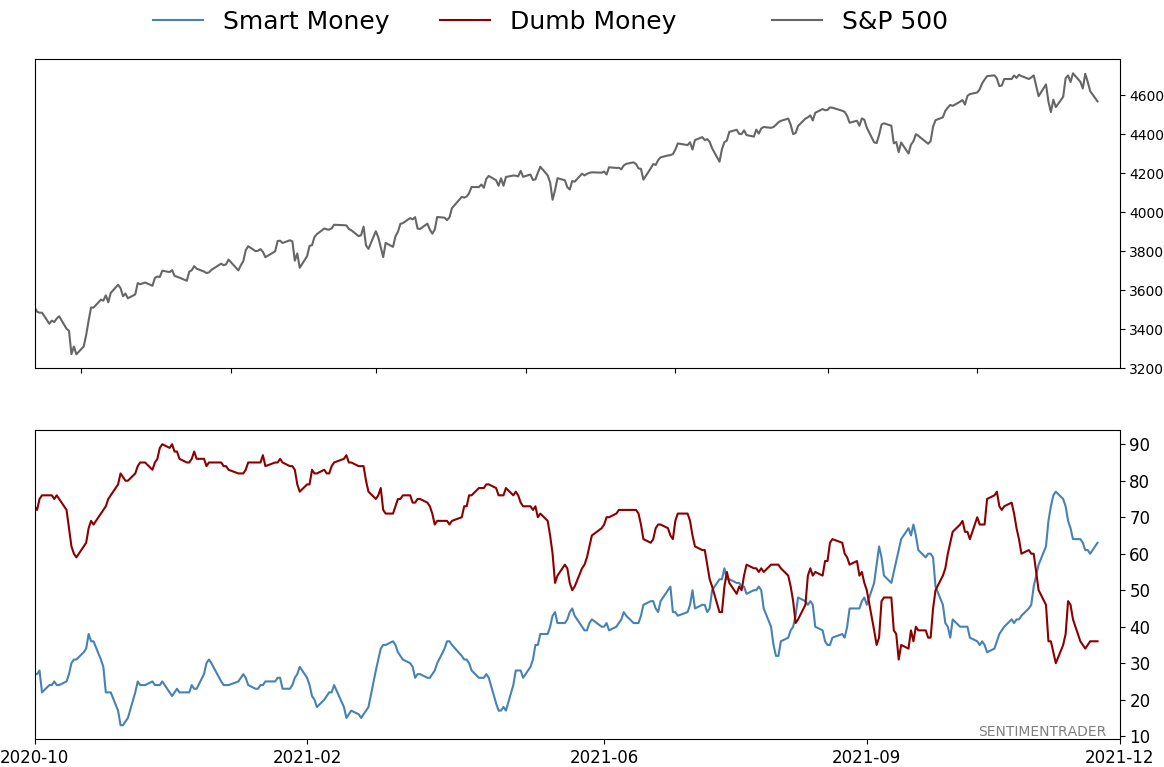
Smart / Dumb Money Confidence
|
Smart Money Confidence: 63%
Dumb Money Confidence: 36%
|
|
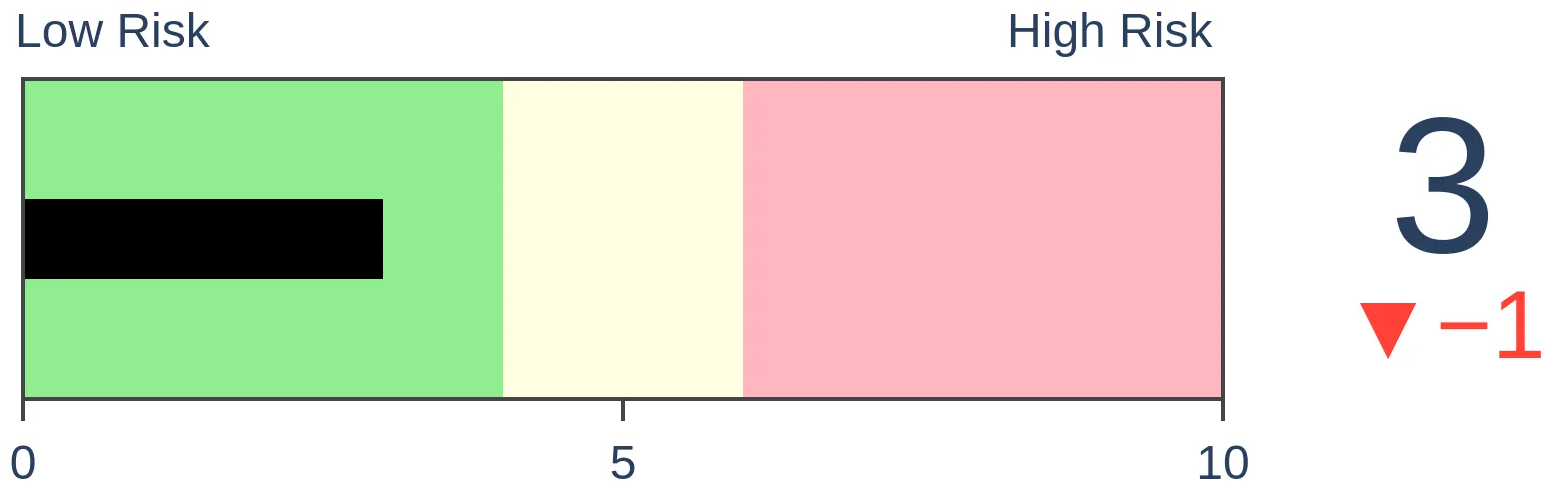
Risk Levels
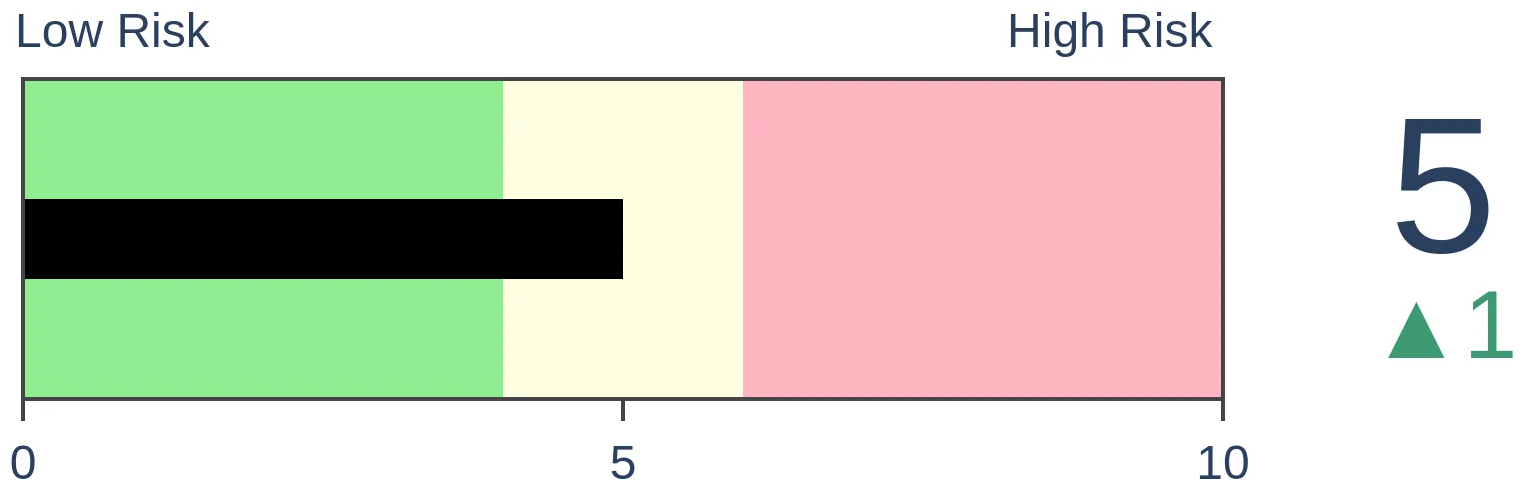
Stocks Short-Term
|
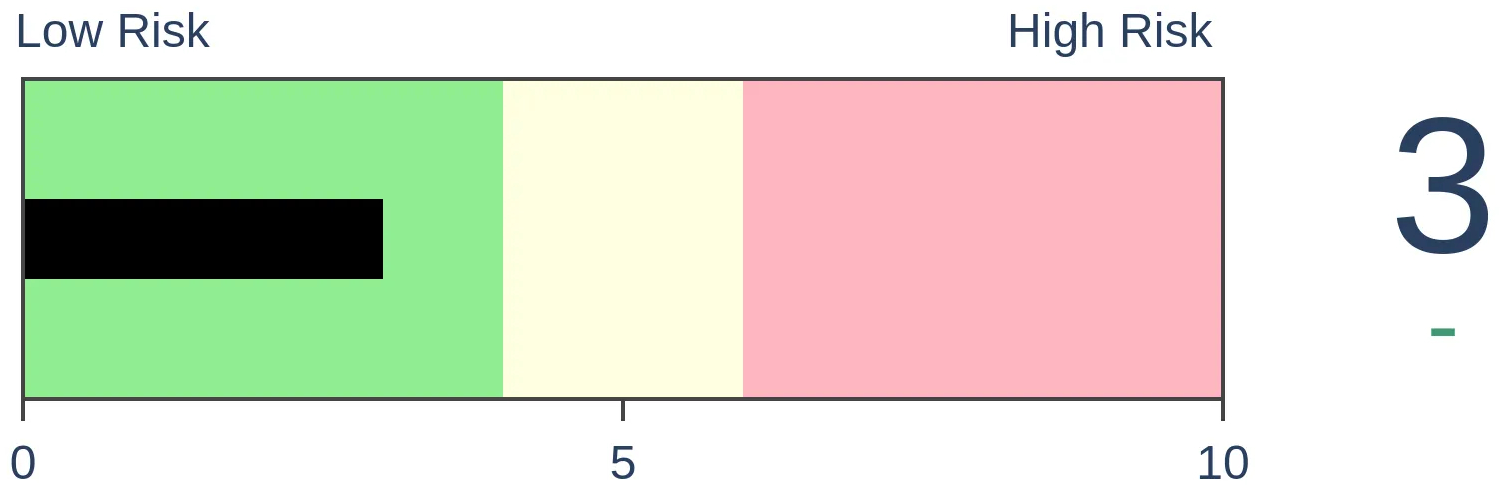
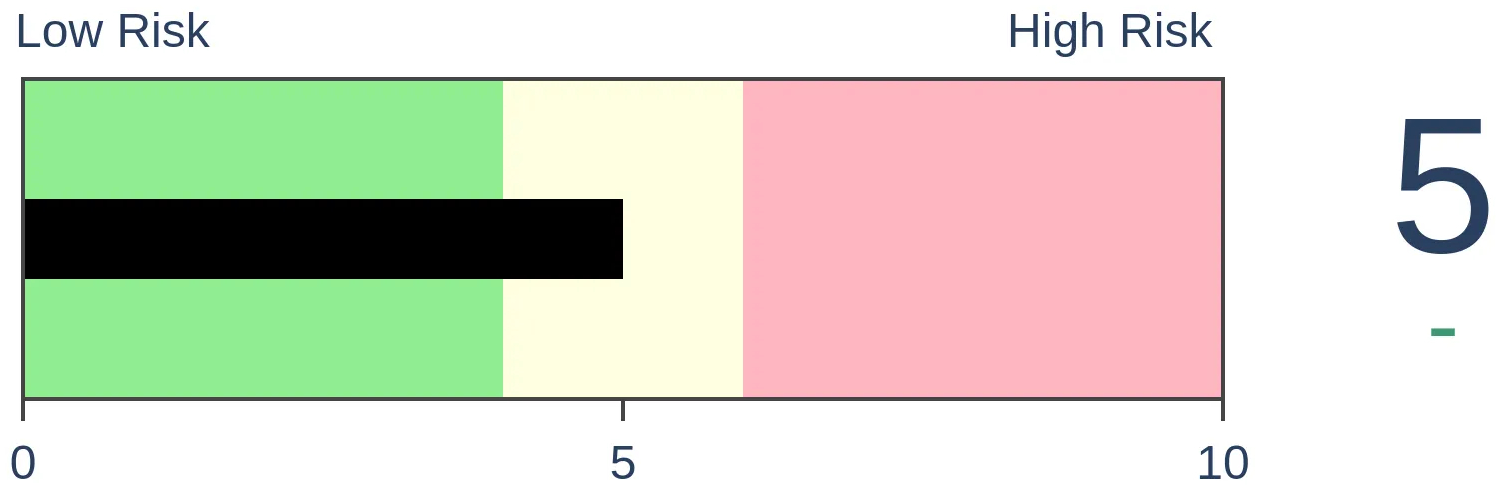
Stocks Medium-Term
|
|
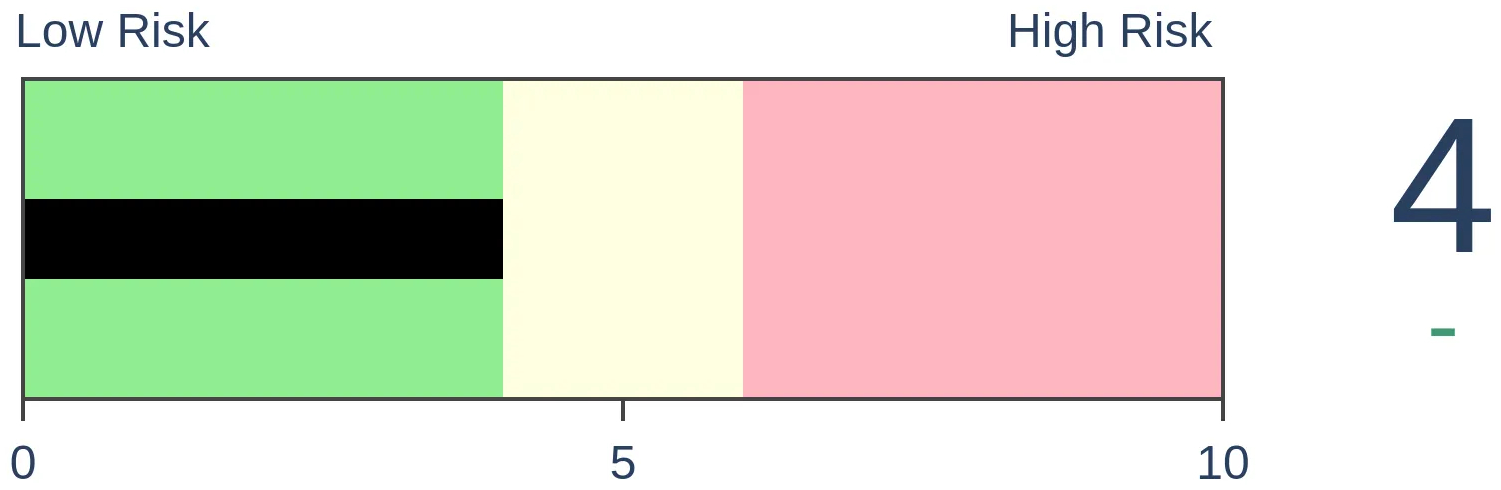
Bonds
|
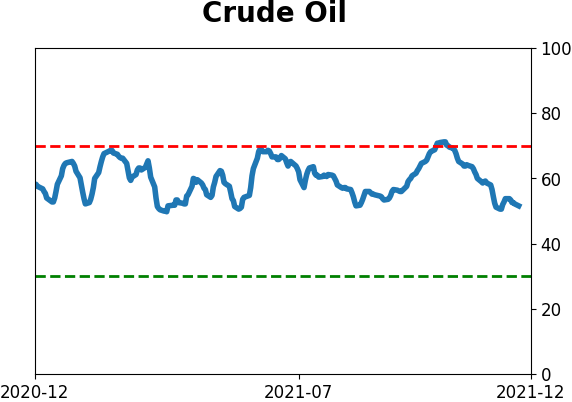
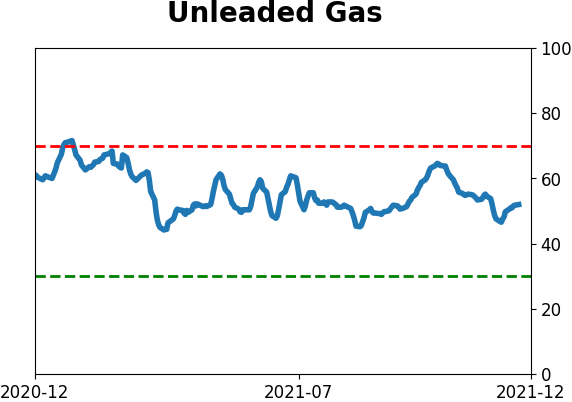
Crude Oil

|
|
Gold
|
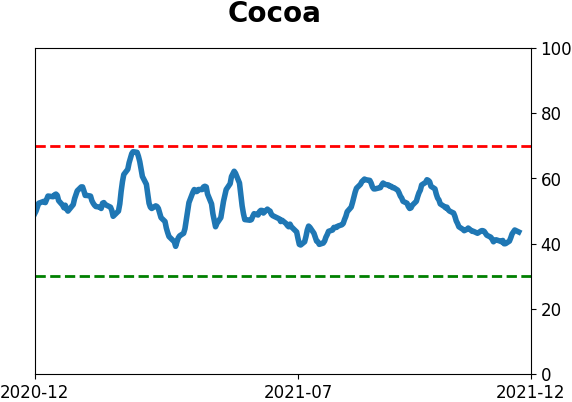
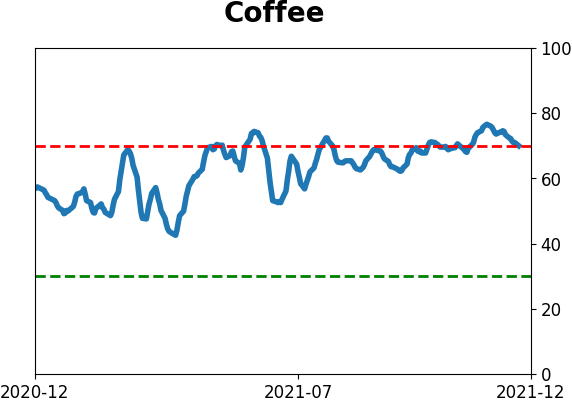
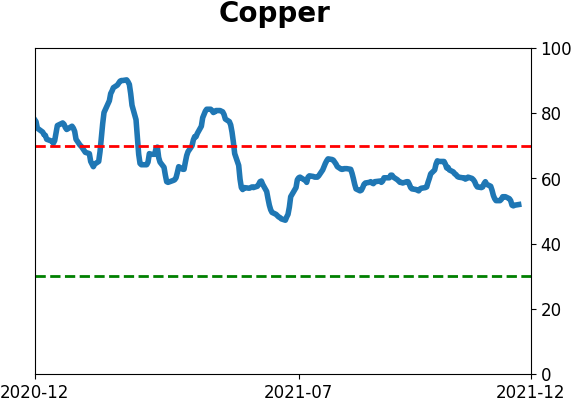
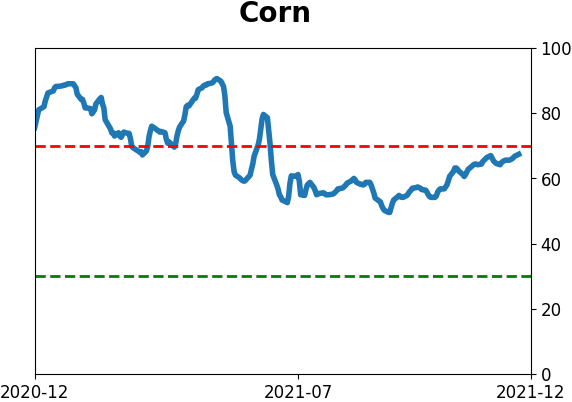
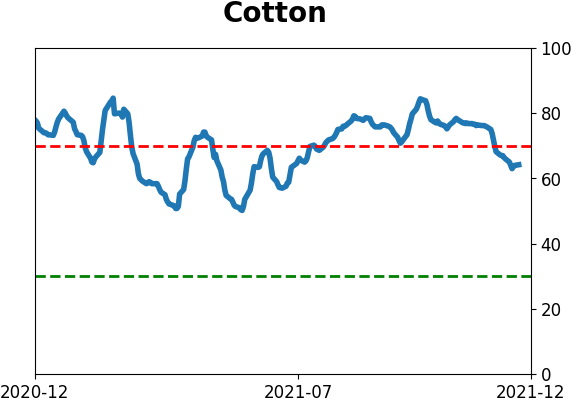
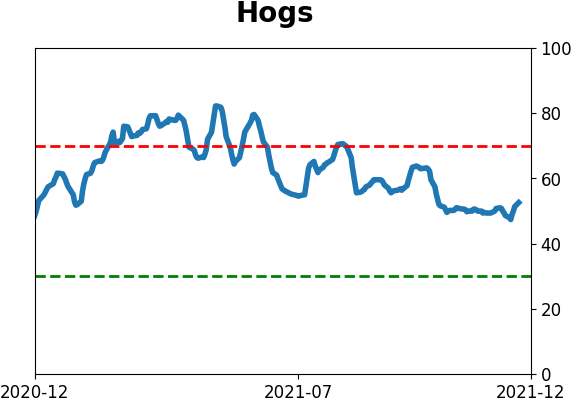
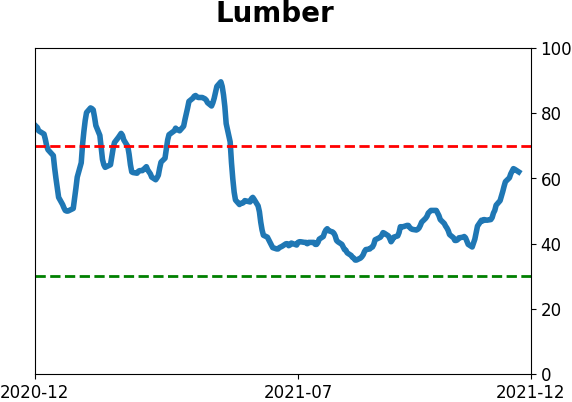
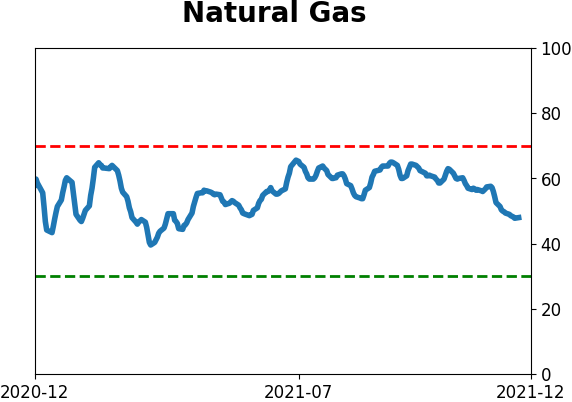
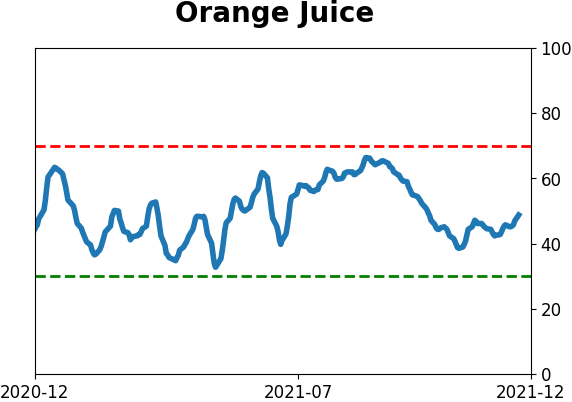
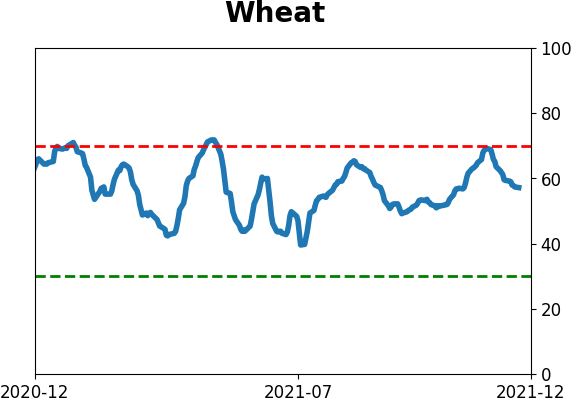
Agriculture
|
|
Research
By Jason Goepfert
BOTTOM LINE
Over the past two weeks, there has been a historic surge in Consumer Staples stocks trading above their 50-day moving averages. At the same time, risk-off behavior among investors trading stocks on the Nasdaq exchange has pushed those stocks into downtrends. There is a record spread between trends in the sectors, but that has not been a consistent warning sign for the market.
FORECAST / TIMEFRAME
None
|
Key points:
- There is a record spread between stocks in uptrends in Consumer Staples versus those traded on the Nasdaq exchange
- When the spread reached its highest level in a year, it did NOT suggest trouble for the broader market
- Historically, the Nasdaq Composite tended to quickly rebound versus the Staples sector
Staples soaring while Nasdaq wilts
We've already seen that internal trends have been powerful in defensive sectors like Consumer Staples but curiously weak in higher-beta areas like the Nasdaq 100. It's even more fragile in the broader measures that look at the entire Nasdaq exchange.
The percentage of Staples stocks trading above their 50-day moving averages reached 90% last week, while fewer than 25% of stocks on the Nasdaq managed to hold their medium-term trends.
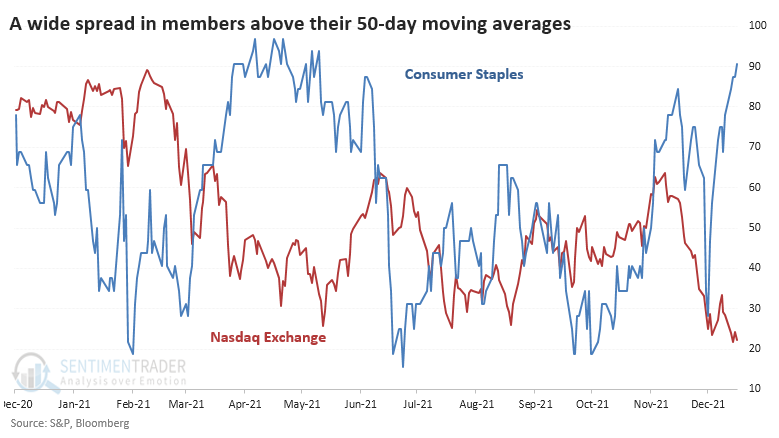
That's the widest spread in trends between the two groups in at least 30 years.
Not a consistent sign of persistent risk-aversion
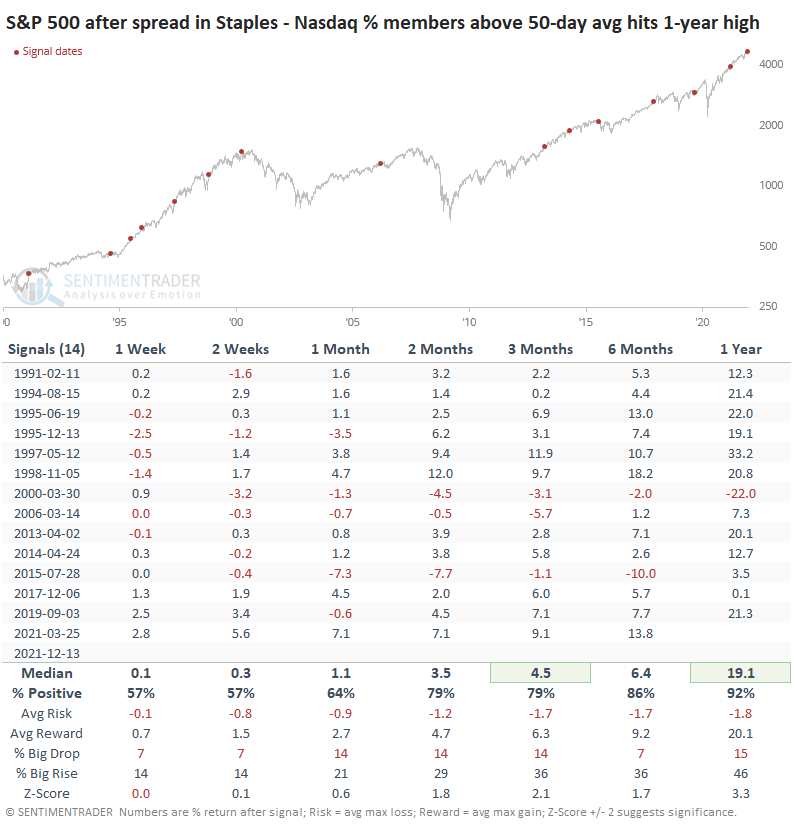
It wasn't very successful if we took this as a warning sign for the broader market. The table below shows every time when the spread between trends in these two groups hit its highest level in at least a year. We only include signals when the S&P 500 was within 5% of a multi-year high at the time.
While the S&P's shorter-term returns were nothing special, its performance was well above random over the next 3-12 months. Over the next year, it showed a positive return 12 out of 13 times (and has a high probability of going 13 for 14). But that loser in 2000 was a major one as it effectively marked the peak of the bubble.
While it's tempting to conclude that this kind of behavior signals a change in fortunes between the two groups, it didn't work out that way most of the time. Staples showed a consistent tendency to underperform the Nasdaq Composite in the months ahead.
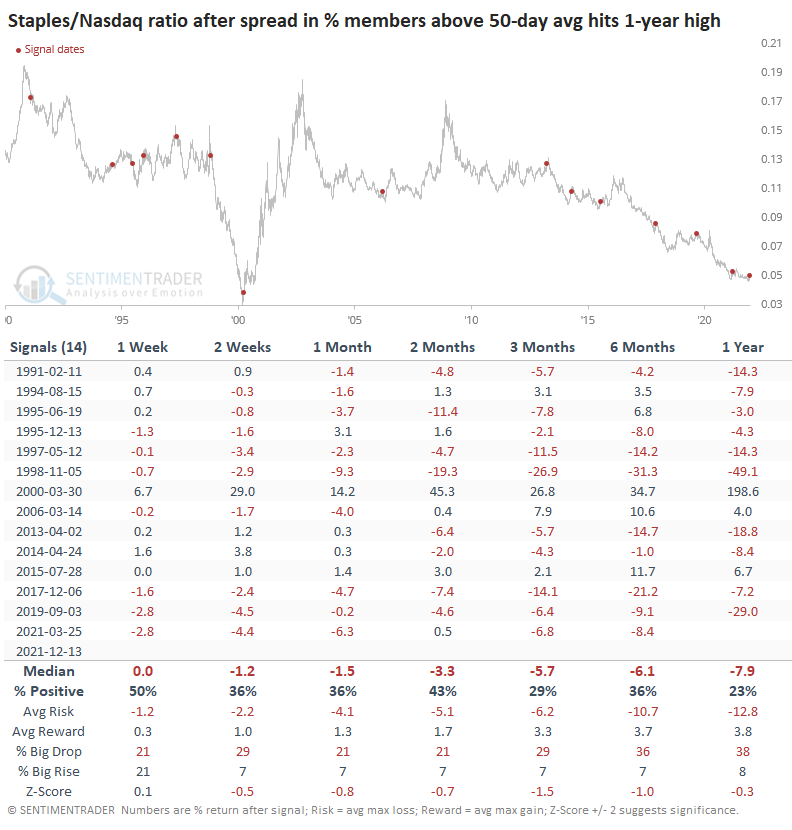
There were three significant exceptions to this. In 2000, Staples continued to outperform the Nasdaq across every time frame. Same for 2015. In 2006, Staples took a quick relative dive, then rebounded strongly.
What the research tells us...
There is a historic spread between stocks enjoying medium-term uptrends in Consumer Staples versus those traded on the Nasdaq exchange. This shows a temporary bout of risk-off behavior among investors, but historically it's been rare to see this persist for much longer. It has not consistently indicated that a major change in trend has occurred, but if Staples continue to outperform in the weeks ahead, that probability will increase.
Active Studies
| Time Frame | Bullish | Bearish | | Short-Term | 2 | 3 | | Medium-Term | 14 | 2 | | Long-Term | 16 | 8 |
|
Indicators at Extremes
Portfolio
| Position | Description | Weight % | Added / Reduced | Date | | Stocks | RSP | 10.7 | Added 6.4% | 2021-10-01 | | Bonds | 32.7% BND, 7.1% SCHP | 39.8 | Added 8.3% | 2021-10-26 | | Commodities | GCC | 2.4 | Reduced 2.1%
| 2020-09-04 | | Precious Metals | GDX | 4.6 | Reduced 4.2% | 2021-05-19 | | Special Situations | 9.8% KWEB, 4.7% XLE, 2.9% PSCE | 17.3 | Added 9.78% | 2021-10-01 | | Cash | | 24.1 | | |
|
Updates (Changes made today are underlined)
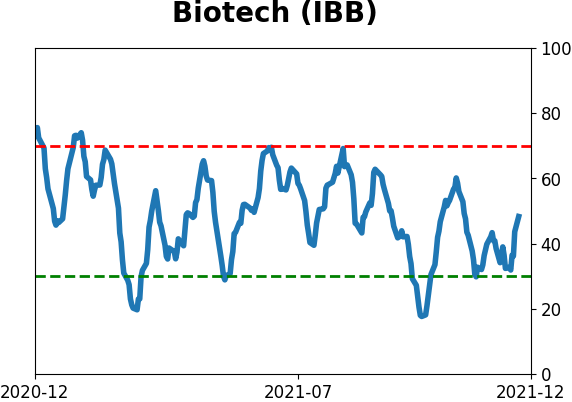
No surprise for 2021, but we're seeing conflicting messages in some of what has developed lately. There was a jump in pessimism heading into December, which has been relieved to some degree. The subsequent breadth thrust has extremely positive implications for forward returns, especially longer-term. The negatives are mostly sector-related, especially the negative divergences among Nasdaq 100 stocks. Consumer Staples have seen an impressive surge, and Biotech may be oversold, but otherwise there are a whole lot of crosscurrents and seemingly not much edge. Bond sentiment is trying to recover from a recent bout of pessimism, and gold stocks are doing their thing which is not much at all. They've been flat for six months. Chinese tech stocks were doing exactly what they're supposed to do, then did *not* by plunging to new lows. This is troubling on a shorter-term time frame, but this was never meant for a trade, rather a multi-year investment. Recent behavior is troubling and I will not be adding any exposure as long as that's the case. RETURN YTD: 6.7% 2020: 8.1%, 2019: 12.6%, 2018: 0.6%, 2017: 3.8%, 2016: 17.1%, 2015: 9.2%, 2014: 14.5%, 2013: 2.2%, 2012: 10.8%, 2011: 16.5%, 2010: 15.3%, 2009: 23.9%, 2008: 16.2%, 2007: 7.8%
|
|
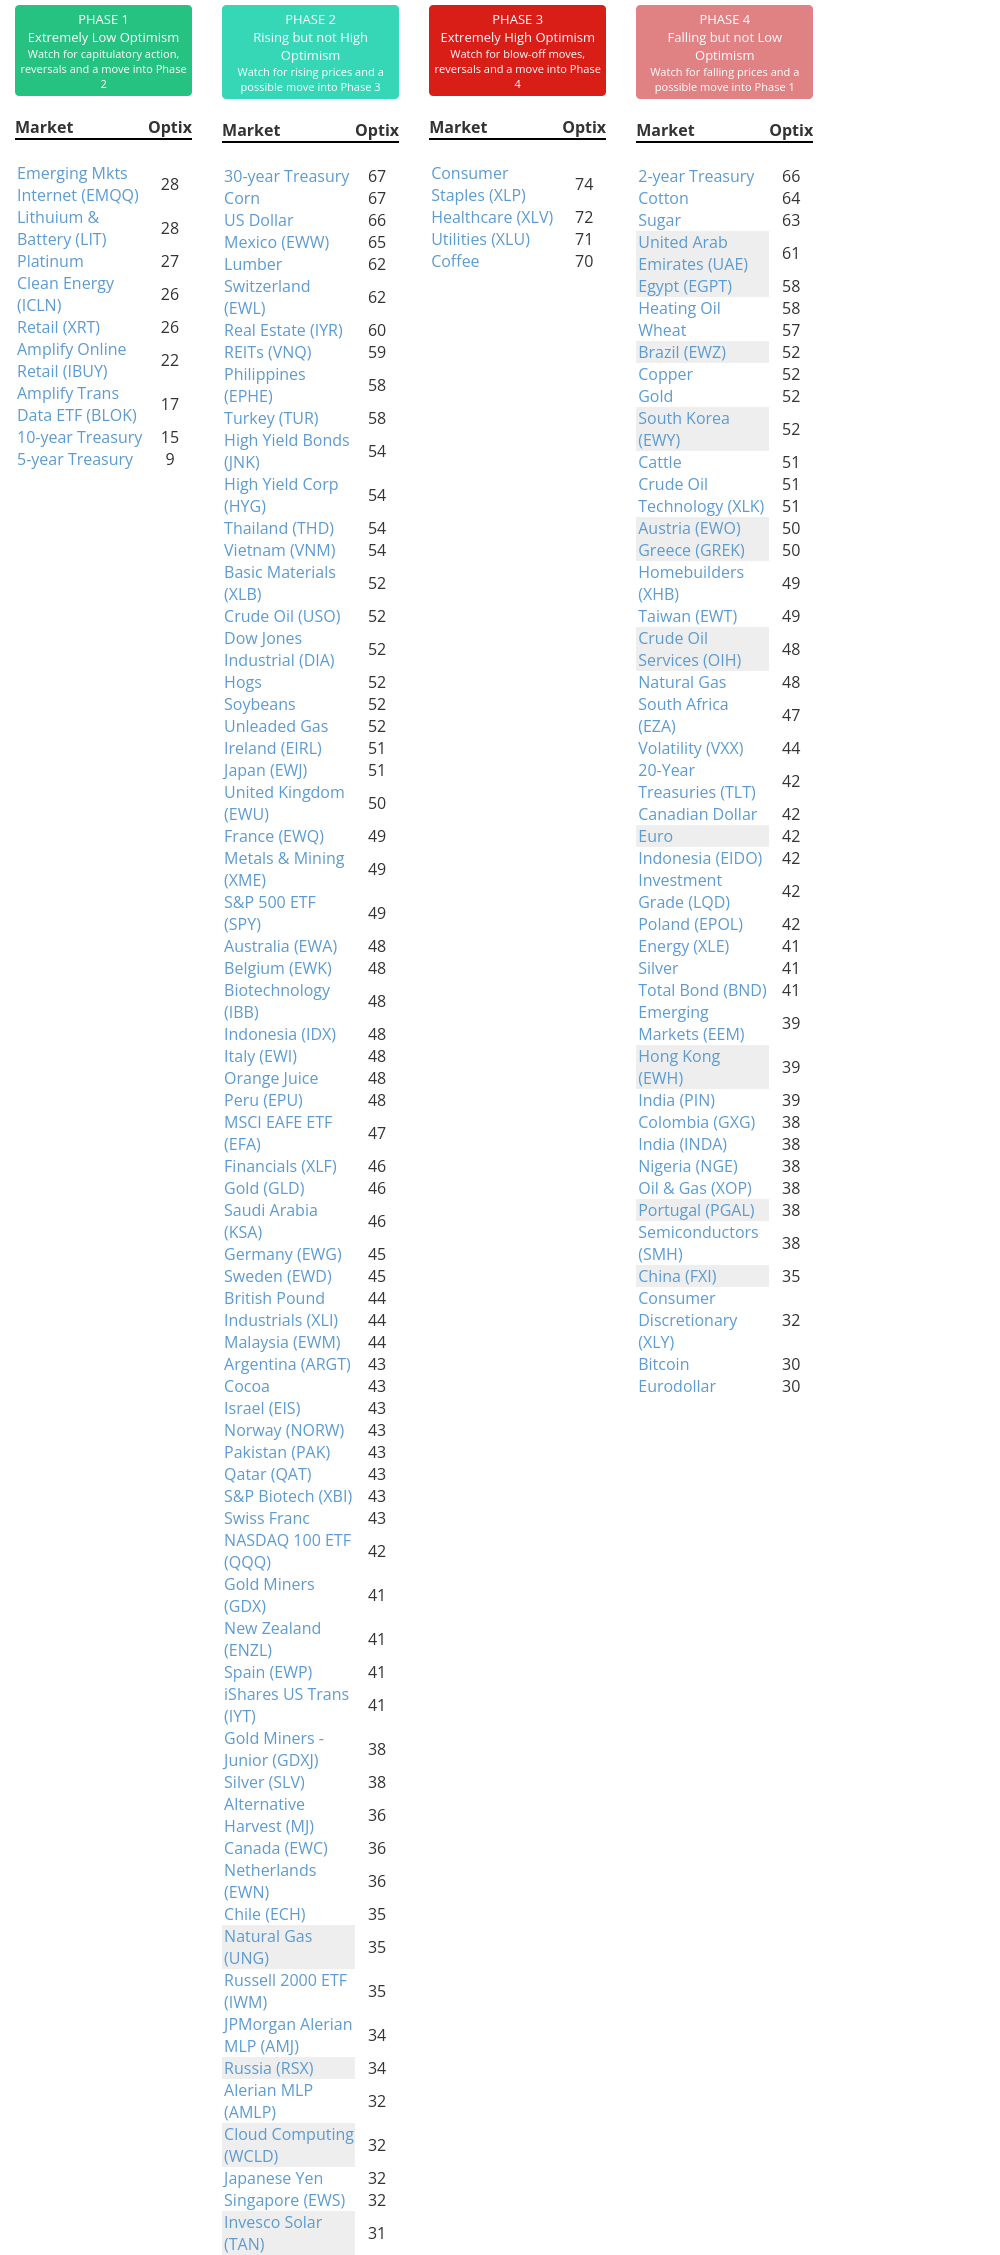
Phase Table
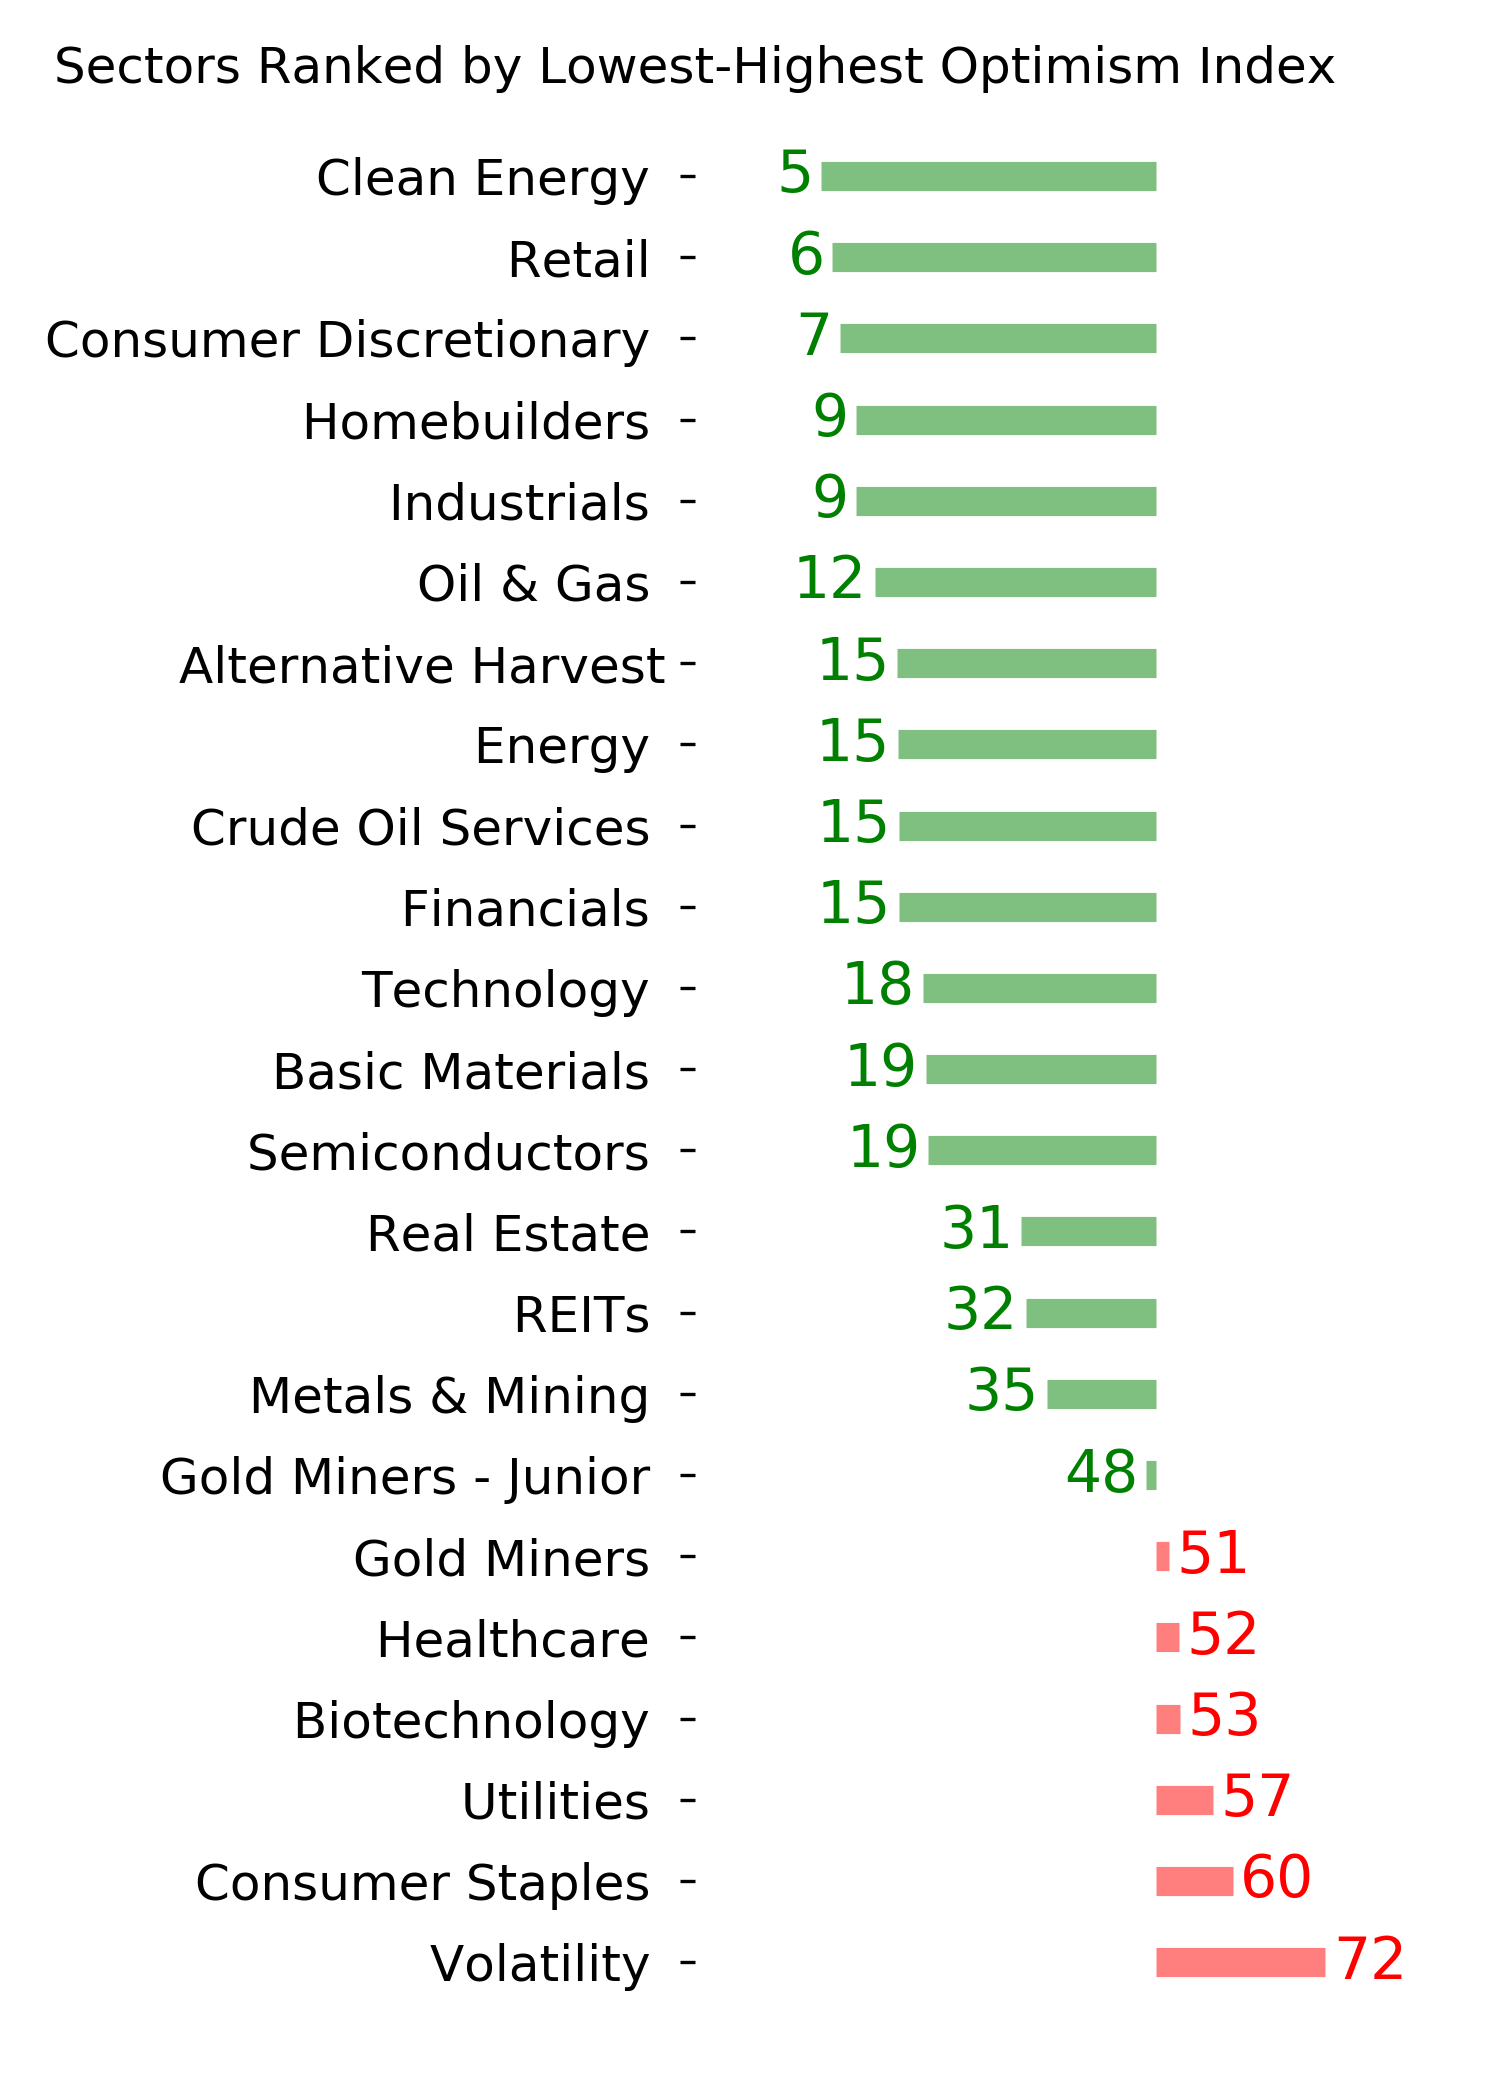
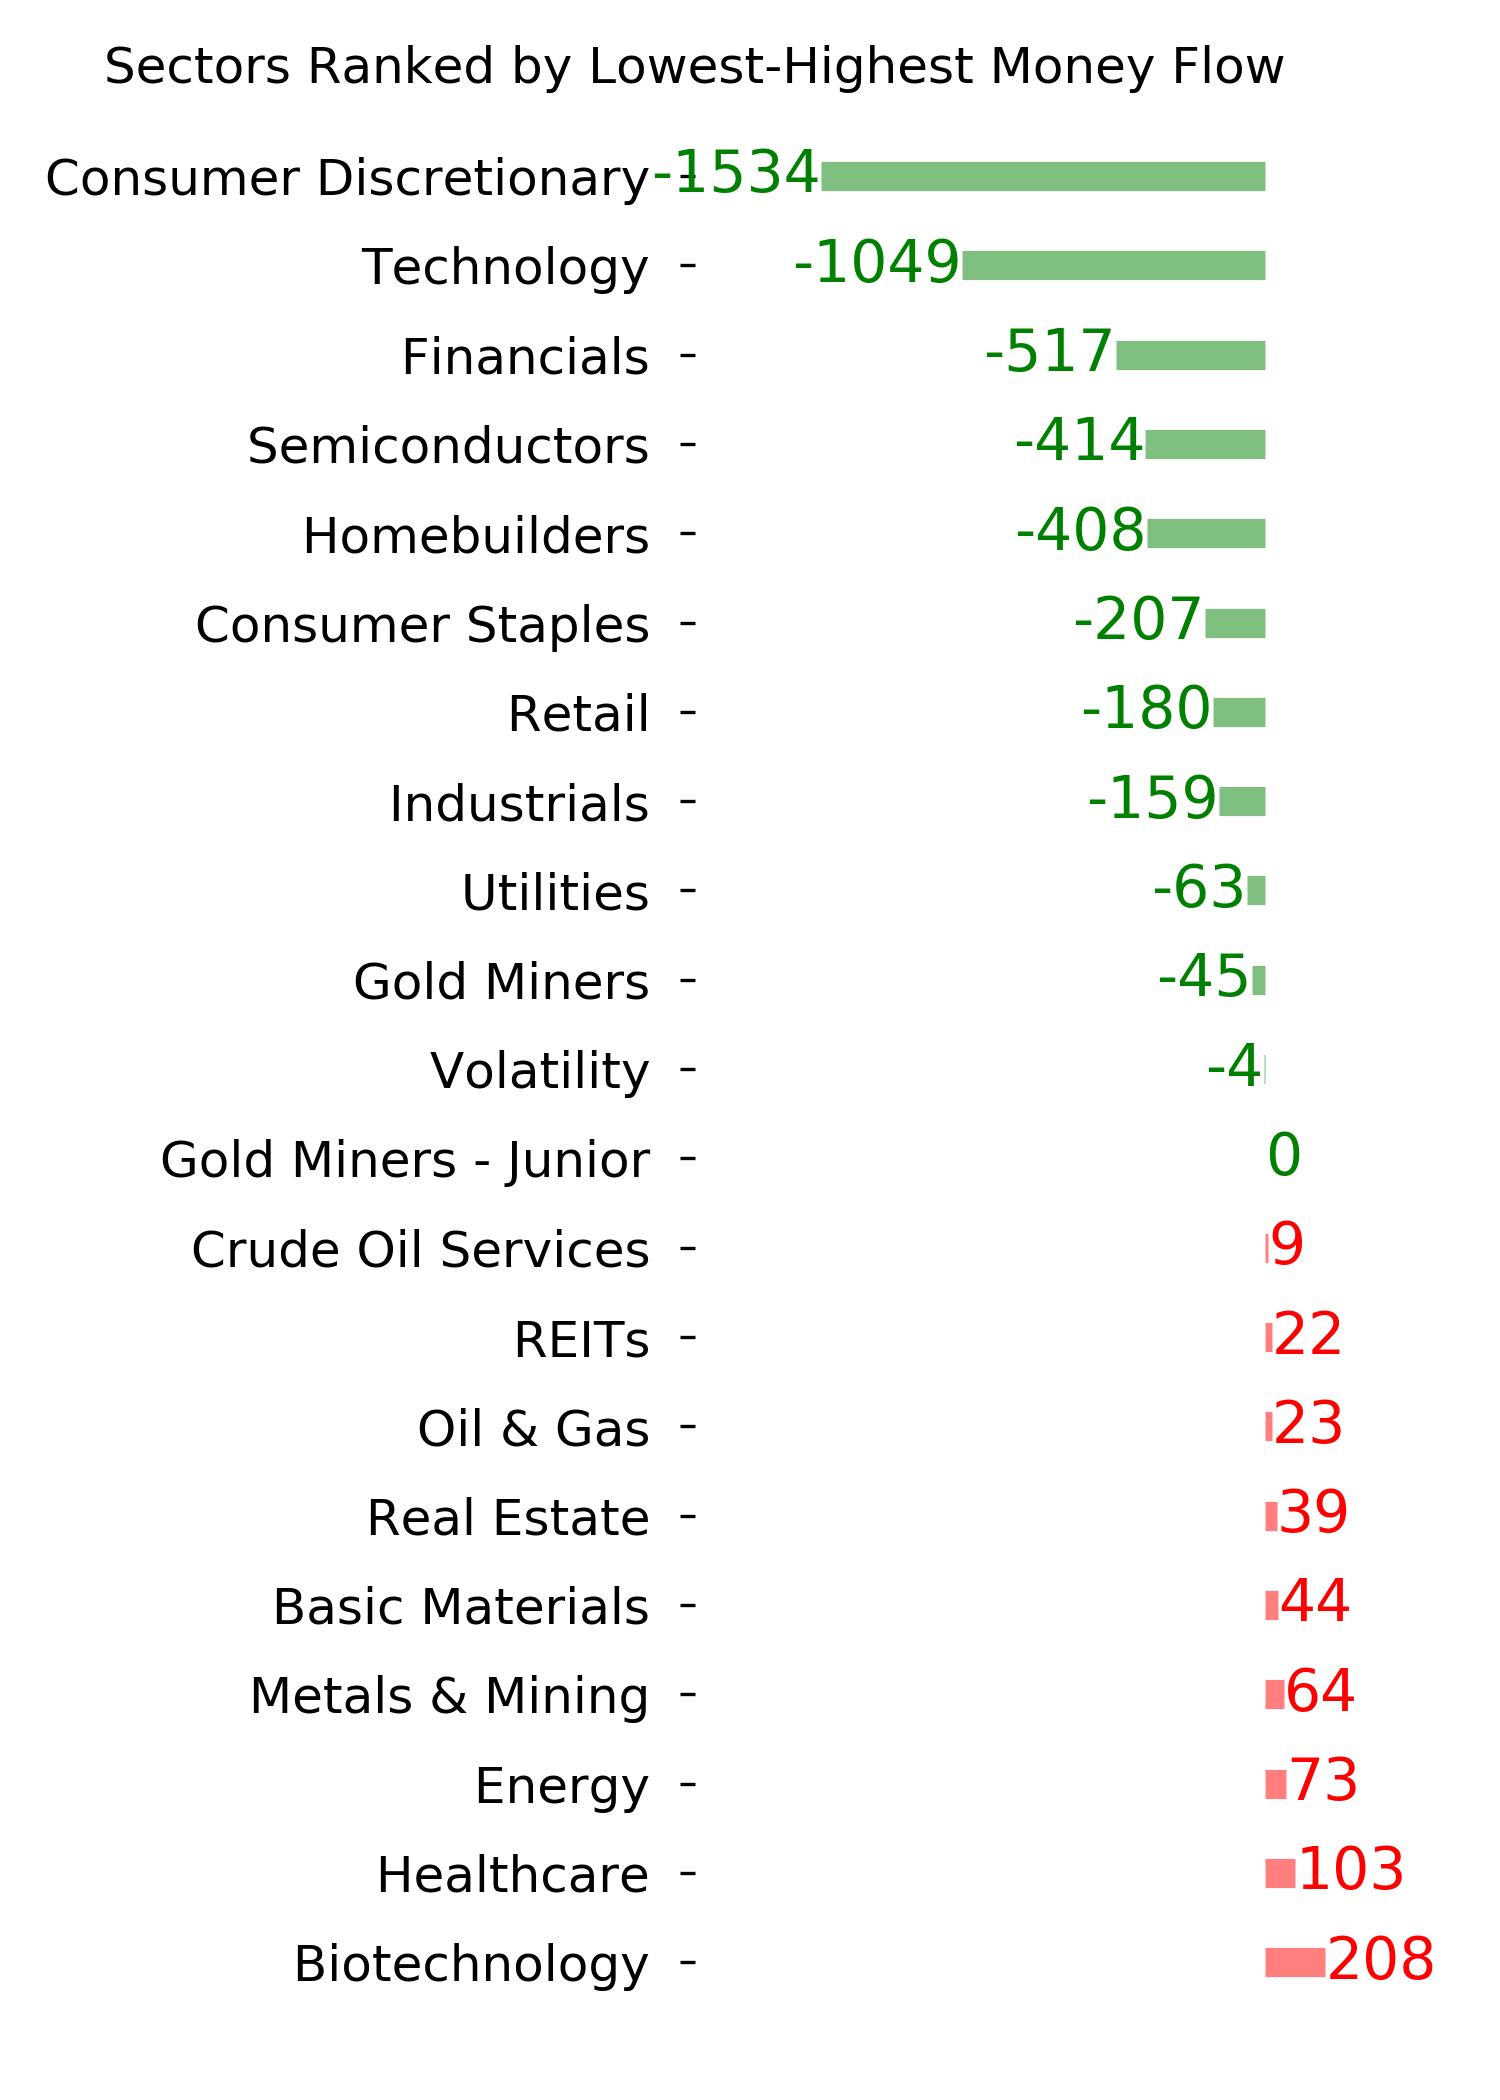
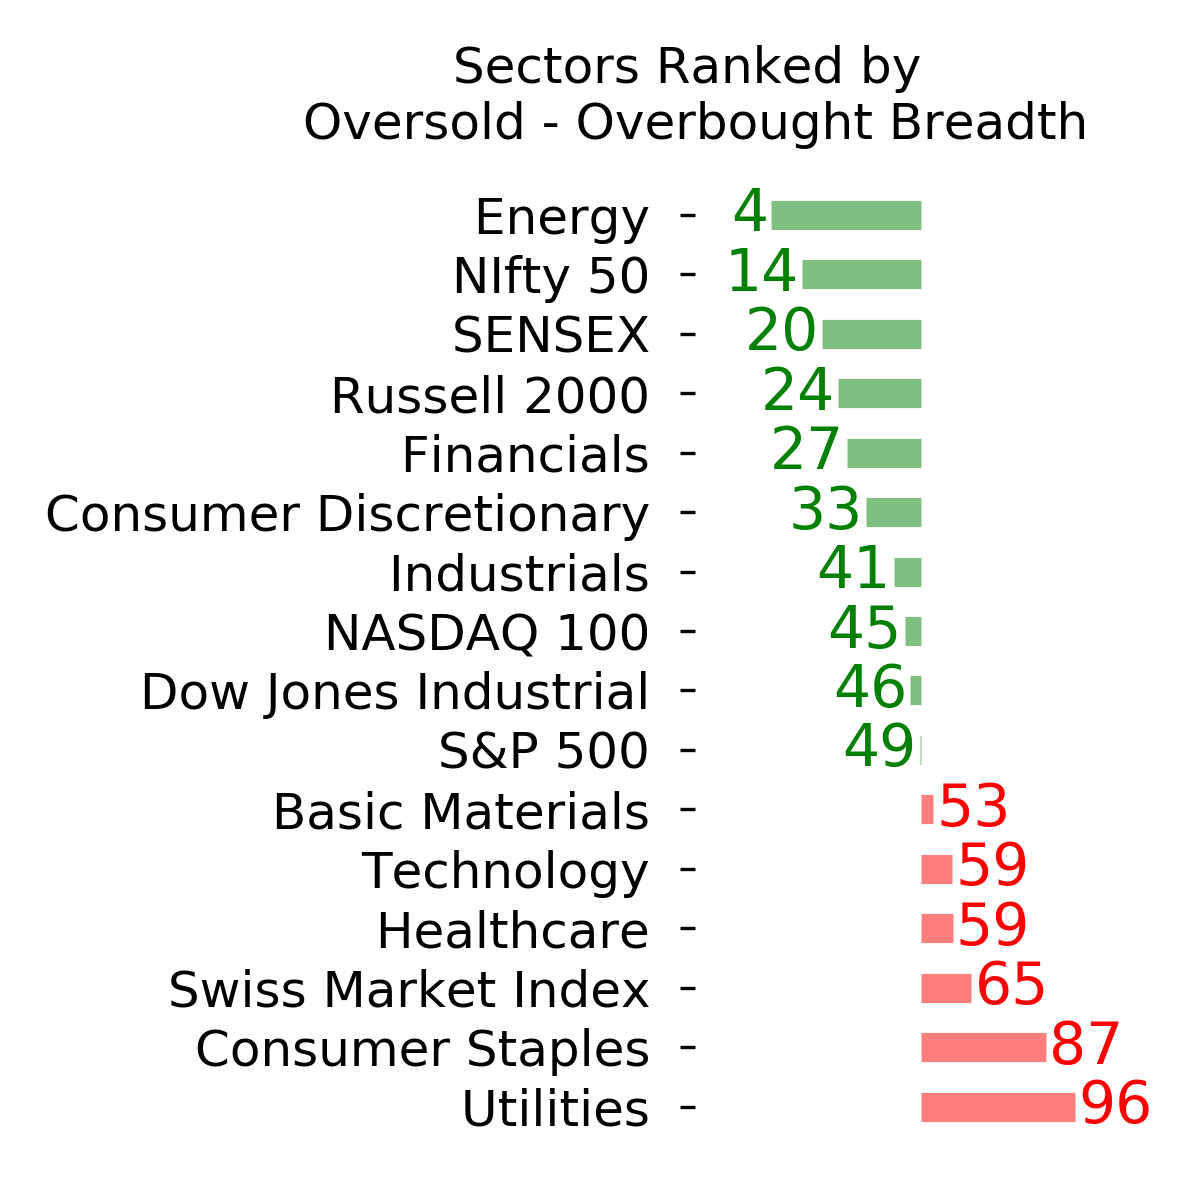
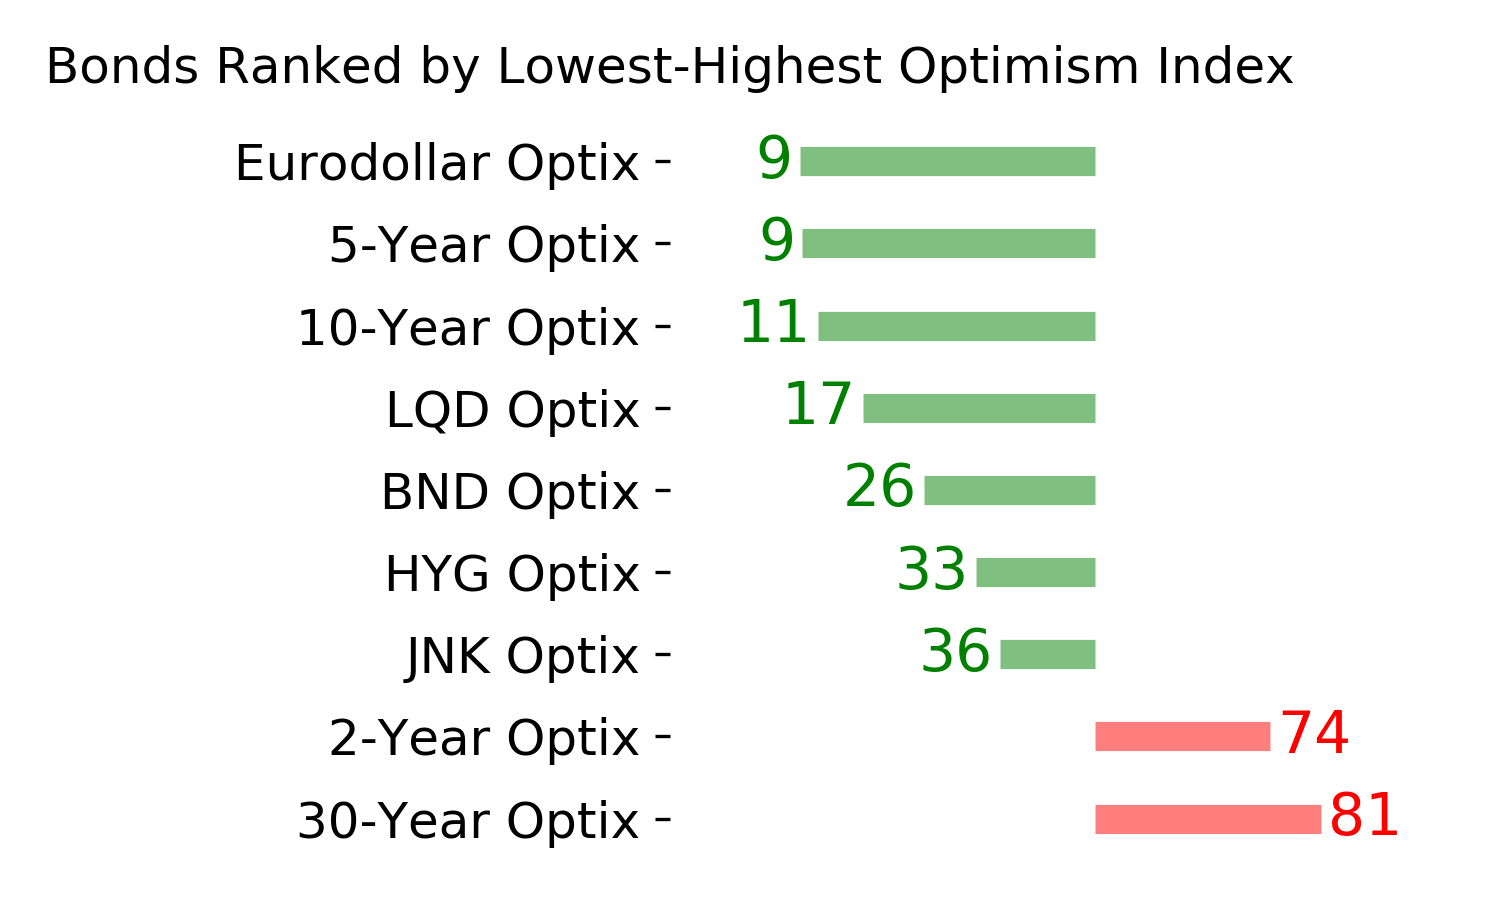
Ranks
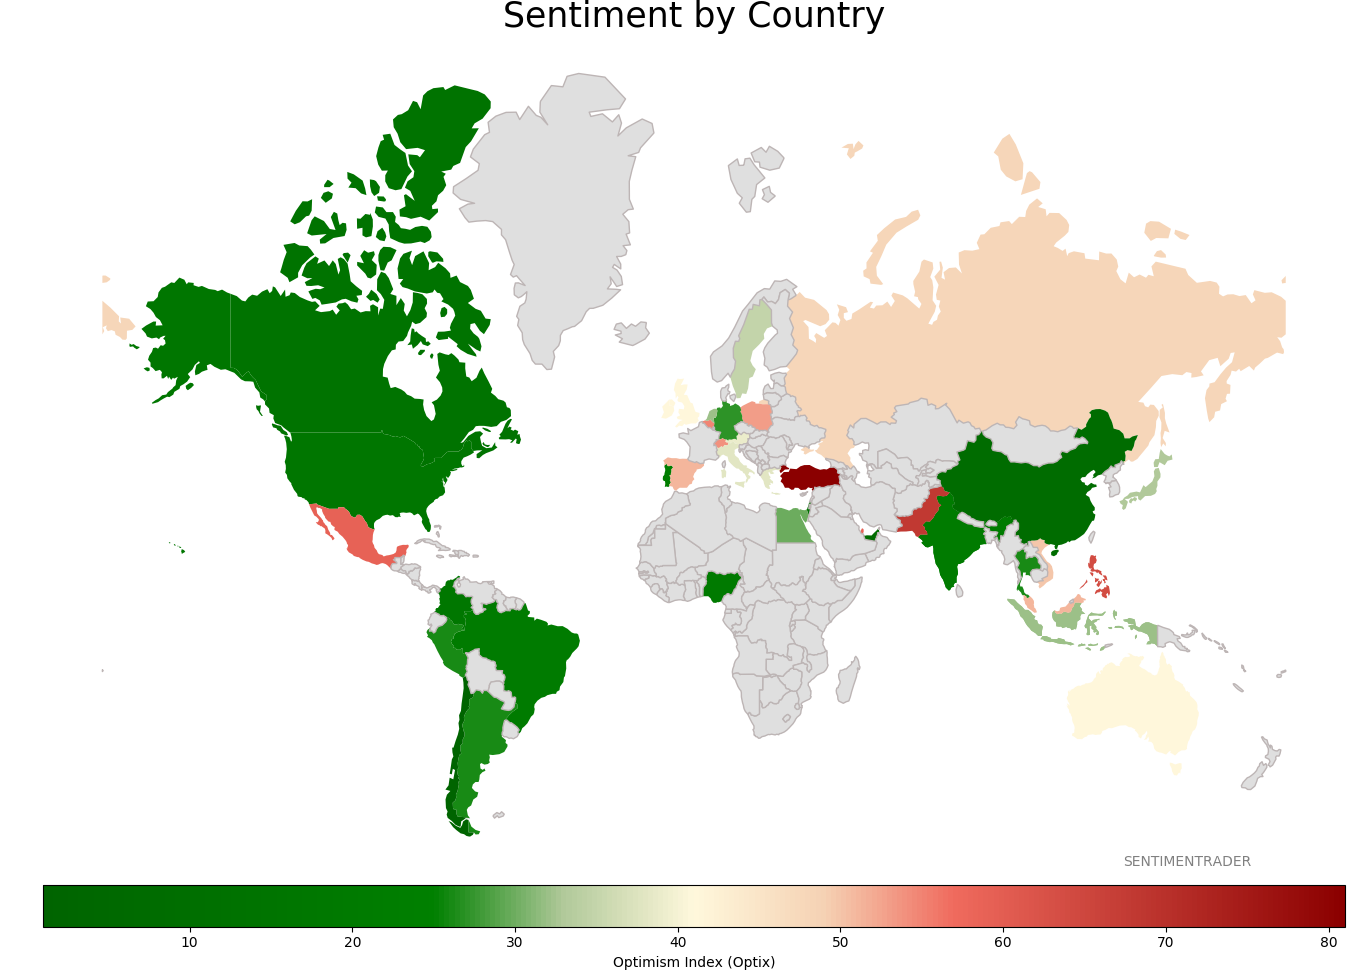
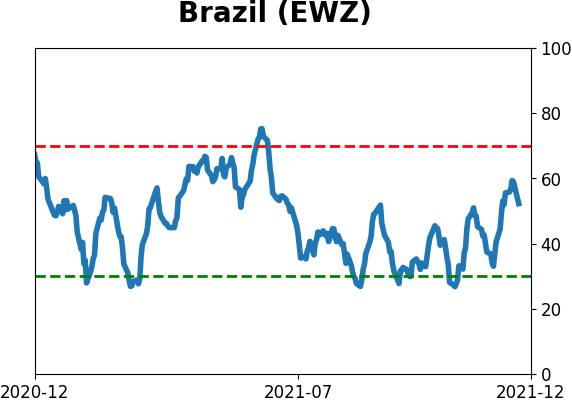
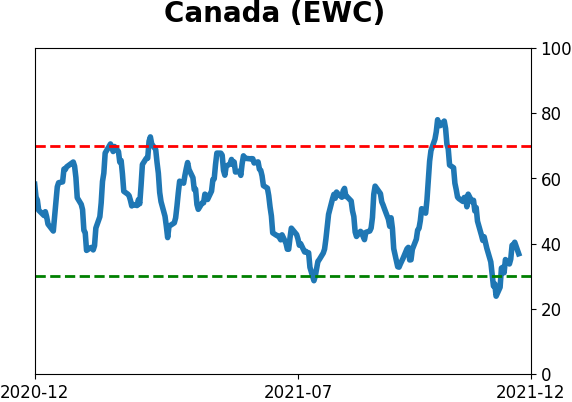
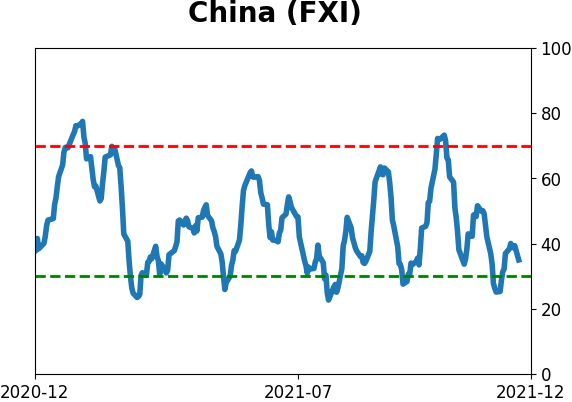
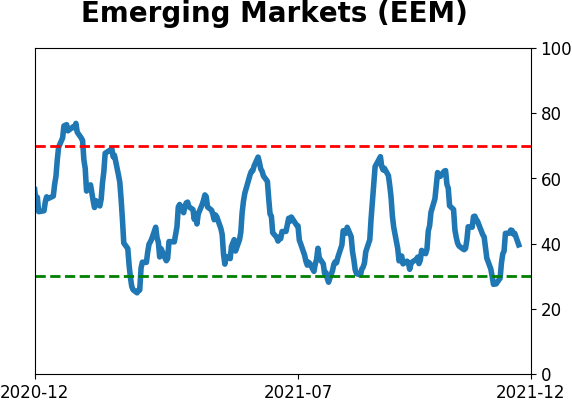
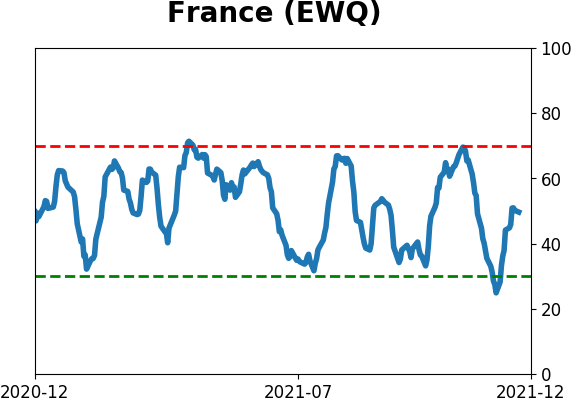
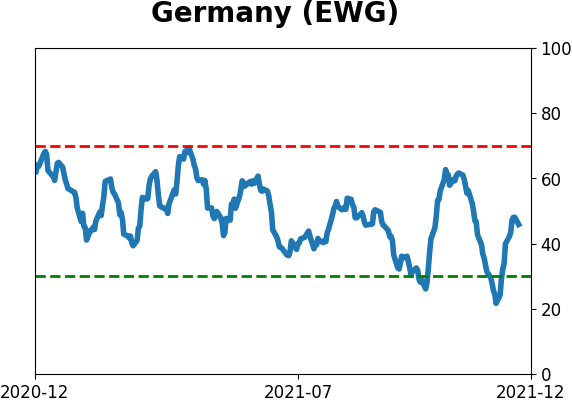
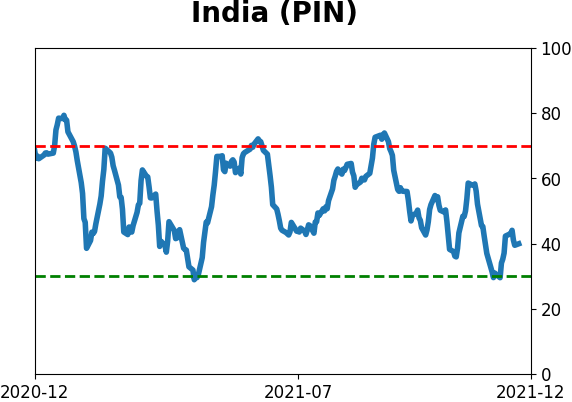
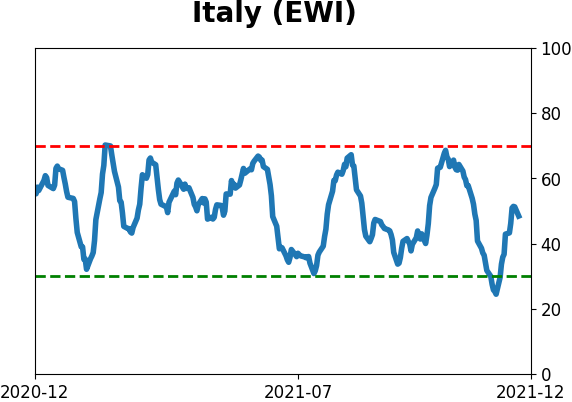
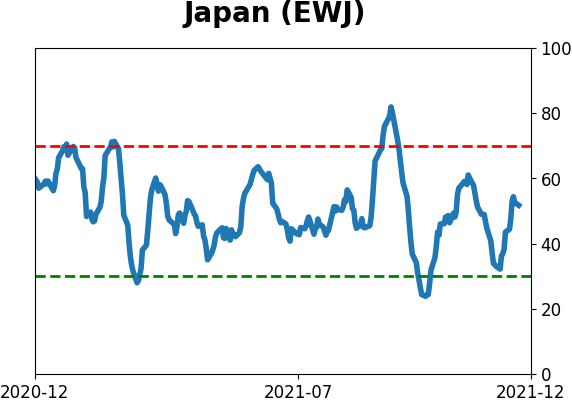
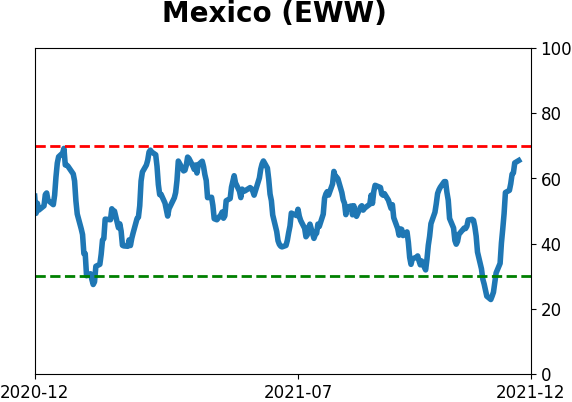
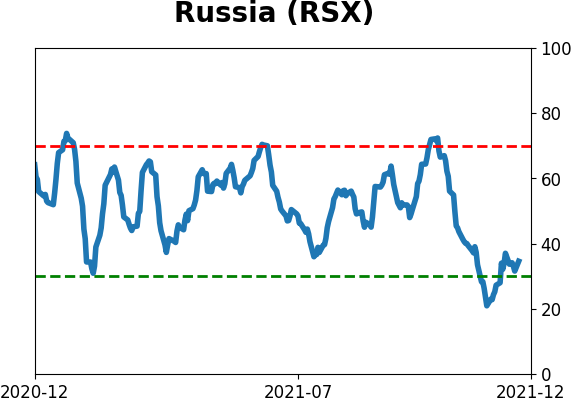
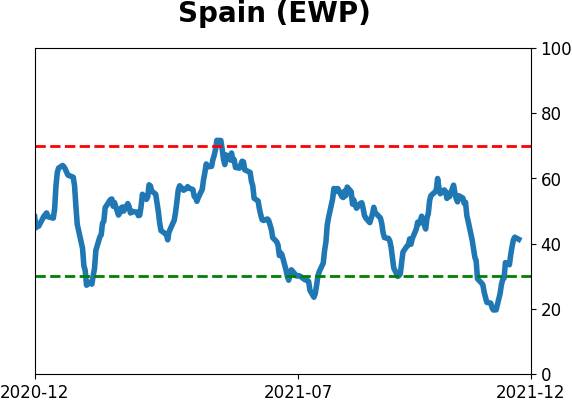
Sentiment Around The World
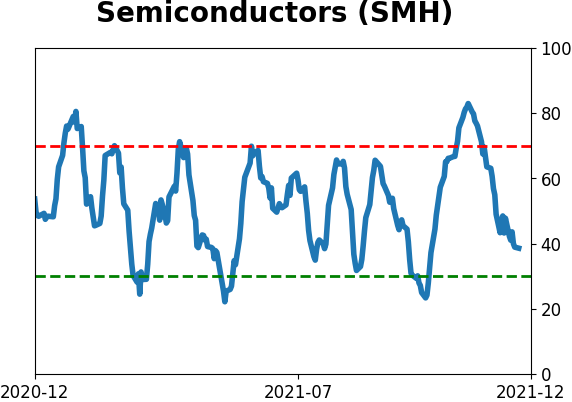
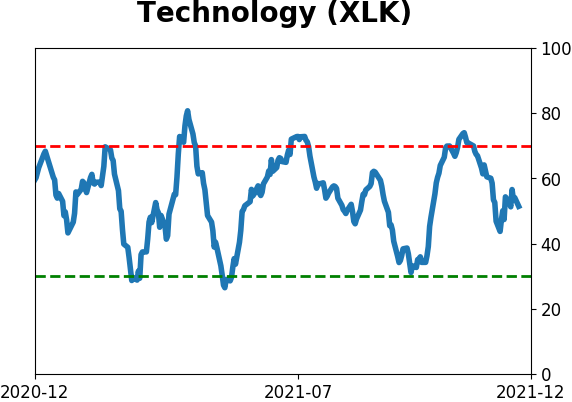
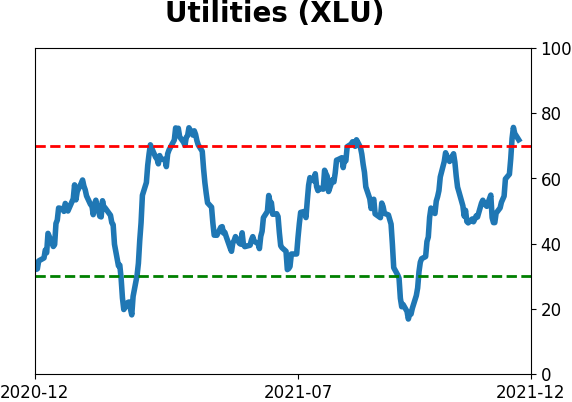
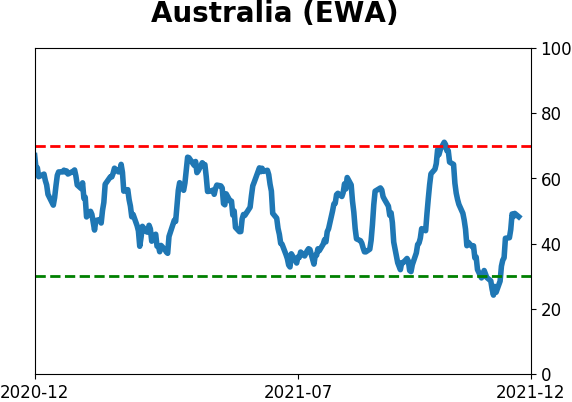
Optimism Index Thumbnails
|
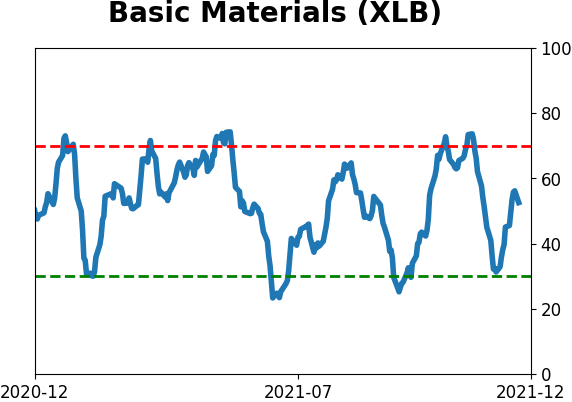
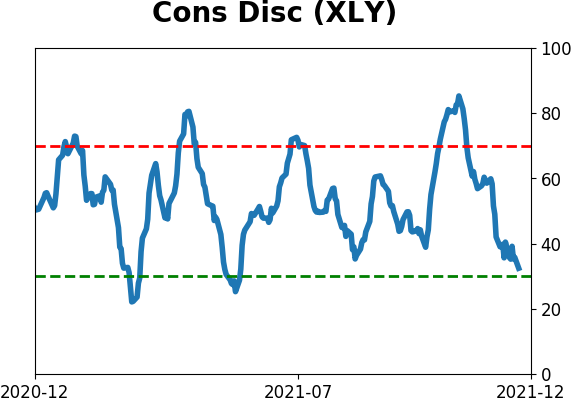
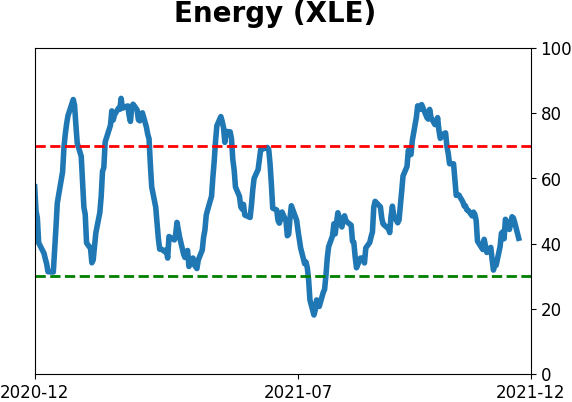
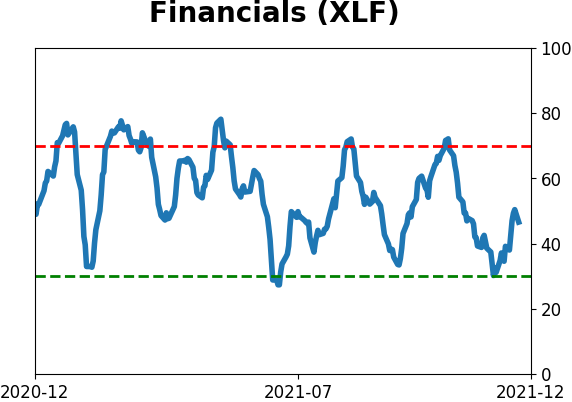
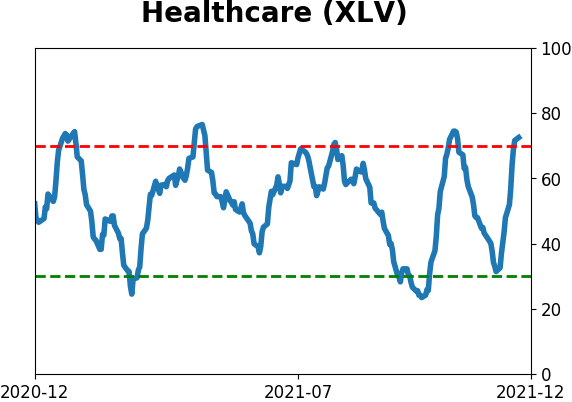
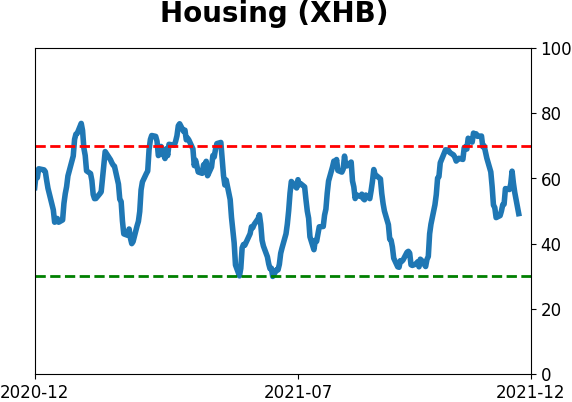
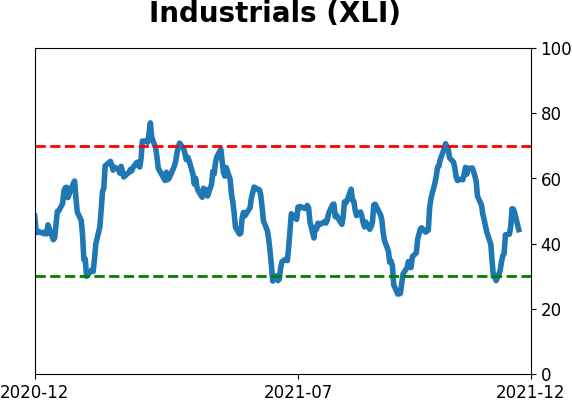
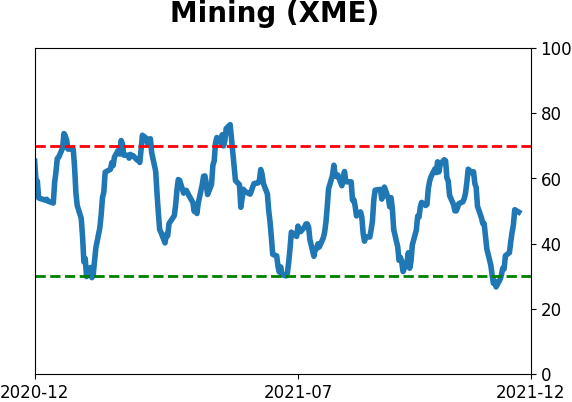
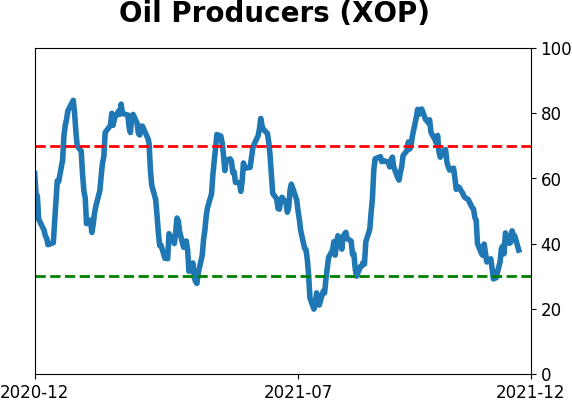
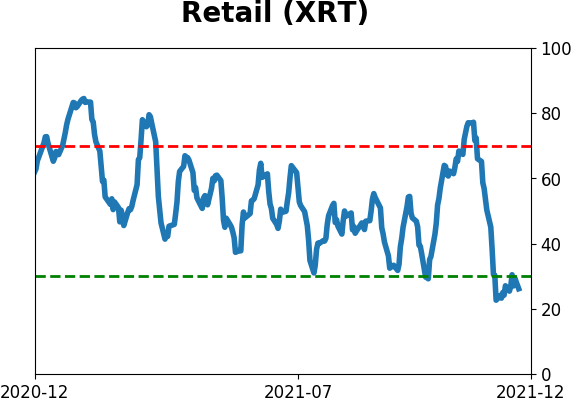
Sector ETF's - 10-Day Moving Average
|
|
|
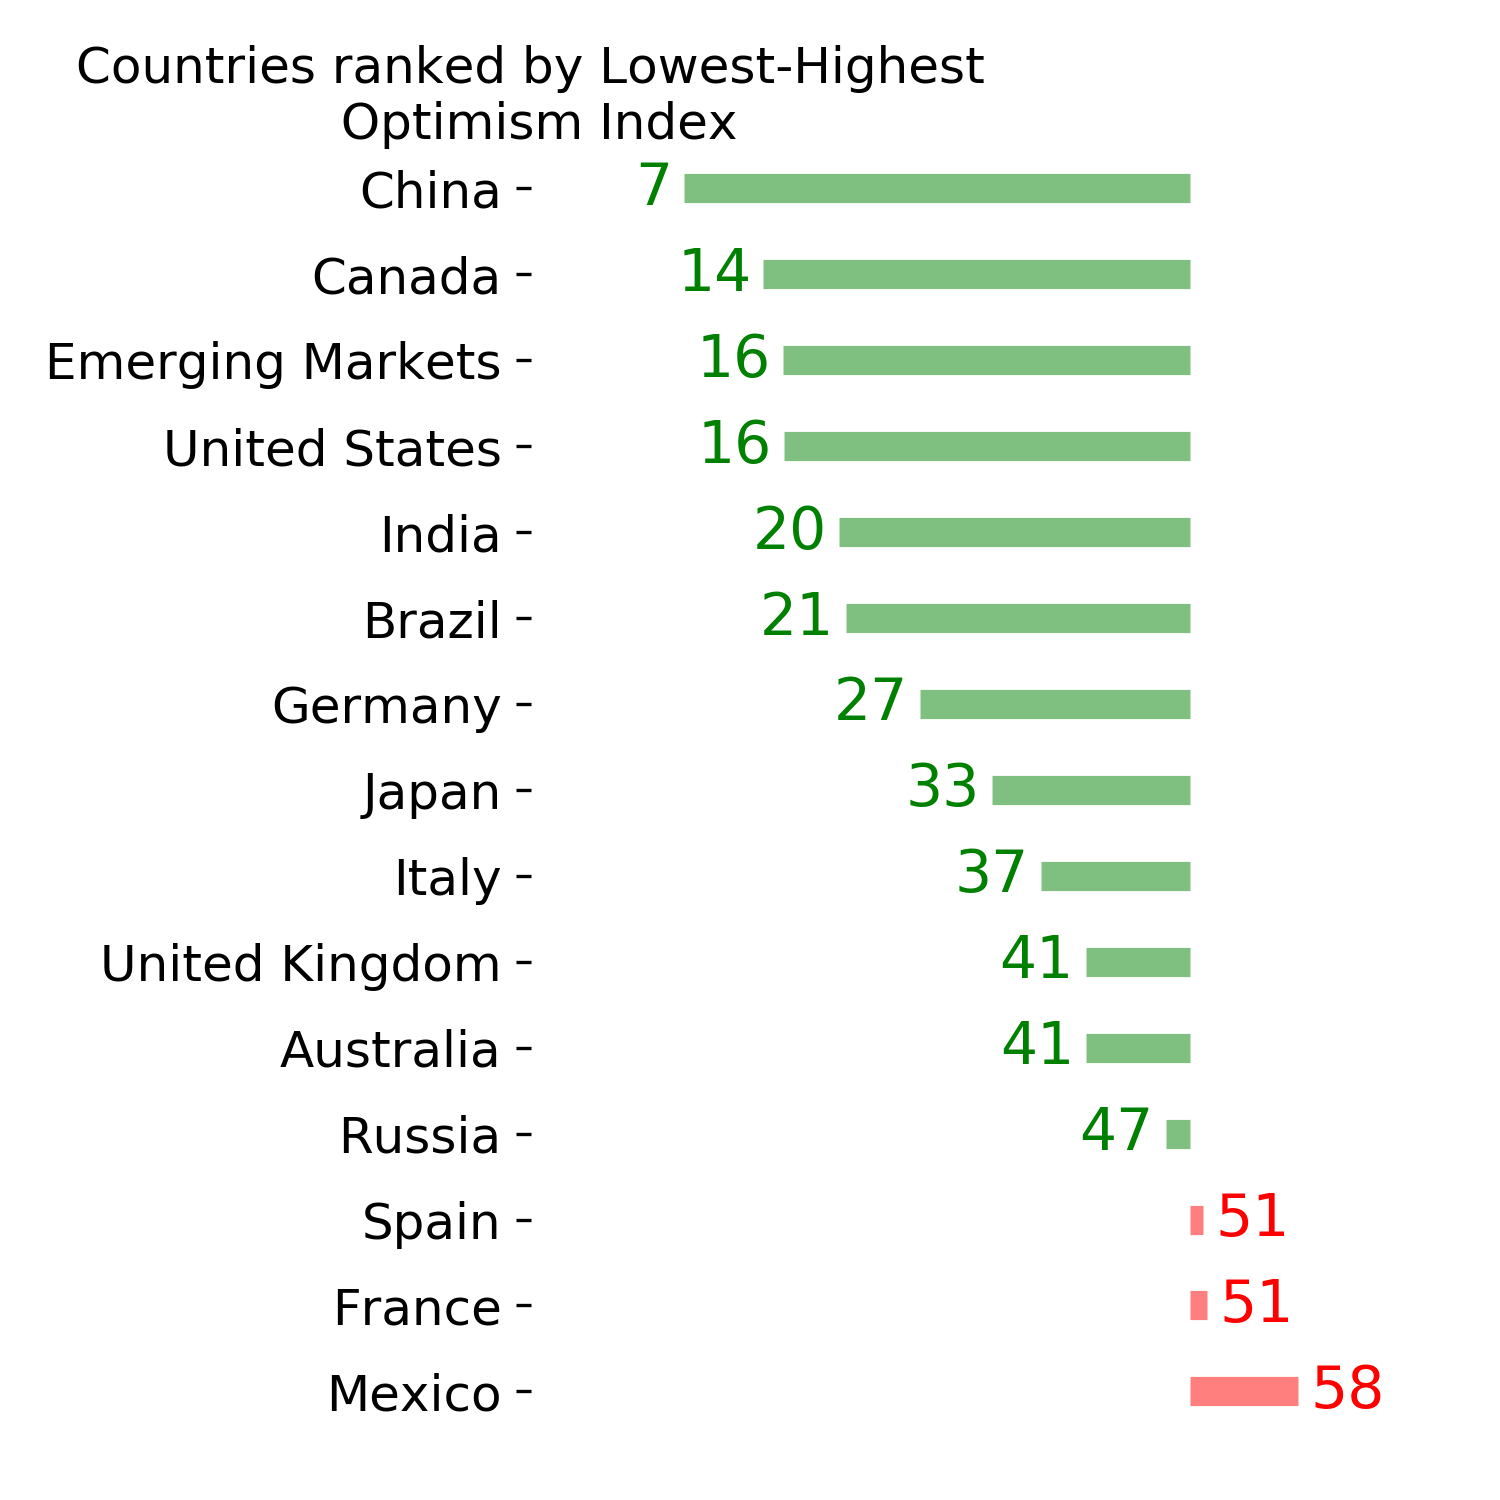
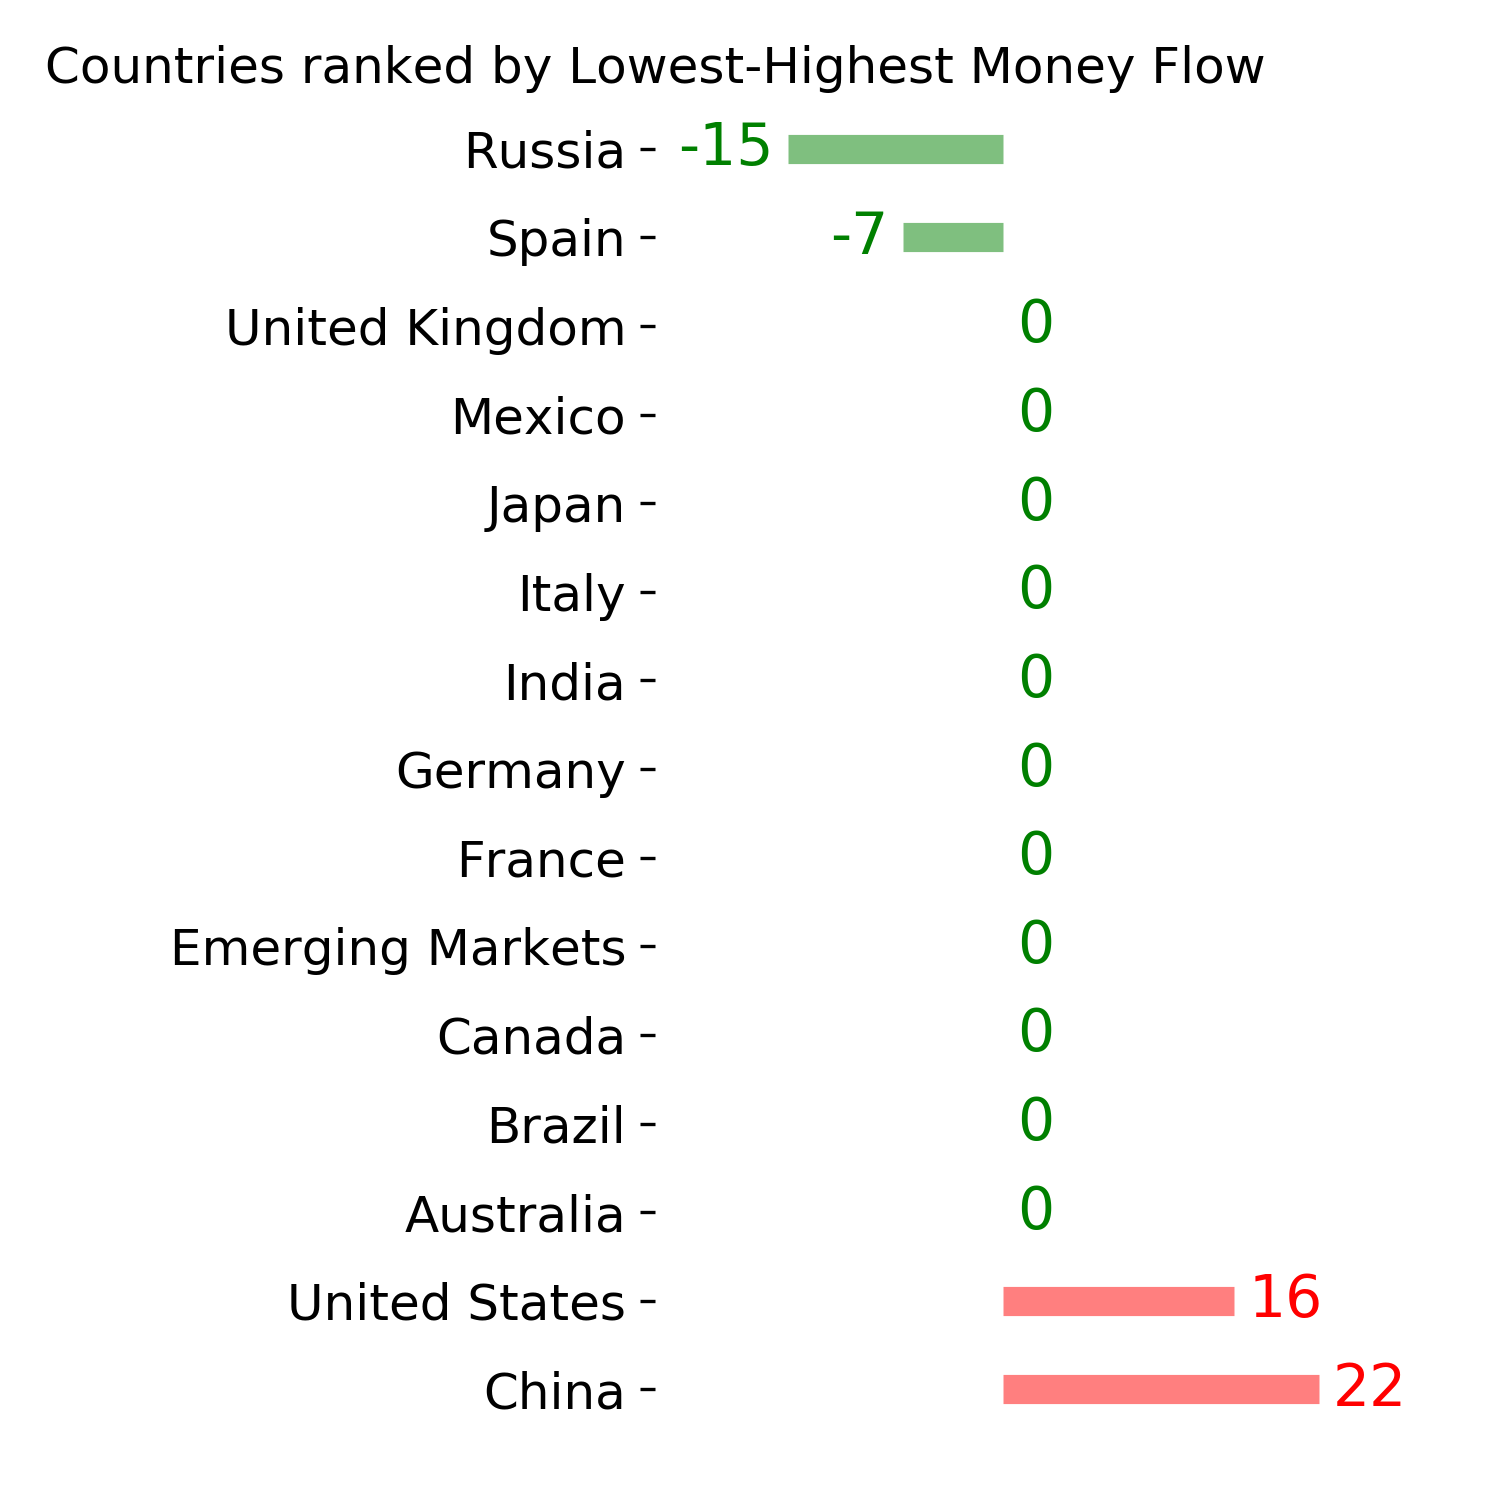
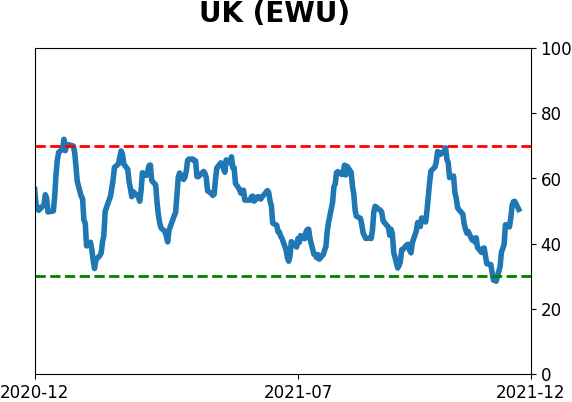
Country ETF's - 10-Day Moving Average
|
|
|
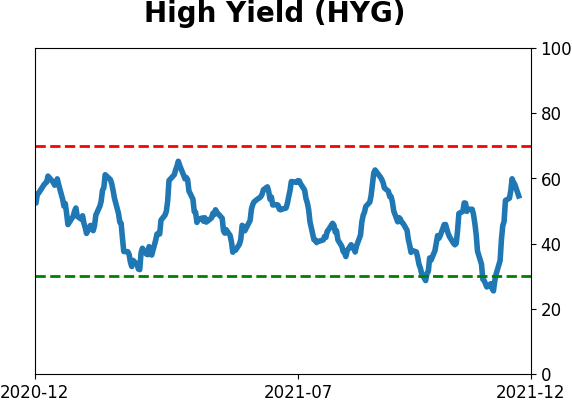
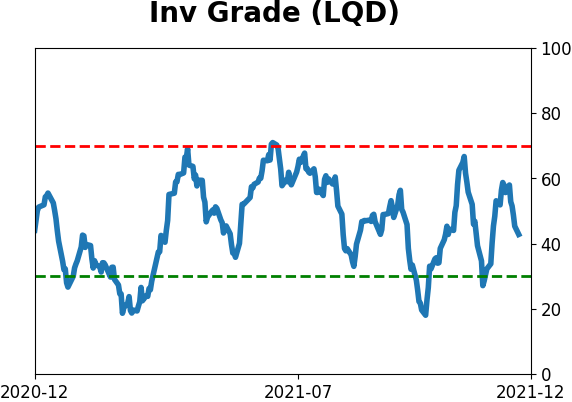
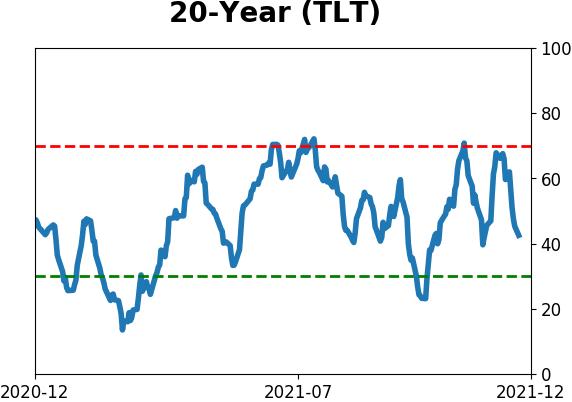
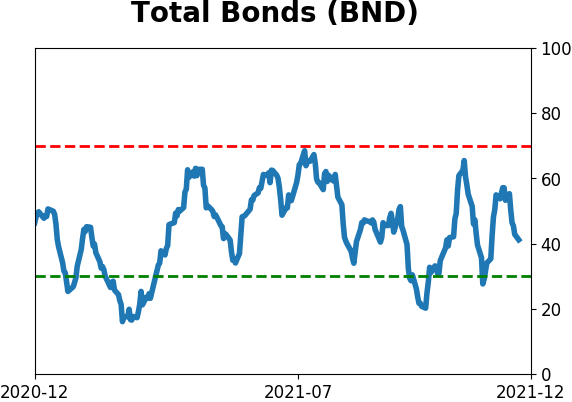
Bond ETF's - 10-Day Moving Average
|
|
|
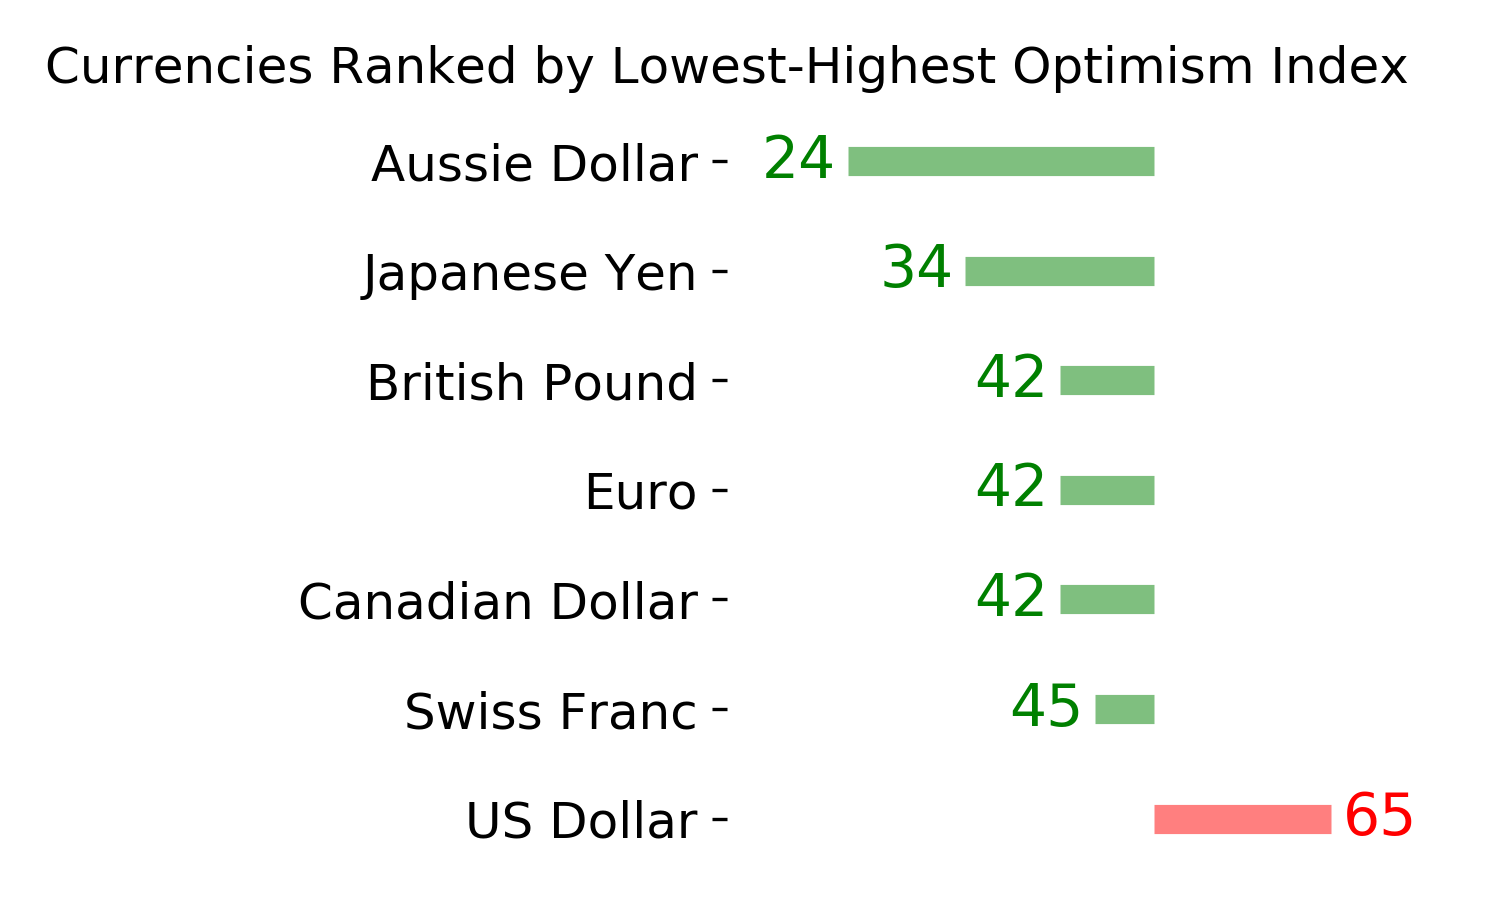
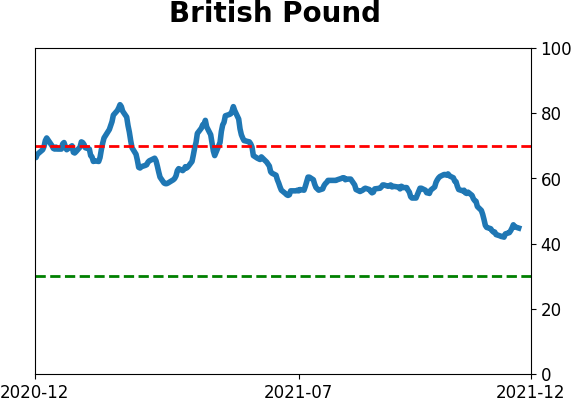
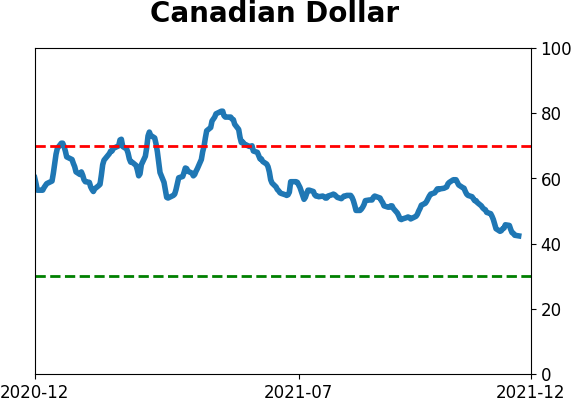
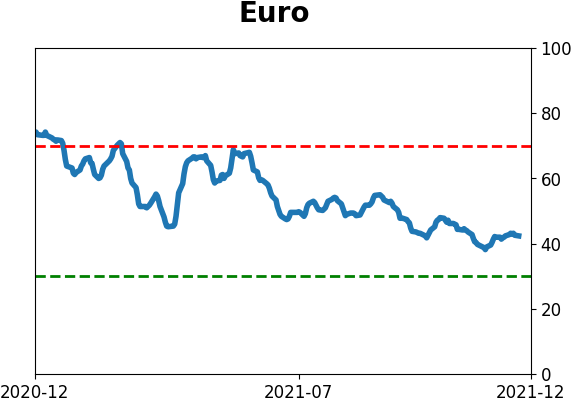
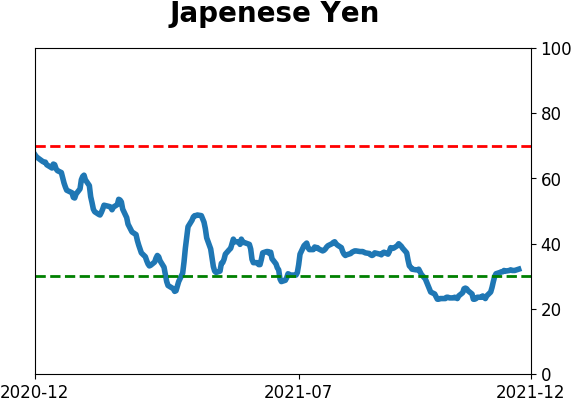
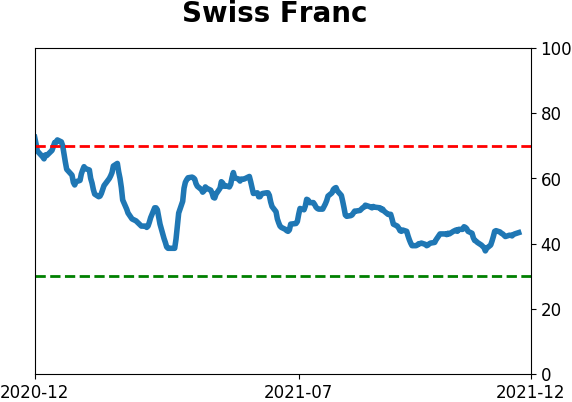
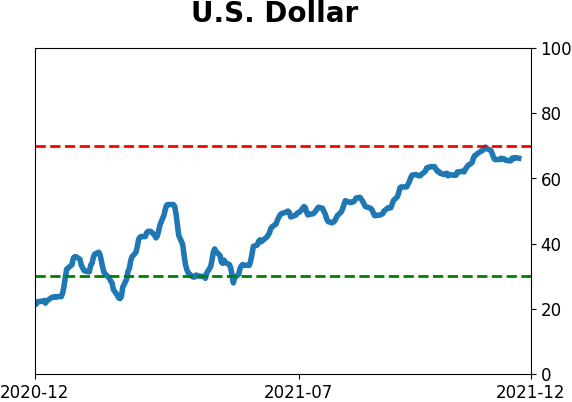
Currency ETF's - 5-Day Moving Average
|
|
|
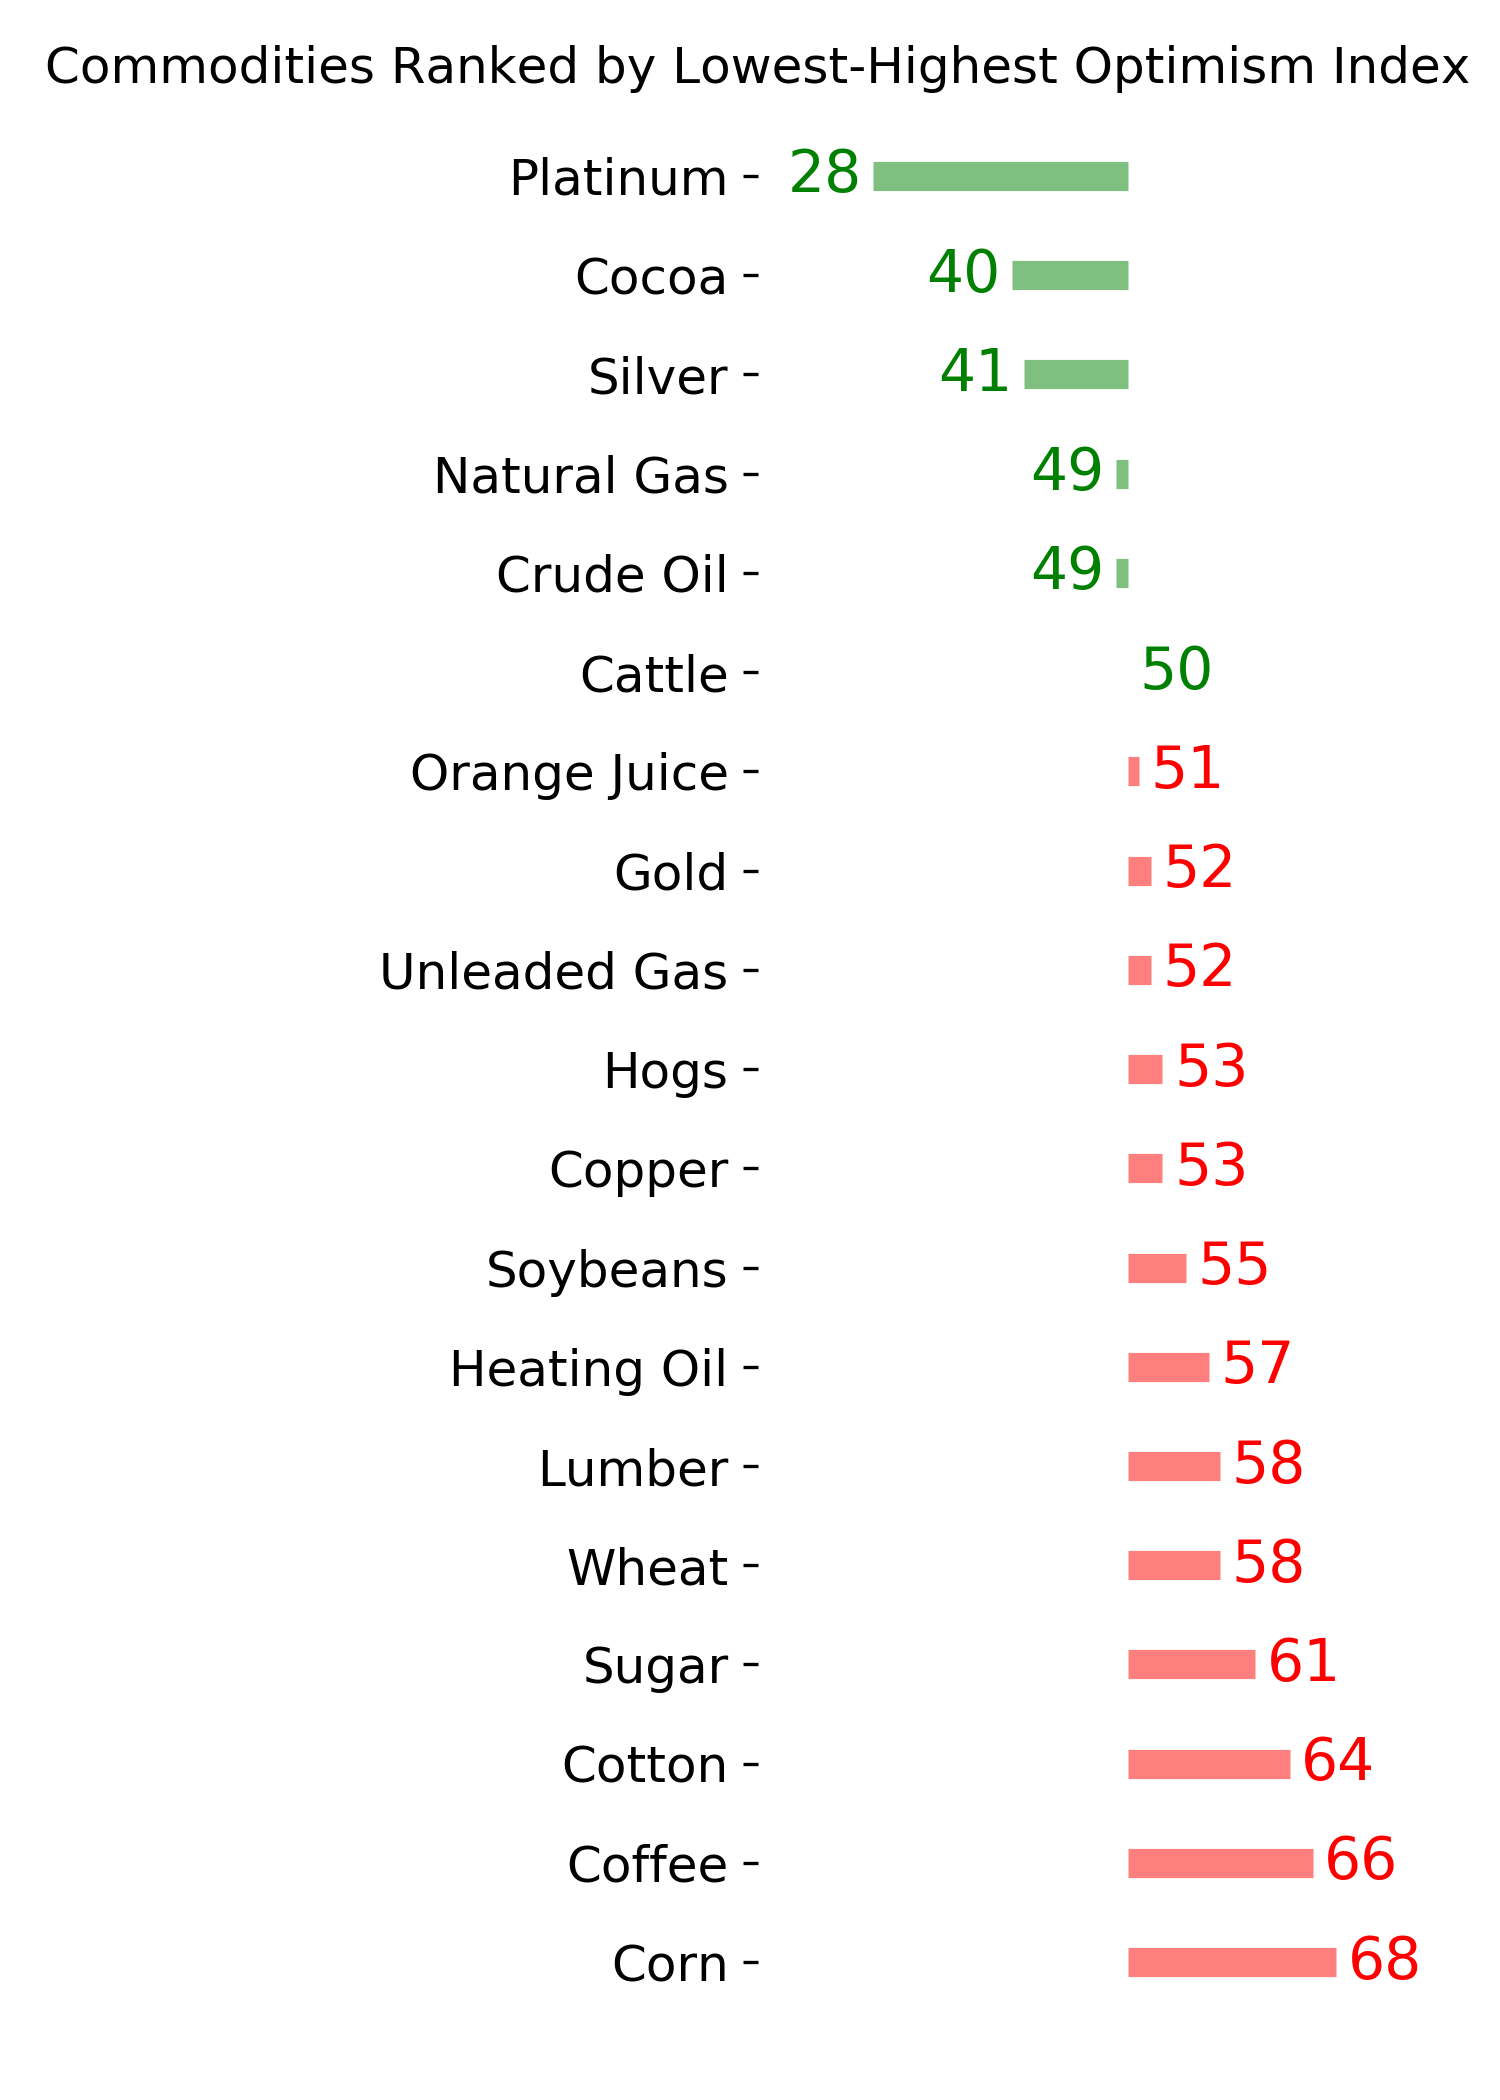
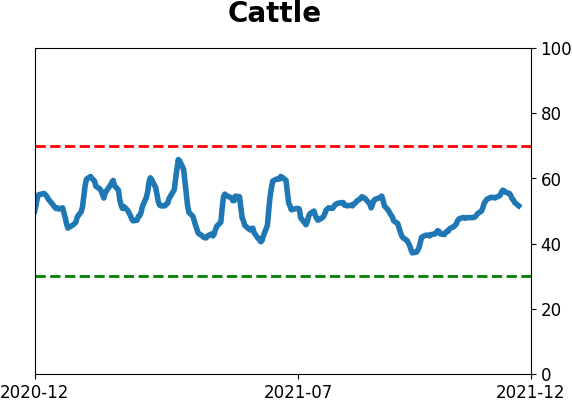
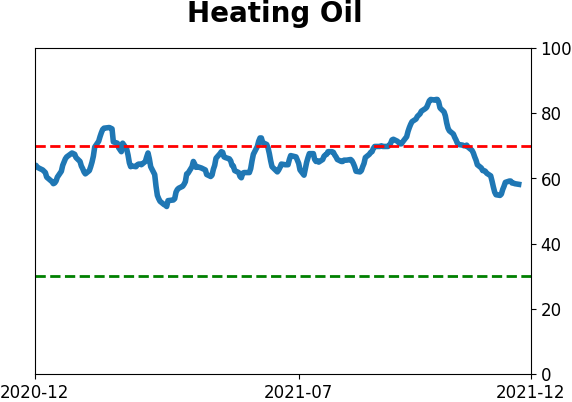
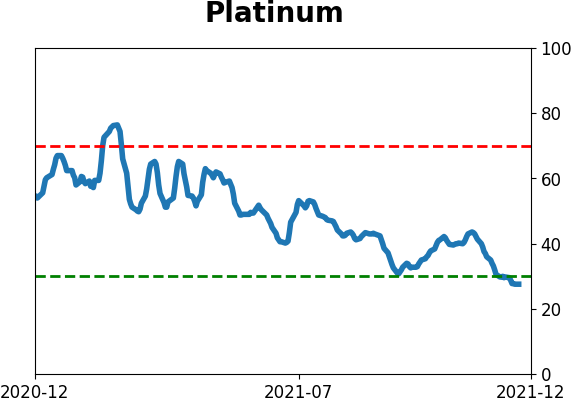
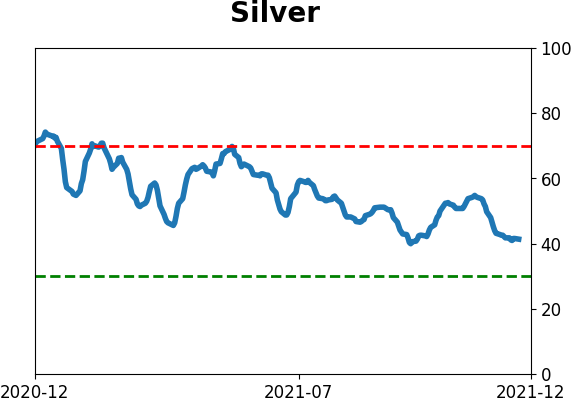
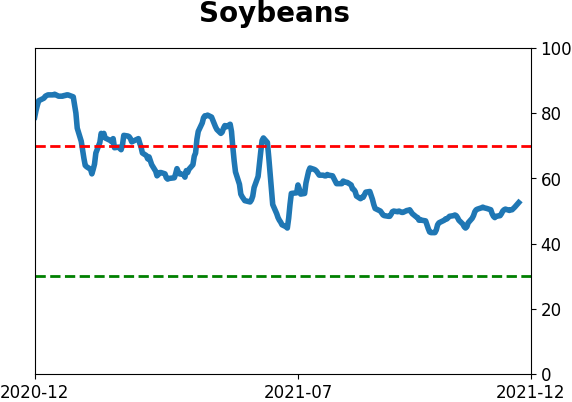
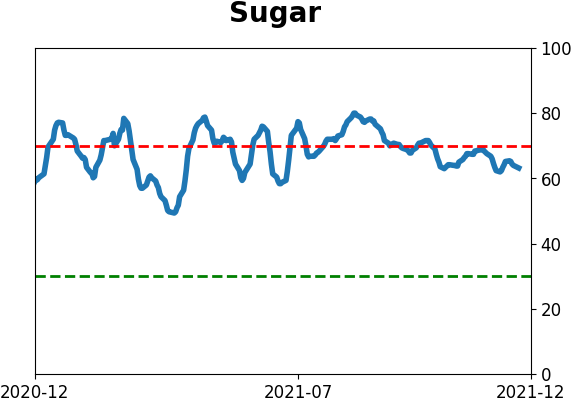
Commodity ETF's - 5-Day Moving Average
|
|